Multiple Stellar Populations of Globular Clusters from Homogeneous Ca–CN–CH Photometry. V. as a Surrogate Index and NGC 6723.111Based on observations made with the Cerro Tololo Inter-American Observatory (CTIO) 1 m telescope, which is operated by the SMARTS consortium, and the Kitt Peak National Observatory (KPNO) 0.9 m telescope, which is operated by WIYN Inc. on behalf of a Consortium of partner Universities and Organizations. 222This work has made use of data from the European Space Agency (ESA) mission Gaia (https://www.cosmos.esa.int/gaia), processed by the Gaia Data Processing and Analysis Consortium (DPAC, https://www.cosmos.esa.int/web/gaia/dpac/consortium). Funding for the DPAC has been provided by national institutions, in particular the institutions participating in the Gaia Multilateral Agreement.
Abstract
We introduce new color indices (= ) and [=], accurate photometric measures of the CN band at 3883 and the CH G band, respectively, in the study of the multiple populations (MPs) in globular clusters (GCs). Our photometric CN–CH relation for a large number of red-giant branch (RGB) in M5 shows that the evolutions of the CN and CH between the CN-w and CN-s populations are not continuous. Armed with our new color indices, we investigate the MPs of NGC 6723, finding the RGB populational number ratio of (CN-w):(CN-s) 35.5:64.5 (2.8) with no radial gradient. Similar to other normal GCs with MPs, the helium abundance of the CN-s population inferred from the RGB bump magnitude is slightly enhanced by = 0.012 0.012. Our and color-magnitude diagrams clearly show the discrete double AGB populations in NGC 6723, whose bright AGB populational number ratio is in marginally agreement with that of the RGB stars within the statistical errors. Finally, our synthetic index is in good agreement with observations, except for the CN-w asymptotic giant branch (AGB). To mitigate the discrepancy in the CN-w AGB may require a mild nitrogen enhancement and/or a large decrement in the 12C/13C ratio with respect to the bright RGB.
1 Introduction
The discovery that the normal globular clusters (GCs) in our Galaxy contain multiple populations (MPs) demanded a paradigm shift and would surely be one of the most greatest achievements in stellar and galactic astrophysics during the past decade (e.g., see Carretta et al., 2009; Lee et al., 2009a; Piotto et al., 2015). In observational perspective, one of the important issues is an increasing need for the clear and simple definition of MPs in GCs. In low-resolution spectroscopy, the well-known ubiquitous nature of the CN bimodal distributions in GCs can serve a pivotal role in populational tagging, since the discrete multiple sequences resulted from the nitrogen enhancement of the later generation of the stars is a hallmark of MPs in GCs. In high-resolution stellar spectroscopy, the assignment of MPs had been usually performed on the Na–O plane, where the evolutions of oxygen and sodium between MPs are appear to be continuous mainly due to the large uncertainties in spectroscopic measurements (e.g., see Marino et al., 2008; Lee, 2010, 2016; Carretta, 2014). Also, the spectroscopic study of MPs had been always restricted to bright stars and can not be applied to crowded fields, such as the central part of GCs in which most of GC membership stars reside.
The populational tagging in stellar photometry can be more complex and subtle. In our previous works (Lee, 2017, 2018, 2019a), we assessed the utility of various photometric systems used in the study of MPs in GCs, finding that some of the widely used photometric systems, such as the Strömgren , indices, the Sloan Digital Sky Survey (SDSS) photometric system, and the [=] index, for example, may not be well-suited for the accurate populational tagging of individual stars in GCs with MPs.
In this paper, we proceed further and introduce a new set of the photometric index that can be very useful in the study of MPs in GCs: (= ) and [=]. They are accurate photometric measures of the CN band at 3883 and the CH G band at 4250, respectively. As we will show later, the index is an excellent surrogate .
Armed with new set of photometric indices, we investigate the MPs of NGC 6723. Lim et al. (2016) reported an interesting result that the cumulative radial distribution of the CN-w red-giant branch (RGB) population of the cluster is more centrally concentrated than that of the CN-s population is, leading them to argue that an observational line of the counterexample to the currently accepted formation scenario for GCs with MPs (e.g., see Bekki, 2010). We will show later that both the CN-w and CN-s populations in NGC 6723 have identical cumulative radial distributions and the results presented by Lim et al. (2016) were in error, mainly due to their incorrect populational assignment of the individual stars from a poor photometric CN tracer.
The outline of this paper is as follows. In Section 2, we show the definitions of photometric indices used in our study. In Section 3, we discuss our new photometric index, , and the CH band contamination of the continuum sidebands of the spectroscopic measurements of the CH G band will be discussed. In Section 4, the utilities of our photometric indices, such as a photometric CN–CH anticorrelation in M5 RGB stars is discussed. In Section 5, we discuss the CH band contamination in the passband of the Ca II H & K region. Finally, in Section 6, we discuss some aspects of the MPs of the inner halo GC NGC 6723, including the He enhancement in the CN-s population, identical cumulative radial distributions in individual populations and a hint for the nitrogen enhancement and the decrement in the carbon isotopes ratio in the CN-w asymptotic giant branch (AGB), is discussed.
2 Photometric Indices for Multiple Stellar Populations
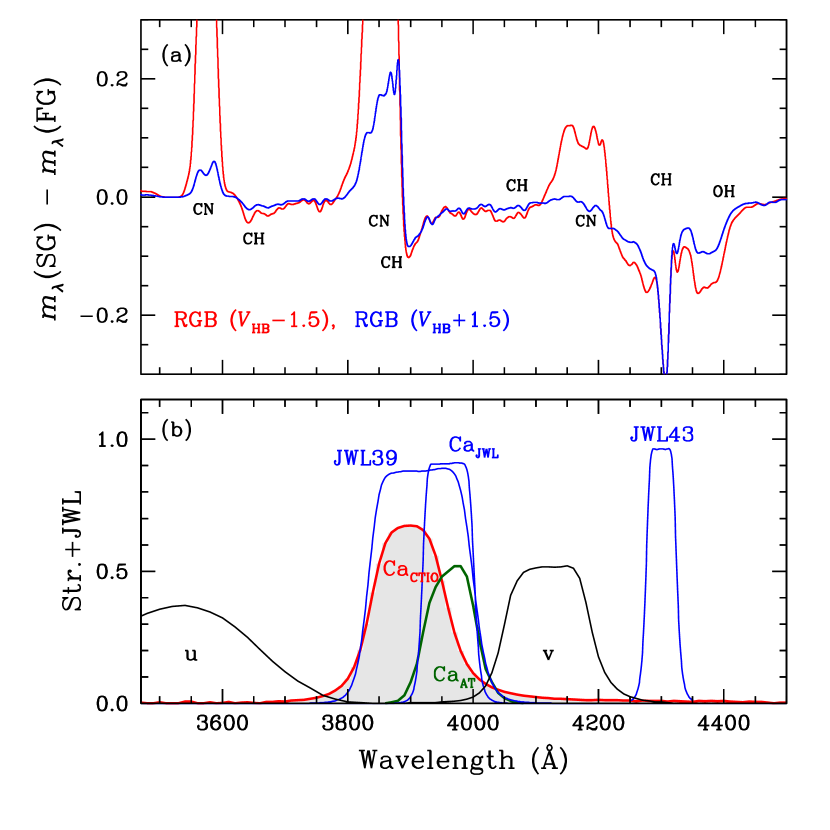
In Figure 1, we show the transmission curves of the Strömgren and the JWL systems along with the filter provided by the CTIO, , and the filter by Anthony-Twarog et al. (1991), . The , and filters were developed by the author of the paper in order to study the MPs in GCs (e.g., see Lee, 2015, 2017, 2018, 2019a). As we already noted in our previous work, the filter was designed to have a filter bandwidth and pivot wavelength very similar to that of the F395N filter in the Wide-Field Camera 3 (WFC3) on board the Hubble Space Telescope (HST) and it can measure the Ca II H and K absorption strengths. On the other hand, our filter was designed to measure the CN band at 3883 in combination with our . Finally, our filter was designed to measure the CH band at 4250 in combination with Strömgren and , as will be described below.
The original was designed to have a filter bandwidth and pivot wavelength very similar to that of the defined by Anthony-Twarog et al. (1991), but it had been degraded due to aging, and its original transmission curve had been significantly altered to the shorter wavelength, resulting in having the passband similar to our filter. But it should be pointed out that our filter has a more uniform and high transmission across the passband, dropping more rapidly at both edges. As a consequence, the measurements made through the and filters can be slightly different.
In our work here, we will use seemingly similar but different sets of photometric index, some of which are already defined elsewhere (e.g., see Anthony-Twarog et al., 1991; Lee, 2015, 2017),
| (1) | |||||
| (2) | |||||
| (3) | |||||
| (4) | |||||
| (5) | |||||
| (6) | |||||
| (7) |
The and the indices are known to be a good photometric measure of calcium abundances at a given luminosity or color (Anthony-Twarog et al., 1991; Lee et al., 2009a, b; Lee, 2015). Later, it will be shown that the filter bandwidths of the and the contain weak CH molecular absorption lines and, as a consequence, they are likely affected by weak CH band contamination.
Similar to our previous work (Lee, 2019a), the (double) RGB sequences in the individual color indices were parallelized using the following relation,
| (8) |
where, CI is the color index of the individual stars and CIred, CIblue are color indices for the fiducials of the red and the blue sequences. Note that the ‘’ operator is the same as the ‘’ operator that we already defined in our previous work (Lee, 2019a).
3 as a Photometric Measure of the CH G Band
As shown in Figure 1, our filter is carefully designed to measure the CH G band strength at 4250. In our previous works, we elaborately showed that our index is truly a measure of the CN band strengths at 3883 with great accuracy. Here, we assess the index [= ] as a photometric measure of the CH band strength at 4250.
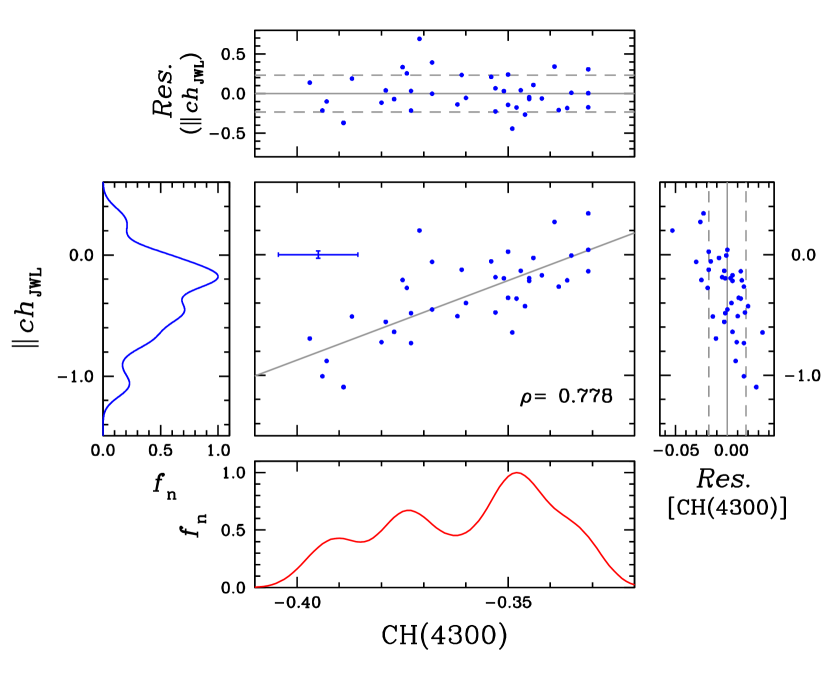
In Figure 2, we show a comparison of our photometric index against the spectroscopic CH(4300) index of M3 RGB stars measured by Smolinski et al. (2011). It can be said that our index is decently correlated with the CH(4300) index, with the correlation coefficient of = 0.773. The scatter around the fitted line is = 0.232 and it is at the level of 7.7(), where () is the photometric measurement uncertainty. In the right panel, we show the residuals in CH(4300) around the fitted line, finding = 0.018, and it is at the level 1.9[CH(4300)], where [CH(4300)] is the spectroscopic measurement uncertainty reported by Smolinski et al. (2011).
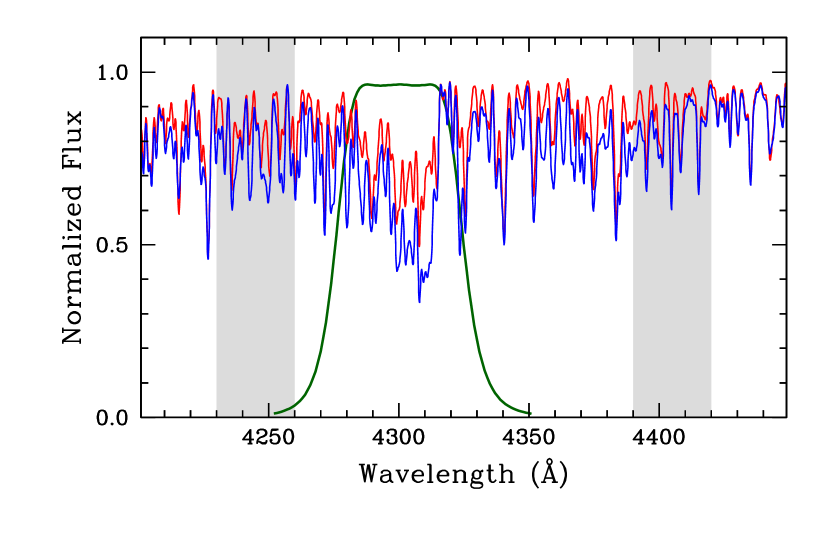
The correlation between the and the CH(4300) indices is not as good as that between the and the (3839) (see also Lee, 2019a). As Smolinski et al. (2011) noted, there are several continuum sidebands are currently being used, owing to the difficulties in the continuum assignment for the spectroscopic CH(4300) index: The region around the CH G band does not appear to have clean continuum sidebands and the difficulty in the continuum placement could be a problem with great importance in deriving spectroscopic CH(4300) index. For example, Smolinski et al. (2011) adopted the continua defined by S.-G. Lee (1999), whose continuum sidebands appear to suffer from CH contamination as shown in Figure 3. In sharp contrast, our photometric index is not affected by such a problem. As defined in Eq. (7), our index measures the CH G band strength and the slopes of the spectral energy distributions in rather clean regions, the Strömgren and passbands (see, e.g., Figure 1 of Lee, 2019a). Therefore, it is strongly believed that a rather poor correlation between our and the spectroscopic CH(4300) is mainly due to adoption of the contaminated continuum sidebands by Smolinski et al. (2011), which suffer CH contamination as mentioned above.
4 Color–Magnitude Diagrams for M5: Behavior of Individual Color Indices and a Photometric CN–CH Anticorrelation
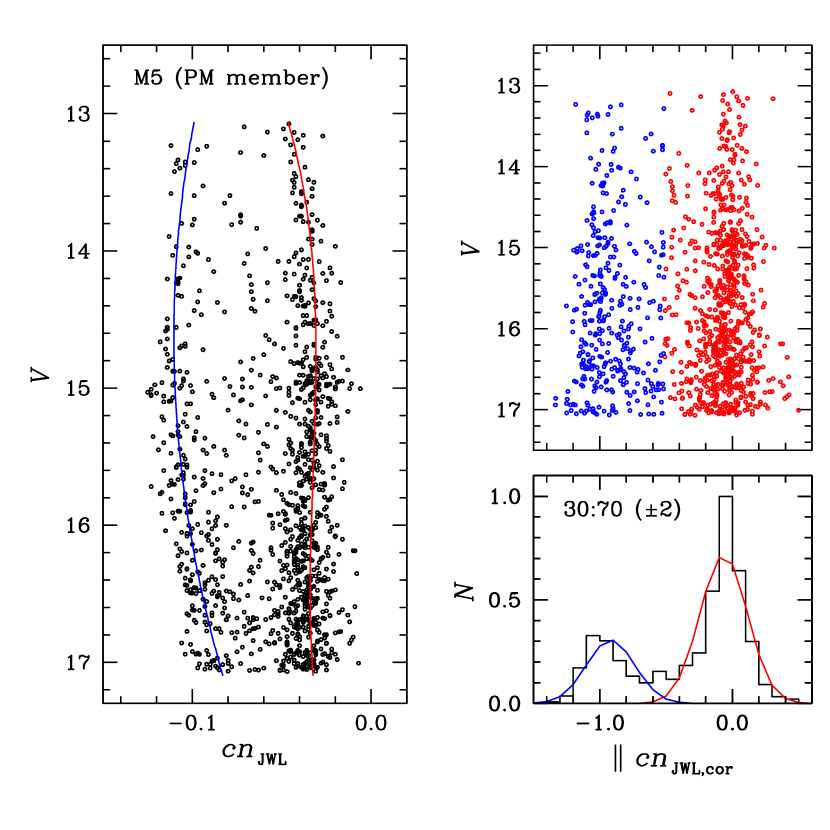
In Figure 4, we show the CMD of the M5 RGB stars with 2 mag 2 mag.333Note that we do not have photometry for M3, which is not accessible at CTIO. Unlike our previous studies of the cluster (Lee, 2017, 2019a), we made use of the proper motion study from the second Gaia date release to select the cluster’s membership stars (Brown et al., 2018), following the method similar to those used in previous works by others (see, e.g., Bastian et al., 2018; Marino et al., 2018; Milone et al., 2018).
Using the proper motion membership RGB stars, we derived the populational number ratio using the expectation maximization (EM) method with the two-component Gaussian mixture model. In an iterative manner, we calculated the probability of individual stars for being the CN-w and the CN-s populations, where the CN-w and the CN-s populations are defined to be stars with smaller and larger values at a given visual magnitude. Stars with (CN-w 0.5 from the EM estimator correspond to the CN-w population, where denotes the individual RGB stars, while those with (CN-s 0.5 correspond to the CN-s population. Despite the incompleteness of the second Gaia data release in the central part of the cluster, we obtained the populational number ratio of (CN-w):(CN-s) = 30:70 (2), which is consistent with our previous results (Lee, 2017, 2019a), which is natural to expect that M5 does not show any radial gradient in the populational number ratios.
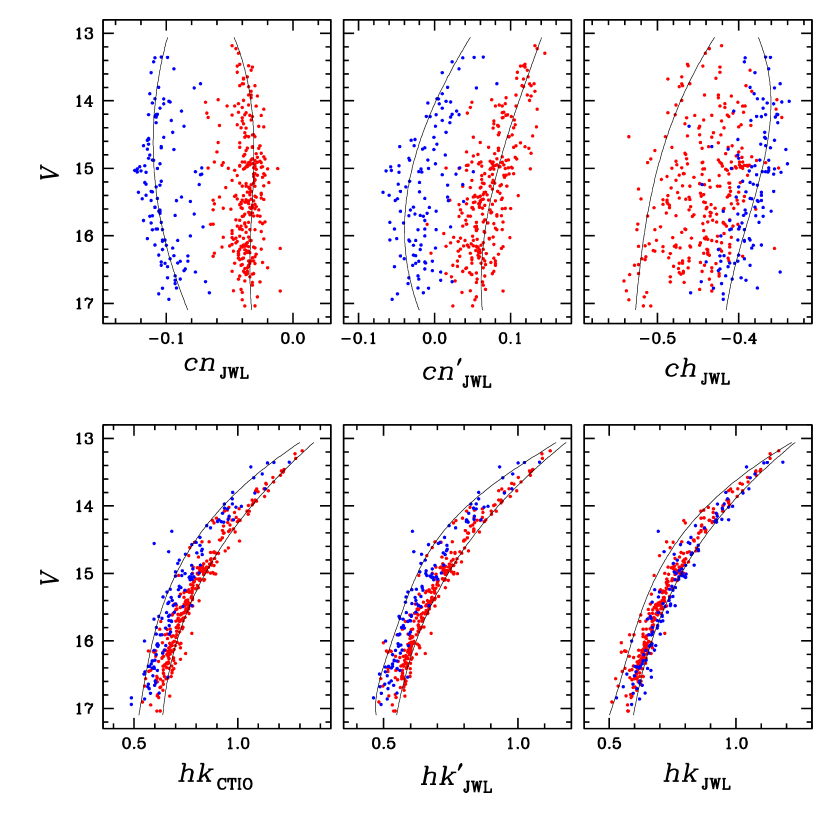
Based on our populational classification from the , we show various CMDs for the proper motion membership RGB stars in M5 with 2 mag 2 mag in Figure 5. In the figure, we used stars with () 0.005 mag, in order to avoid confusion raised from photometric measurement uncertainties. Note that our selection process for stars with accurate measurements does not affect the boundary between the two populations and the populational number ratio remains the same, (CN-w):(CN-s) = 30:70 (3). It can be clearly seen that both the and the show discrete double RGB sequences. In these two CMDs, by definition, the CN-w RGB population occupies the blue sequence and the CN-s population occupies the red sequence with well separated gaps between the two populations. On the other hand, in the CMD, the CN-w population occupies the red part of the sequence, meaning that the CN-w population has more enhanced CH abundance (i.e., carbon abundance) than the CN-s population does. Therefore, our results shown in Figure 5 is a photometric analogue of the CN–CH anticorrelation seen in M5 RGB stars (see also, Cohen et al., 2002).
The absence of the discreteness and the continuous transition between MPs in the and the indices deserve some attention. As already shown in Figure 1, the passbands of the and filters contain the CN band at 3883 and the Ca II H and K lines, which are known to be the most dominant spectral features that affect the passbands from 3800 Å to 4000 Å (also see Figure 1 of Lee, 2015). If there exists no variation in the calcium abundance between MPs, which appears to be true for M5, the discrete bimodal distributions should persist both in the and indices, similar to the discrete bimodal distributions seen in the or in the . For example, the calcium abundance of thirteen M5 RGB stars from high-resolution spectroscopy by Ivans et al. (2001) is [Ca/Fe] = 0.31 0.04 and their results do not show any sign of a significant variation in the calcium abundance between the CN-w and the CN-s RGB stars. Therefore, contributions from elements other than calcium within the passband of the filter must have erased the discreteness of the bimodal distributions in the and the CMDs.
In the CMD, it is evident that the distributions of MPs are skewed, in the sense that the CN-w RGB stars are preferentially located on the red part of the (i.e. larger values of the index at a given magnitude), and the general trend of the distribution is very similar to that of the distribution, which led us to suspect that the or the filters may be contaminated by the CH molecular band, making continuous populational transitions in the and in the CMDs.
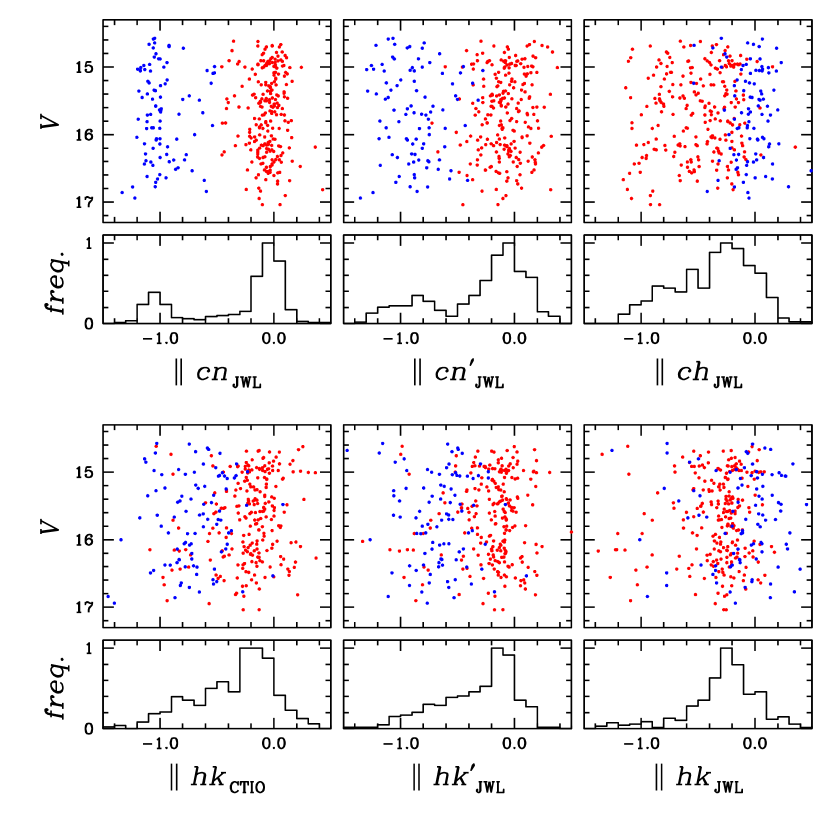
In Figure 6, we show parallelized CMDs and histograms of RGB stars for the individual color indices. Note that we restricted the visual magnitude range of 0.5 mag 2.0 mag, due to the lack of the bright CN-w proper motion membership RGB stars with 0.5 mag when we restricted sample RGB stars with () 0.005 mag, which hinders us to achieve accurate parallelization of the two populations. Similar to Figure 5, only the and the CMDs exhibit discrete bimodal distributions with clear populational separations, while other color indices show broad spread in their colors. In particular, the confusion in the populational tagging for individual stars is severe in the and the indices.
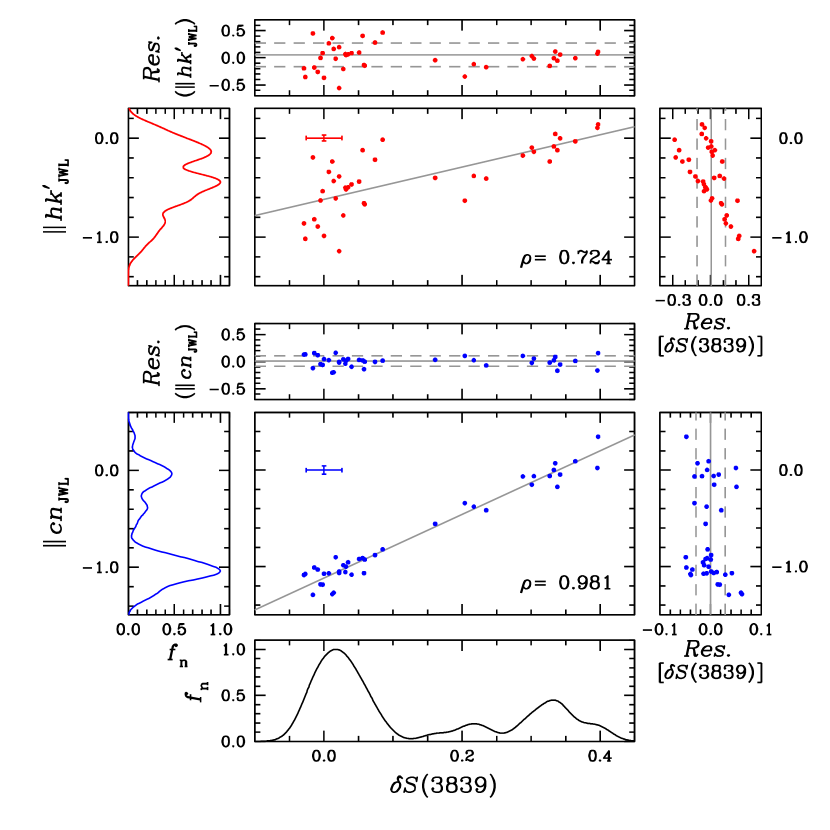
A more vivid example can be found in Figure 7, where we show plots of (3839) versus and for M3 RGB stars. Note that a plot of (3839) versus is already shown in our previous work (Lee, 2019a), and we show it again as a reference. The figure shows a weak correlation between the and (3839), with a correlation coefficient of = 0.724 and very large scatters around the fitted line. We obtained the residual in of = 0.217 and it is at the level of 7.2(), where () is the photometric measurement uncertainty. We also calculated the residual in (3839) around the fitted line, finding = 0.136 and it is at the levels of 4.3[(3839)], where [(3839)] is the spectroscopic measurement uncertainty by Smolinski et al. (2011). The scatters of in both axes are much larger than those of , 0.094 and 0.029 for residuals in and (3839), respectively. The large scatter in is not due to the photometric or the spectroscopic measurement errors but due to its intrinsic nature as a poor CN-tracer, and the same is true for the index. In particular, very large scatters around the fitted line for the versus (3839) can be seen in the CN-w populations, which is due to high carbon abundance in the CN-w population and, therefore, an increasing degree of the CH contamination in the index of the CN-w population, as we will show later.
Finally, it should be pointed out that Figures 5 and 6 strongly suggest that the skewed distributions in our and (i.e., our ) are not due to the CN contamination. If our filter is contaminated by the CN molecular band, then the CN-s population should occupy the red part of the or the , which is the opposite case to our results.
5 CH Contamination In The Ca II and Passband
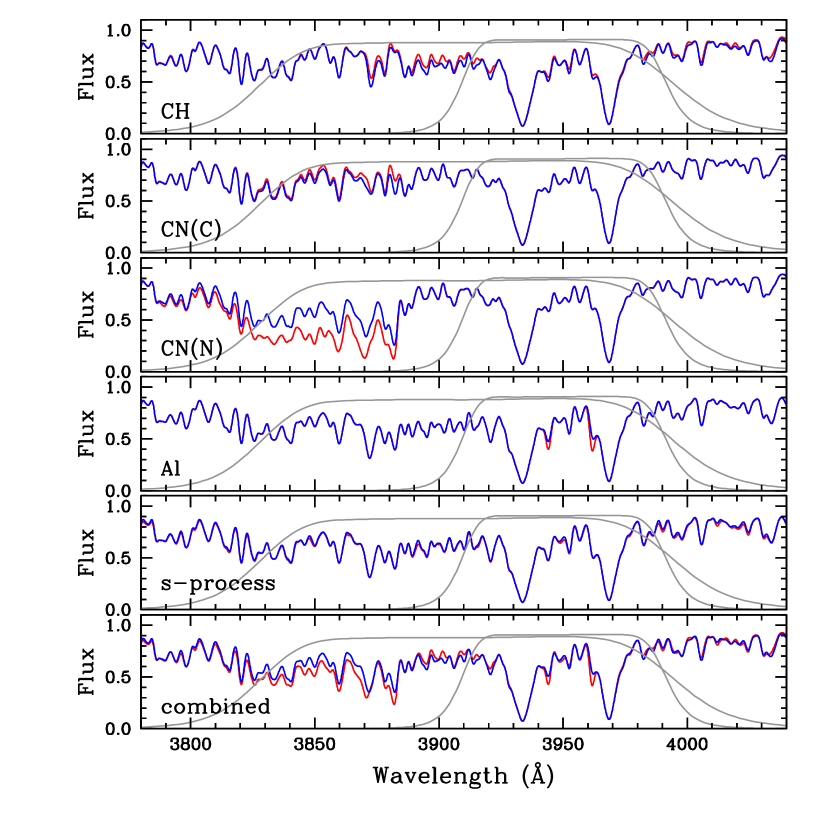
In order to understand what elements may affect the wavelength region from 3800 to 4000, we construct synthetic spectra of the CN-w and the CN-s with varying elemental abundances using MOOG (Sneden, 1973) and we show our results in Figure 8. During our calculations, we assumed that the CN-s population is depleted in the carbon and oxygen abundances by 0.5 and 0.4 dex and is enhanced in nitrogen, aluminum and -process elemental abundances by 0.8, 1.0 and 0.5 dex, respectively, with respect to the CN-w population. Although it does not seem to be realistic, we excluded the CN molecular lines when we construct synthetic spectra to examine the contribution from the CH molecular lines, and vice versa, for heuristic purpose. It is not a quantitatively correct approach because the CH formation rate is also affected by the CN formation and vice versa, but our approach can render some qualitative analysis.
The top panel of Figure 8 shows the contribution of the CH molecular lines, where the FG has stronger absorption features due to its enhanced carbon abundance and, as a result, the index value of the CN-w population can be slightly larger (i.e., redder) than that of the CN-s population. The next two panels show the contribution of the CN molecular lines, whose formation is regulated by both the carbon and the nitrogen abundances. The figure shows that the CN band does not contribute in the passband of the filter. As mentioned earlier, the location of the CN-w population occupies the red part of the index and, therefore, it could be an observational line of evidence that our filter is free from CN contamination. In other words, if our filter is contaminated by the CN band, then, the CN-s RGB stars would occupy the red part of the index. The different carbon isotope ratios can also affect the CN band strengths (e.g., see Briley et al., 1989), but they do not affect our passband.
It is a well-known fact that many GCs show large star-to-star aluminum abundance variations by more than [Al/Fe] 1.0 dex, presumably resulted from the proton-capture process at high temperature or the primordial pollution by intermediate-mass AGB stars to the later generation of the stars. The resonance lines of Al I at 3944.01 and 3961.52 are often very strong and they can affect the or the at the level of 0.01 mag (see also, Norris et al., 1981; Lee et al., 2009a). However, the influence of the aluminum lines works in opposite sense to our observations: the aluminum enhancement of the CN-s population makes the CN-s population redder than the CN-w population and, therefore, the aluminum enhancement cannot place the CN-w population the redder part of the sequence.
Finally, the CN-s population is expected to have enhanced -process elements, which lead the CN-s population redder than the CN-w population. Again, the variation of the -process elements cannot explain the skewed or distributions.
In the synthetic spectra including all contributions from individual elements, it is evident that the or the filters, and consequently the and indices, contain the CH molecule lines and, as a consequence, the , , , and suffer from weak CH contamination. However, it should be emphasized that this CH contamination is not as severe as to produce discrete bimodal RGB distributions in the and as can be seen in M22 (Lee, 2015). For M5, the CH contamination works in a continuous way and its influence on the index is not significant, () 0.04 mag. On the other hand, the split at the level of in M22 is about 0.1 mag, which is due to the difference in the calcium abundance between the two populations with heterogeneous metallicities and the level of the populational separation in M22 is much larger than that can be seen in M5.
| Name | |||||
|---|---|---|---|---|---|
| 0.918 | |||||
| 0.319 | 0.247 | ||||
| 0.676 | 0.741 | 0.384 | |||
| 0.651 | 0.633 | 0.507 | 0.917 | ||
| 0.586 | 0.502 | 0.575 | 0.135 | 0.072 |
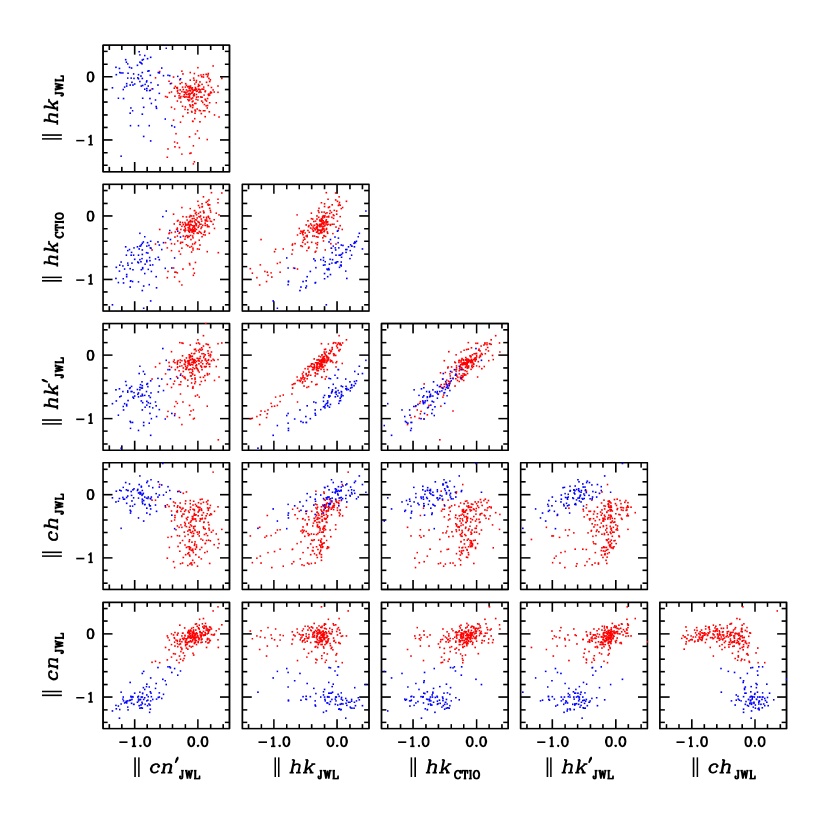
In Figure 9 and Table 1, we show comparisons of color indices and correlation coefficients between various color indices. Our is nicely correlated with the . Therefore, the index makes a good surrogate index. It is interesting to note that is inversely correlated with our , but with a step-function wise, a photometric analogue of the CN–CH anticorrelation of M5 RGB stars, as we already mentioned. Our plot of the versus shows that the evolutions of the CN and CH between the CN-w and CN-s populations are not continuous. Apparently, our photometric CH abundance of the CN-w population does not vary, while that of the CN-s population shows a significant variation.
The lesson learned from our exercise is that neither the nor the , subsequently neither the nor the , can serve as an accurate population tracers in normal GCs without any metallicity spread. Only our and, perhaps, the , subsequently the and the , are the most reliable population tracers.
| CTIO Filters | New Filters | |||||||||
|---|---|---|---|---|---|---|---|---|---|---|
| NGC 6723 | 1910 | 3340 | 2700 | 1800 | 11500 | 4450 | 10680 | 44420 | 10200 | |
6 Multiple Stellar Populations in NGC 6723
Here, we present the multiple stellar population study of NGC 6723 based on our and indices.
6.1 Observations
The observations for NGC 6723 were performed over 15 nights in seven runs from 2007 September to 2014 May using the CTIO 1.0 m telescope, which was equipped with a STA 4k 4k CCD camera, providing a plate scale of 0289 pixel-1 and a field of view (FOV) of about 20′ 20′. The effective FOV of the final combined image of NGC 6723 is about 35′ 27′, which is at least 8 times larger than that of the half-light radius of the cluster, 153 (Harris, 1996, updated as in 2010). We show the total integration times for the cluster in Table 2.
The raw data handling were described in detail in our previous works (Lee et al., 2014; Lee, 2015; Lee & Pogge, 2016). The photometry of NGC 6723 and standard stars were analyzed using DAOPHOTII, DAOGROW, ALLSTAR and ALLFRAME, and COLLECT-CCDAVE-NEWTRIAL packages (Stetson, 1987, 1994; Lee & Carney, 1999). We performed artificial star experiments (e.g., see Stetson & Harris, 1988; Lee, 2015) and obtained the completeness fractions, , as a function of magnitude, whose utility will be discussed more fully later.
We calculated the astrometric solutions for individual stars using the data extracted from the Naval Observatory Merged Astrometric Dataset (NOMAD, Zachairias et al., 2004) and the IRAF IMCOORS package.

6.2 Color–Magnitude Diagrams
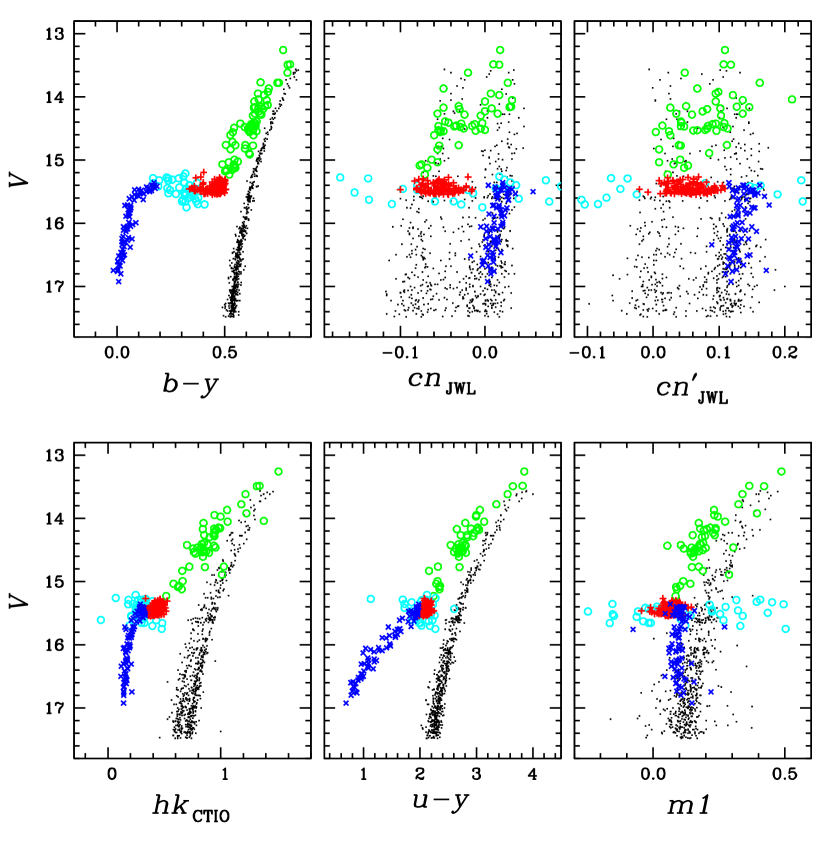
As we showed in our previous work (Lee et al., 2014), NGC 6723 is an intermediate metallicity GC located toward the Galactic bulge ( = 007, = 1730) and is heavily contaminated by off-cluster field stars. The recent study of the space orbit of NGC 6723 revealed that its apogalactic distance is less than 3 kpc (Baumgardt et al., 2019), making it a true inner Galactic GC. Using the second Gaia date release (Brown et al., 2018) and our multi-color photometry (see, e.g., Lee, 2015, for the versatility of multi-color photometry), we removed the off-cluster field stars (e.g., see also Bastian et al., 2018; Marino et al., 2018; Milone et al., 2018). We show selected CMDs for NGC 6723 in Figure 10, where discrete double RGB sequences can clearly be seen in the and CMDs, while a hint for the double RGB populations can be noticed in the CMD.
| Color Index | (CN-w):(CN-s) | |
|---|---|---|
| 35.5:64.5 | 2.8 | |
| 35.5:64.5 | 2.8 | |
| 37.4:62.6 | 2.9 | |
| 37.5:62.5 | 2.9 |
6.3 Populational Ratios of Red-Giant Branch Stars
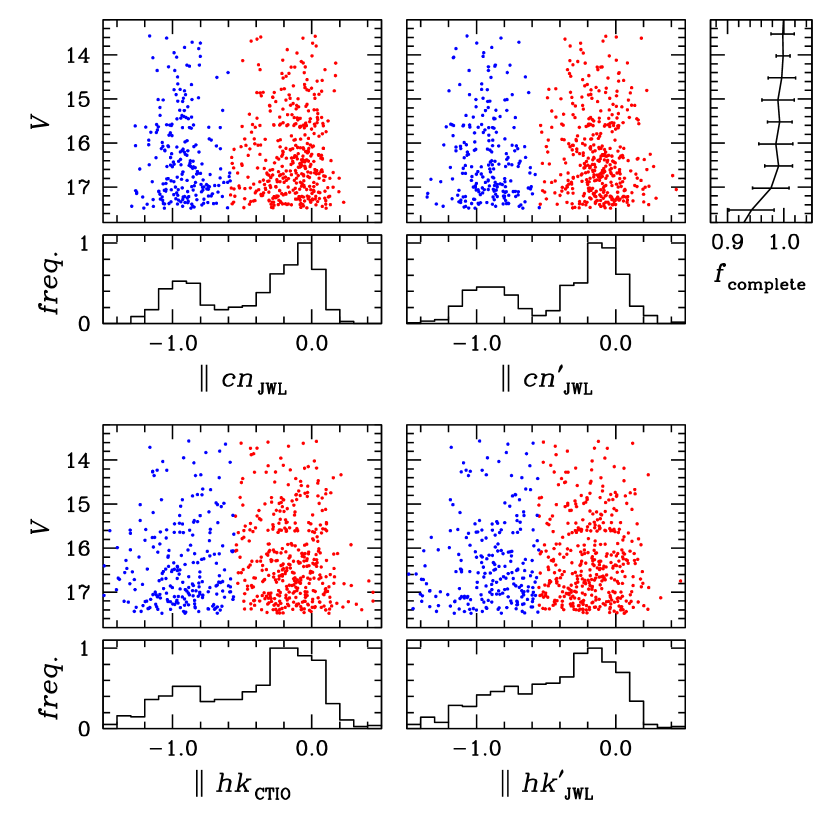
We parallelized the selected color indices using Eq. (8) and we show the parallelized CMDs and histograms in Figure 11, where we show the CN-w and CN-s RGB stars with 2 mag 2 mag classified from individual indices. Same as Figure 6, the and CMDs show discrete RGB populations, while the and CMDs show rather continuous transitions from one population to the other and severe confusion in the populational tagging for individual stars.
In Table 3, we show the RGB populational ratios from four color indices using the EM estimator that we already explained in §4. Our results show that the overall populational number ratios from individual color indices are in good agreement with each other, 36:64 (3). At the same time, our RGB populational number ratios are in excellent agreement with that of Milone et al. (2017), who obtained the FG fraction of 0.363 0.017 in the central part of the cluster, which is not a surprise because the RGB populational number ratios do not show any radial gradient in NGC 6723 as we will show later. On the other hand, our RGB number ratios from the or indices are slightly different from that by Lim et al. (2016), who obtained (CN-w):(CN-s) = 38:62, but both results are in agreement within statistical errors. In fact, the result by Lim et al. (2016) is more close to those of our results from the or .
The populational tagging for individual stars, however, can be somewhat different. In the CMD, a weak confusion in the lower RGB stars can be seen, in particular a few number of the CN-w stars identified from the index occupy the CN-s regime in the . The situations are even worse in the and CMDs, where considerable numbers of stars occupy the counterpart regime, making the populational tagging for the individual stars can be unreliable for these two color indices.
6.3.1 Red-Giant Branch Bumps
In GC RGB stars, the helium abundance is very difficult to measure due to the lack of the absorption lines in the visual passband. Direct spectroscopic measurements can be possible using the chromospheric He I absorption line at 10830Å, but the result from this line is sensitively dependent on the structure and dynamics of the stellar atmosphere (e.g., see Dupree & Avertt, 2013). For blue HB (BHB) stars cooler than the Grundahl jump (Grundahl et al., 1999), the helium abundance can be measured from the photospheric He I lines at 5876Å. However, due to difficulties involved in the absorption strength measurements in fainter GC BHB stars and in the model atmosphere constructions, the inferred helium abundance from this absorption line can be incorrect. For example, Gratton et al. (2015) obtained very high mean helium abundance ( 0.37) from the two BHB stars in NGC 6723, and they cautioned about using their helium measurement.
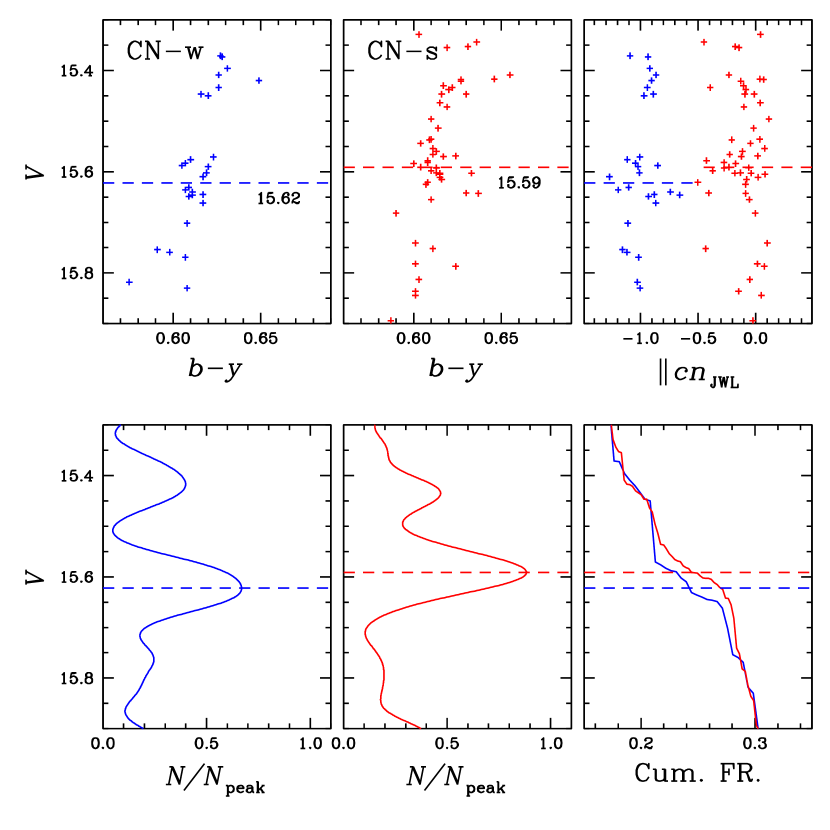
Alternatively, one can rely on the indirect photometric methods using the helium sensitive characteristics during the low-mass stellar evolutions, such as the RGB bump (RGBB) luminosity (e.g., see Cassisi & Salaris, 2013; Lee, 2015, 2017, 2018; Milone et al., 2015; Lagioia et al., 2018, and references therein). When the very thin H-burning shell crosses the discontinuity in the chemical composition and lowered mean molecular weight left by the deepest penetration of the convective envelope during the ascent of the RGB, the RGB stars experience slower evolution and temporary drop in luminosity, the so-called RGBB. The luminosity of the RGBB depends on metallicity, stellar mass (hence age), and helium abundance. At a given age and metallicity, the RGBB luminosity increases with helium abundance.
We compared the magnitude difference of the RGBB between the two populations and we show our results in Figure 12. We found that the mean RGBB magnitude of the CN-s population is 0.031 0.030 mag brighter than that of the CN-w population. If there exist no differences in metallicity and age between the two RGB populations, the difference in the RGBB magnitude can translate into the difference in the mean helium abundance of = 0.012 0.012, in the sense that the CN-s population is slightly more helium enhanced than the CN-w population is. Our result is in good agreement with that of Milone et al. (2018), who obtained the average helium difference between two generations of the stars in NGC 6723 of 0.005 0.006 from their HST photometry. Our finding is also consistent with the widely accepted idea that the CN-s population in GCs are helium enhanced population (e.g., see Lee, 2017, 2018; Lagioia et al., 2018; Milone et al., 2018).
| Sampling domains | (-value 0.002) |
|---|---|
| Empirical | 4.46% |
| Empirical11Sampling from the whole RGB stars. | 0.18 % |
| Gaussian | 0.20 % |
6.3.2 Radial Distributions
As we mentioned earlier, Lim et al. (2016) reported that the radial distribution of the CN-w RGB stars is more centrally concentrated than that of the CN-s with a -value of 0.002 for being drawn from same parent distributions. Then, they claimed that the mass segregation is responsible for the difference in the radial distributions.
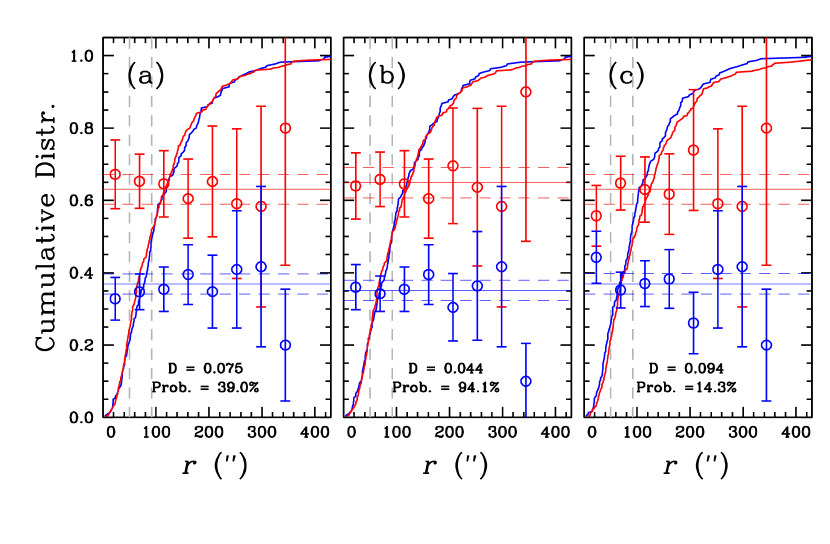
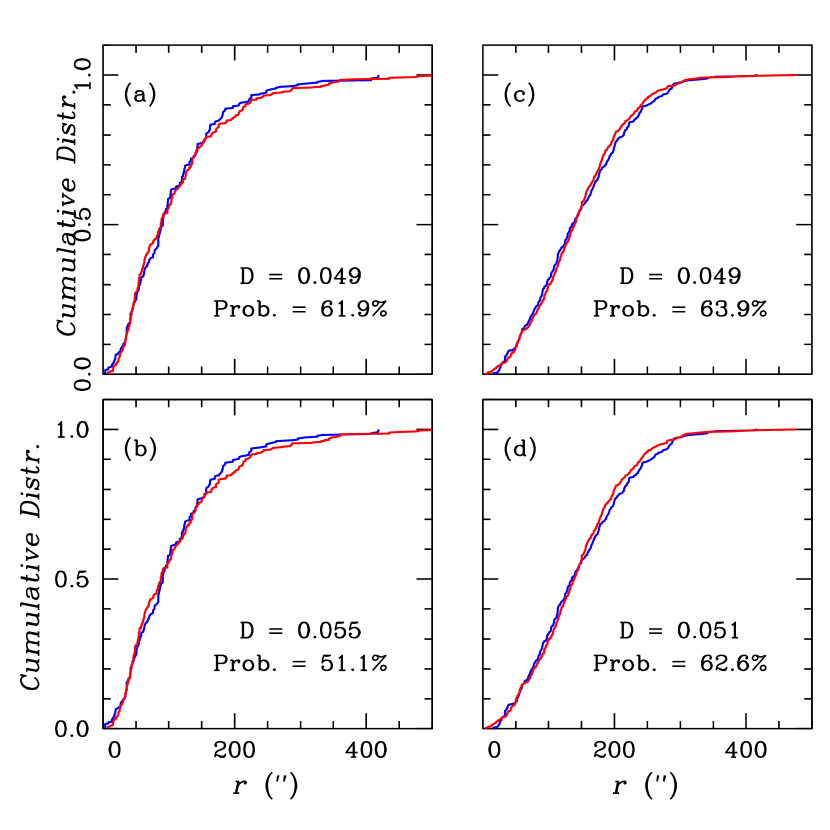
In Figure 13, we show cumulative radial distributions from the , , and . Note that our is a exactly same index as by Lim et al. (2016). As shown in the figure, the radial distributions for the CN-w and CN-s populations from all three color indices are almost identical. Our Kolmogorov–Smirnov (K–S) tests show that the CN-w and CN-s populations are most likely drawn from the same parent distributions regardless of the color indices. At the same time, the populational ratios from the and indices remain flat against the radial distance from the center.
It should be emphasized that, despite the severe confusion in populational tagging in the index as shown in Figures 6 and 9, the apparently almost identical radial distributions between the two populations in the index does not imply that the index performs populational tagging in a correct way, but it is due to the natural consequence of the absence of the radial sensitivity in the distribution of the two populations. We constructed both the fully empirical and the analytical models to perform Monte Carlo simulations to test this idea (see Lee, 2015, 2019b). Note that our empirical models use our observed CN-w and CN-s distributions, the populational number ratio and luminosity functions. In Table 4, we show the results from our randomization tests for probability of having the -value returned from our K–S tests less than 0.002, which is the one that Lim et al. (2016) claimed. Our tests strongly suggest that there exists no difference in radial distributions between the two RGB populations, which is consistent with that of Gratton et al. (2015), who compared the cumulative radial distribution of extreme-BHB stars (i.e., the CN-s population) and other stars on the HB (i.e., the CN-w population) in NGC 6723 using our previous photometry (Lee et al., 2014), finding no evidence of different radial distributions between the two HB populations.
An incomplete detection of GC RGB stars does not affect our results for the radial distributions and populational number ratios. Using models constructed above, we performed Monte Carlo simulations and we show our results in Figure 14. The results from our fully empirical Monte Carlo simulations presented in Figure 14(a) show almost identical radial distributions for both populations similar to that already presented in Figure 13(a). In order to simulate our potential incomplete detection of NGC 6723 RGB stars, by applying the completeness fractions, , we calculated probability of being detected in our Monte Carlo simulations. We show our results in Figure 14(b), where the similar radial distributions for both populations persist. Note that our approach applying the completeness fractions to the observed radial distributions is not an exactly correct way to realize the effect of incomplete detection on the radial distributions. In fact, the inverse process of our approach should be sought, but it turned out to be very delicate to construct such models. Although it is not exactly correct, very similar results returned from our simulations strongly suggest that any effect arisen from the incomplete detection of stars on the radial distribution, and furthermore on the populational number ratios, can be negligible.
It is very clear that our results are significantly different from those of Lim et al. (2016) and we strongly believe that the results presented by Lim et al. (2016) are in error, due to either their incorrect populational assignment of the individual stars based on the index, a rather poor CN tracer or their incorrect photometric measurements.
| (CN-w):(CN-s) | ||
|---|---|---|
| RGB | 35.5:64.5 | 2.8 |
| Case 1 | 59.2:40.8 | 13.9 |
| Case 2 | 53.7:46.3 | 13.0 |
| Case 3 | 45.9:54.1 | 13.5 |
| Case 4 | 42.1:57.9 | 12.7 |
Case 1: Using the RGB fiducials for the populational separation.
Case 2: Using the AGB fiducials for the populational separation.
Case 3: From bright AGBs with 14.54 mag for Case 1.
Case 4: From bright AGBs with 14.54 mag for Case 2.
6.4 Asymptotic Giant Branch Stars
We also explore the AGB population in NGC 6723. As we already demonstrated for M5 and NGC 6752 (Lee, 2017, 2018), the effective temperature of the AGB stars are not hot enough to suppress the CN formation and, therefore, our index can be a very powerful tool to study the AGB populations in GCs (see also the work by Marino et al., 2017).
In Figure 15, we show the CMDs for AGB stars in NGC 6723, along with the RGB and HB stars, where one can clearly see that our and, perhaps, indices are well-suited for studying AGB stars, while other indices including , and suffer from confusion in the AGB populational tagging and they may not be useful. In our and CMDs, the positions of the BHB stars happened to be overlapped with those of the CN-s RGB stars, although the BHB stars in NGC 6723 are most likely belonging to the helium enhanced population of the cluster (Gratton et al., 2015) and, therefore, the progeny of the CN-s RGB. The fact is that, the effective temperature of the BHB stars are too high and, therefore, the CN molecule formation is suppressed in their atmospheres and the influence of the hydrogen lines are more important in some of the color indices of the BHB stars.
6.4.1 Synthetic population models and the need for extra abundance variation in the CN-w AGB stars
In order to understand the behavior of the individual populations on the CMD, we constructed synthetic population models. Assuming [Fe/H] 1.0 dex for NGC 6723444Recently, Crestani et al. (2019) obtained [Fe/H] = 0.93 0.05 from 11 RGB stars., we adopted the stellar evolution isochrones and the HB/AGB evolution tracks from the Dartmouth Stellar Evolution Database (Dotter et al., 2008). Then, we used ATLAS12 and SYNTHE to calculate high resolution spectra with varying elemental abundances for both populations (Kurucz, 1970, 2005; Sbordone et al., 2004; Castelli, 2005). The carbon and nitrogen abundances for individual populations in NGC 6723 are not known and we simply adopted those values for M5 (Cohen et al., 2002): we assumed [C/Fe] = 0.2, [N/Fe] = 0.1 and [O/Fe] = +0.3 dex for the CN-w population, while [C/Fe] = 0.8, [N/Fe] = +1.3 and [O/Fe] = 0.2 dex for the CN-s populations.
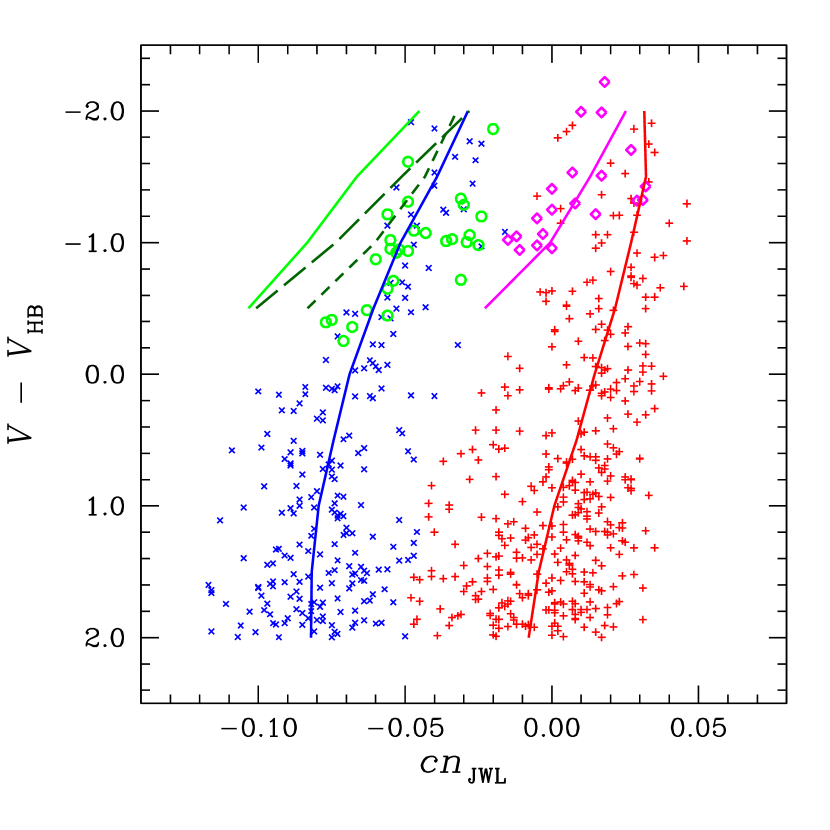
In Figure 16, we show our results. Our synthetic RGB fiducial sequences trace the observed data with great satisfaction, and so does the CN-s synthetic AGB fiducial sequence. However, the synthetic fiducial sequence for the CN-w AGB population appears to be problematic. Our synthetic index is about 0.035 mag smaller than our photometry. We calculated the synthetic CN-w RGB and AGB fiducial sequences with various combinations of elemental abundances, but our calculations always failed to trace both the RGB and the AGB stars simultaneously. Assuming our adopted CNO abundance for the CN-w population is not in great error, there are at least two possibilities that make the synthetic CN-w AGB fiducial sequence redder in the index: (1) The nitrogen enhancement and (2) the decrements in the 12C/13C ratio (e.g., see Briley et al., 1989).
Our index is an accurate measure of the CN band strengths at 3883, which is mostly governed by the nitrogen abundance, because nitrogen is less abundant than carbon. Using ATLAS12 and SYNTHE, we calculate the model atmospheres and the synthetic spectra for the enhanced nitrogen abundance by [N/Fe] = 0.1 dex. As shown in the figure, the nitrogen enhancement can contribute to our index by 0.02 mag.
To investigate the effect of the variations in the 12C/13C ratios onto our index, we used MOOG to generate the synthetic spectra. The decrement of the 12C/13C ratio from 20 to 2.5 can result in +0.003 mag for the CN-w AGB stars at = 0.5 mag and +0.016 mag at = 2.0 mag.
It should be emphasized that both the nitrogen enhancement and the decrement in the 12C/13C ratio will have the effect of a similar degree on the RGB sequences in both populations. Therefore, an extra variation in elemental abundances is required only for the CN-w AGB population to match the synthetic fiducial sequences with observations.
Finally, we also considered the effect of the variation of the helium abundance, finding that the enhanced helium abundance does not affect our index. We calculated the synthetic spectra with enhanced helium abundance by 0.1 and found that the difference in the index between the normal and the enhanced helium spectra is no larger than = 0.001 mag, i.e., a null effect.
Recently, Maas et al. (2019) reported carbon isotope ratios in giants stars in the globular cluster M10, finding that the decrement in the 12C/13C ratios both in the CN-w and the CN-s populations555Note that the CN-w and the CN-s populations in our study correspond to the CN-Normal and the CN-Enhanced population by Maas et al. (2019). in M10. They discuss further that to match their measurements of the surface carbon and carbon isotope ratios requires two different thermohaline mixing efficiencies. If our results presented in this study are correct, a more complicated mixing scenario would be required to explain our results.
6.4.2 AGB populational number ratio
It has long been noticed that the lighter elemental abundances in AGB stars are different from those of the RGB stars in some GCs (e.g., see Sneden, Ivans, & Kraft, 2000; Campbell et al., 2013). At the same time, the AGB populational number ratio can be significantly different from that of the RGB in GCs, due to the different evolutionary paths of the AGB stars with different elemental abundances, especially helium, and masses (e.g., see Figure 20 of Lee, 2017).
In Figure 16, the lack of faint CN-s AGB stars is evident in NGC 6723, reminiscent of the NGC 6752 AGB populations (Campbell et al., 2013; Lee, 2018), which is consistent with the idea that stellar evolutionary paths of the BHB stars, presumably the helium enhanced SG population, do not pass through the lower part of the AGB sequence. To test this idea, we derived the AGB populational number ratios and we show our results in Table 5.
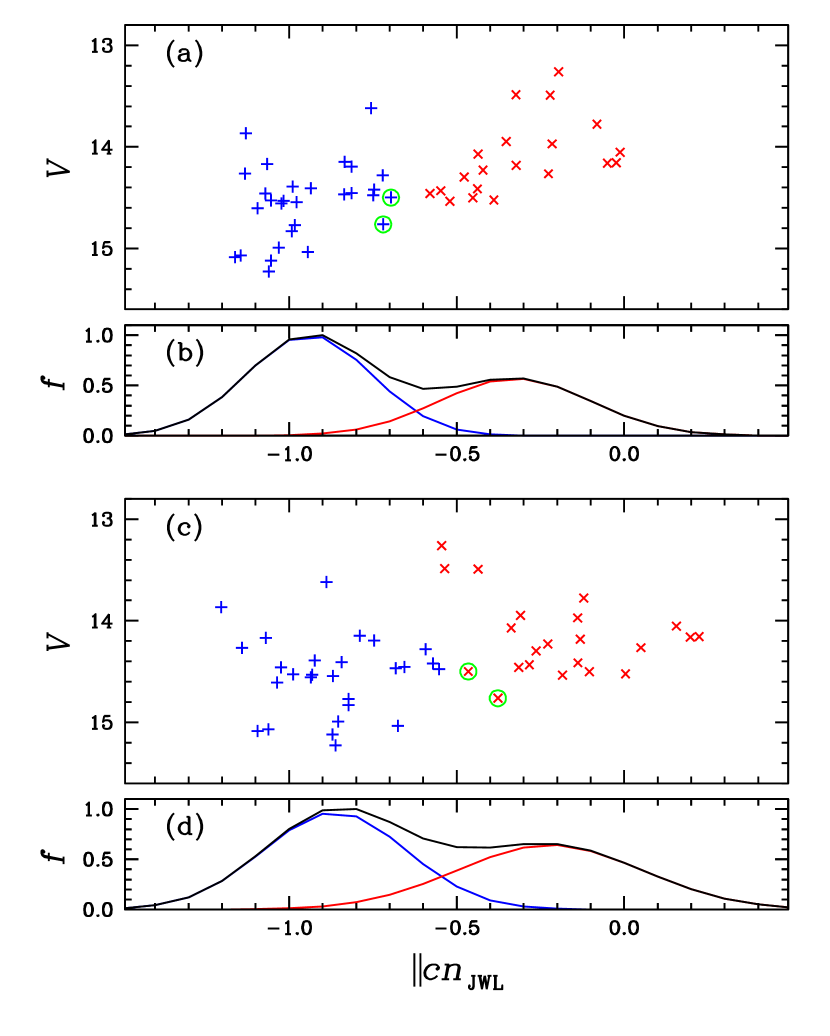
First, we derived the using the RGB fiducials and applied the EM estimator to calculate the AGB populational number ratio, obtaining (CN-w):(CN-s) = 59:41 (14), significantly different from that of the RGB, 35.5:64.5 (2.8). Next, we also calculated the AGB number ratio using the AGB fiducials. As we already showed in Figure 16, the slopes of the AGB populations appear to be slightly different from those of the RGB populations in our CMD, which will require slightly different fiducials in the parallelization processes between the RGB and the AGB stars. Hence, we derived the AGB fiducial sequences and calculated the AGB populational number ratio, finding (CN-w):(CN-s) = 54:46 (13), which is still significantly different from that of the RGB. As shown in Figure 17, only two AGB stars suffer from confusion in their populational tagging from different parallelizations. Our results strongly suggest that the adopted AGB fiducial may not be the source of the discrepancy in the populational number ratios between the RGB and the AGB in NGC 6723.
If we consider the bright AGB stars with 14.54 mag only, where both the CN-w and CN-s AGB stars exist, the AGB number ratio becomes (CN-w):(CN-s) = 46:54 (14) from the RGB fiducials and 42:57 (13) from the AGB fiducials. Both results are in agreement with that of the RGB within the statistical errors. It is believed that a significant fraction of the BHB stars (i.e., presumably the CN-s HB populations with enhanced helium contents) may have evolved into the AGB-manqué stars, which may be responsible for the rather larger fraction of the CN-w AGB population in NGC 6723.
7 Summary
In this work, we showed that (= ) can be an excellent surrogate index and an excellent populational tagger in the study of the MPs in GCs.
We also showed the CH contamination in the passband of Ca II H & K region and the sidebands of the CH G band, which can add a small, but non-negligible amount of uncertainties to the measurements.
We introduced a new color index, [=], which can measure accurate CH G band strengths, hence the carbon abundance. Our photometric CN–CH relation of the large sample of the M5 RGB stars showed that the evolutions of the CN and CH between the CN-w and CN-s populations are not continuous. The CH abundance of the CN-w population does not appear to vary, while a significant variation can be seen in that of the CN-s population.
Armed with our new color indices, we investigated the MPs of NGC 6723. Using our and indices, we obtained the RGB populational number ratio of (CN-w):(CN-s) = 35.5:64.5 (2.8), in excellent agreement with that of Milone et al. (2017), who obtained the fraction of the first generation of stars of 0.363 0.017. In sharp contrast to the result by Lim et al. (2016), who argued a reversed cumulative radial distribution in NGC 6723 (i.e., the more centrally concentrated CN-w RGB population), all of our cumulative radial distributions from various color indices showed the similar cumulative radial distributions between the two RGB populations in NGC 6723. Our statistical tests showed that possibilities for having the results claimed by Lim et al. (2016) is less than 5%, i.e. highly improbable. It is strongly believed that the results by Lim et al. (2016) were in error due to their inaccurate populational assignment from their index, a poor populational tagger.
Similar to normal GCs with distinctive MPs, the helium abundance of the CN-s population inferred from the RGBB magnitude appears to be slightly enhanced by about = 0.012 0.012.
We constructed synthetic population models to quantitatively investigate the individual populations, finding that no models with bimodal elemental abundances can trace the whole RGB and AGB populations simultaneously. In particular, the CN-w AGB population turned out to be problematic. To match the CN-w AGB stars within the current framework may require a mild nitrogen enhancement and/or a large decrement in the 12C/13C ratio in the CN-w AGB stars. On the other hand, the effect of the helium enhancement is nil in our index.
Finally, our and CMDs clearly showed the discrete double AGB populations in NGC 6723, whose bright AGB populational number ratio is in marginally agreement with that of the RGB stars within the statistical errors. The lack of the faint CN-s AGB stars may indicate that a significant fraction of the CN-s HB stars (presumably BHB stars with enhanced helium contents) must have evolved into the AGB-manqué phase and failed to reach the AGB phase.
References
- Anthony-Twarog et al. (1991) Anthony-Twarog, B. J., Laird, J. N., Payne, D., & Twarog, B. A. 1991, AJ, 101, 1902
- Bastian et al. (2018) Bastian, N., Kamann, S., Cabrera-Ziri, I., et al. 2019, MNRAS, 480, 3739
- Baumgardt et al. (2019) Baumgardt, H., Hilker, M., Sollima, A., & Bellini, A. 2019, MNRAS, 482, 5138
- Bekki (2010) Bekki, K. 2010, ApJ, 723, L99
- Briley et al. (1989) Briley, M. M., Smith, G. H., Bell, R. A., Oke, J. B., & Hesser, J. E. 1992, ApJ, 387, 612
- Brown et al. (2018) Brown, A.G.A., Vallenari, A., Prusti, T. et al. 2018, A&A, 616, A1
- Campbell et al. (2013) Campbell, S. W., D’Orazi, V., Yong, D. et al. 2013, Nature, 498, 198
- Carretta (2014) Carretta, E. 2014, ApJ, 795, L28
- Carretta et al. (2009) Carretta E., Bragaglia, A., Gratton, R.G., Lucatello S., Cantanzaro G. et al. 2009, A&A, 505, 117
- Cassisi & Salaris (2013) Cassisi, S., & Salaris, M. 2013, Old Stellar Populations: how to study the fossil record of galaxy formation (Berlin:Wiley-VCH)
- Castelli (2005) Castelli, F. 2005, Mem. S.A.It. Suppl. 8, 25
- Cohen et al. (2002) Cohen, J. G., Briley, M. M., Stetson, P. B. 2002, AJ, 123, 2525
- Crestani et al. (2019) Crestani, J., Alves-Brito, A., Bono, G. et al. 2019, MNRAS, 487, 5463
- Dotter et al. (2008) Dotter, A., Chaboyer, B., Jevremović, D. et al. 2008, ApJS, 178, 89
- Dupree & Avertt (2013) Dupree, A. K., & Avrett, E. H. 2013, ApJ, 773, L28
- Gratton et al. (2015) Gratton, G. R., Lucatello, S., Sollima A. et al. 2015, A&A, 573, A92
- Grundahl et al. (1999) Grundahl, F., Catelan, M., Landsman, W. B., Stetson, P. B., & Andersen, M. I. 1999, ApJ, 524, 242
- Harris (1996) Harris, W. E. 1996, AJ, 112, 1487
- Ivans et al. (2001) Ivans, I. I., Kraft, R. P., Sneden, C. et al. 2001, AJ, 122, 1438
- Kurucz (1970) Kurucz, R., L. 1970, SAOSR, 309, 291
- Kurucz (2005) Kurucz, R., L. 2005, Mem. S.A.It. Suppl. 8, 14
- Lagioia et al. (2018) Lagioia, E. P., Milone, A. P., Marino, A. F., et al. 2018, MNRAS, 475, 4088
- Lee (2010) Lee, J.-W. 2010, MNRAS, 405, L36
- Lee (2015) Lee, J.-W. 2015, ApJS, 219, 7
- Lee (2016) Lee, J.-W. 2016, ApJS, 226, 16
- Lee (2017) Lee, J.-W. 2017, ApJ, 844, 77
- Lee (2018) Lee, J.-W. 2018, ApJS, 238, 24
- Lee (2019a) Lee, J.-W. 2019a, ApJ, 872, 41
- Lee (2019b) Lee, J.-W. 2019b, ApJ, 875, 27
- Lee & Carney (1999) Lee, J.-W., & Carney, B. W. 1999, AJ, 117, 2868
- Lee et al. (2009a) Lee, J.-W., Kang, Y.-W., Lee, J., & Lee, Y.-W. 2009a, Nature, 462, 480
- Lee et al. (2009b) Lee, J.-W., Lee, J., Kang, Y.-W., et al. 2009b, ApJ, 695, L78
- Lee et al. (2014) Lee, J.-W., López-Morales, M., Hong, K. et al. 2014, ApJS, 210, 6
- Lee & Pogge (2016) Lee, J.-W., & Pogge, R. 2016, JKAS, 49, 289
- S.-G. Lee (1999) Lee, S.-G. 1999, AJ, 118, 920
- Lim et al. (2016) Lim, D., Lee, Y.-W., Pasquato, M. et al. 2016, ApJ, 832, 99
- Maas et al. (2019) Maas, Z. G., Gerber, J. M., Deibel, A. & Pilachowski, C. A. 2019, ApJ, 878, 43
- Marino et al. (2018) Marino, A. F., Milone, A. P., Casagrande, L., et al. 2018, ApJ, 863, L33
- Marino et al. (2017) Marino, A. F., Milone, A. P., Yong, D., et al. 2017, ApJ, 843, 66
- Marino et al. (2008) Marino, A. F., Villanova, S., Piotto, G. et al. 2008, \aas, 490, 625
- Milone et al. (2018) Milone, A. P., Marino., A. F., Mastrobuono-Battisti, A., & Lagioia, E. P. 2018, MNRAS, 479, 5005
- Milone et al. (2015) Milone, A. P., Marino, A. F., Piotto, G. et al. 2015, ApJ, 808, 51
- Milone et al. (2017) Milone, A. P., Piotto, G., Renzini, A. et al. 2017, MNRAS, 464, 3636
- Norris et al. (1981) Norris, J., Cottrell, P. L., Freeman, K. C., & Da Costa, G. S. 1981, ApJ, 244, 205
- Piotto et al. (2015) Piotto. G., Milone, A. P., Bedin, L. R. et al. 2015, AJ, 149, 91
- Sbordone et al. (2004) Sbordone, L., Bonifacio, P., Castelli, F., & Kurucz, R. L. 2004, Mem. S.A.It. Suppl. 5, 93
- Smith (1987) Smith, G. H. 1987, PASP, 99, 67
- Smolinski et al. (2011) Smolinski, J. P., Martell, S., Beers, T. C., et al. 2011, ApJ, 142, 126
- Sneden (1973) Sneden, C. 1973, ApJ, 184, 839
- Sneden, Ivans, & Kraft (2000) Sneden, C., Ivans, I. I., & Kraft, R. P. 2000, Mem. Soc. Astron. Italiana, 71, 657
- Stetson (1987) Stetson P. B. 1987, PASP, 99, 191
- Stetson (1994) Stetson P. B. 1994, PASP, 106, 250
- Stetson & Harris (1988) Stetson P. B., & Harris, W. E. 1988, AJ, 96, 909
- Zachairias et al. (2004) Zacharias, N., Monet, D. G., Levine, S. E., et al. 2004, AAS, 205, 4815