Exploring galaxy dark matter halos across redshifts with strong quasar absorbers
Abstract
Quasar lines of sight intersect intervening galaxy discs or circum-galactic environments at random impact parameters and potential well depths. Absorption line velocity widths () are known to scale with host galaxy stellar masses, and inversely with the projected separation from the quasar line of sight. Its dependence on stellar mass can be eliminated by normalising with the emission-line widths of the host galaxies, , so that absorbers with a range of values can be compared directly. Using a sample of DLA systems at 0.2 3.2 with spectroscopically confirmed host galaxies, we find that the velocity ratio decreases with projected distances from the hosts. We compare the data with expectations of line-of-sight velocity dispersions derived for different dark matter halo mass distributions, and find that models with steeper radial dark matter profiles provide a better fit to the observations, although the scatter remains large. Gas outflows from the galaxies may cause an increased scatter, or scale radii of dark matter halo models may not be representative for the galaxies. We demonstrate by computing virial velocities, that metal-rich DLAs that belong to massive galaxy halos ( M⊙) mostly remain gravitationally bound to the halos.
keywords:
quasars: absorption lines – galaxies: abundances – galaxies: halos – galaxies: high-redshift – galaxies: kinematics and dynamics – cosmology: observations1 Introduction
A wealth of information about the chemical evolution of the Universe from low to high redshifts can be obtained from observations of the strongest hydrogen absorption lines in spectra of luminous sources such as quasars or gamma-ray bursts. Metallicities have been measured for hundreds of the strongest intervening absorption systems, the damped Lyman- absorbers (DLAs) and sub-DLAs out to redshifts (e.g. Prochaska et al., 2003; Rafelski et al., 2014), revealing a gradual increase of metallicity with increasing cosmic time. Other notable important measurements include the evolution of the cosmic neutral hydrogen density contained in DLAs and sub-DLAs (Noterdaeme et al., 2012b; Zafar et al., 2013; Crighton et al., 2015; Sánchez-Ramírez et al., 2016), and the evolution of dust properties and dust correction to metallicities (De Cia et al., 2018).
Historically, the nature of DLAs have been debated when only the absorption-line information was available. Early on, DLAs were suggested to probe preferentially rotating galaxy discs (Wolfe et al., 1986) based on the observed velocities and line profiles with leading edges (Prochaska & Wolfe, 1997). This was supported by models of disc formation (Mo et al., 1998), whereas numerical simulations showed that line profiles could as well be explained by complex gas dynamics in protogalactic clumps within a hierarchical formation scenario (Haehnelt et al., 1998).
DLAs have typically several () narrow absorption components identified in their metal absorption lines, with a global velocity width that is much larger than the intrinsic widths of km s-1 for each component (e.g. Dessauges-Zavadsky et al., 2003; Kulkarni et al., 2012). The observed spread of velocity widths ranging from 20 and up to 400 km s-1 suggest a connection to rather massive galaxies, where additional clouds in the galaxy halos besides components that arise in the galaxy discs contribute to the global and diverse absorption line profiles (Wolfe et al., 2005). Particularly, the presence of outflows from galaxies can explain higher velocity components seen in some DLAs (Bouché et al., 2013). Numerical simulations have shown that average DLAs (dominated by low-metallicity systems) arise in halos of preferentially faint, low-mass galaxies (Nagamine et al., 2007; Cen, 2012; Rahmati & Schaye, 2014; Bird et al., 2015), but the large cosmological simulations do not have a sufficient resolution to distinguish individual components that contribute to a single DLA system.
Understanding the nature of DLAs hinges on the knowledge of the connection between DLAs in absorption and their host galaxies detected in emission. At redshifts the success rate of identifying galaxy counterparts is relatively high since the galaxies are brighter (e.g. Chen et al., 2005; Péroux et al., 2011a). More recent observations with modern, sensitive instruments have provided a breakthrough by spectroscopically confirming in emission the host galaxies associated with higher-redshifts DLAs (e.g. Fynbo et al., 2010; Péroux et al., 2011a; Noterdaeme et al., 2012a; Krogager et al., 2013; Fynbo et al., 2013; Neeleman et al., 2018). To date, the majority of detected galaxies are preferentially associated with metal-rich DLAs. The numerous failures of searches for DLA galaxy counterparts and upper detection limits can be explained with a simple model that involved a luminosity-metallicity relation, where non-detections mostly belong to low-metallicity DLAs, and hence low-mass and low-luminosity galaxies (Krogager et al., 2017).
Besides the directly measurable metallicities, DLAs themselves contain additional information about the parent galaxy. The velocity widths of metal absorption lines spanning 90% of the integrated optical depths (defining in Prochaska & Wolfe, 1997; Wolfe & Prochaska, 1998) scale with absorber metallicity in a relation that evolves with redshift (Ledoux et al., 2006; Prochaska et al., 2008; Neeleman et al., 2013). Moreover, this relation can be interpreted as a relation between DLA metallicity and host galaxy halo mass (Møller et al., 2013), reflecting the known luminosity-selected galaxy mass-metallicity relation (Tremonti et al., 2004; Maiolino et al., 2008). By measuring the stellar masses of the host galaxies, we now know that DLAs indeed follow a mass-metallicity relation (Christensen et al., 2014; Augustin et al., 2018; Rhodin et al., 2018).
One of the remaining pieces of the puzzle is how the DLA velocity widths and metallicities observed at some random impact parameters, defined as the projected distance between the host galaxy and quasar line of sight, spanning from a few- and up to 100 kpc, are affected by the host itself. DLAs have been suggested to arise either in infalling pristine gas from the intergalactic medium or in outflows from the host galaxies (Bouché et al., 2013; Péroux et al., 2016), or simply neutral halo gas extending far from the galaxies.
Located at projected distances between a few and up to 100 kpc from the host galaxies, DLAs must experience the gravity from the matter distribution of the host galaxy, both from baryonic matter at scales defined by the stellar components, and the dark matter (DM) potential. Using both quasars and gamma-ray bursts (GRBs) to trace DLA systems with average spatial offsets between GRB locations and the host galaxy centres, Arabsalmani et al. (2015) suggest that the location relative to the galaxy affects both velocities and metallicities with a radial dependence that cancel each other. In Møller & Christensen (2019) we investigate the dependence of the projected spatial location on the velocity and metallicity information from the DLA itself by comparing quasar and GRB-DLAs, and find a scaling relation between DLA velocities, host galaxy masses and DLA impact parameters. We find evidence for an increasing velocity width (measured by ) in close projection to the host galaxy, but also a dependence that scales with the velocity dispersion () of the host galaxy itself.
In this paper, we analyse the velocities in DLAs and their host galaxies as probes of the gravitational potential at the location of the DLA. Different models of DM distributions in galaxy halos give rise to variations of the projected line-of-sight velocity dispersions as a function of radius from the central galaxy (Sections 3 and 4) depending on the host galaxy halo masses. We compare the velocities with numerical simulations in Section 5, and show remarkable correspondence between simulations and the data. Section 6 presents the summary.
2 DLA velocity widths and galaxy scaling relations
Models of galaxy formation can be used to predict the rotational velocities of galaxies (e.g. Mo et al., 1998). Unfortunately, observations of DLAs do not provide information of the circular velocity of the DM halos or detailed transversely resolved velocity information. DLAs only probe velocity components of individual clouds along a single line of sight at a random impact parameter from the centre of the galaxy, and rotation curves of the host galaxies have been measured only in a few instances (e.g. Chen et al., 2005; Péroux et al., 2011a; Bouché et al., 2013). Whereas the gaseous structure that comprise a DLA system might be large, individual clouds that contribute to the DLAs can be much smaller, with sizes as small as 0.1 pc (Krogager et al., 2016). However, much larger structures covering coherent sizes of 100 kpc have also been reported for DLAs (Ellison et al., 2007). Since DLAs contain several components separated in velocity space, where each one is located inside the potential well of the galaxy, we may use the full DLA system as a probe of the host halo velocity dispersion.
Logically, more massive galaxies in more massive halos give rise to higher velocity dispersion at a fixed distance, so in order to compare galaxies spanning a large range in masses, we also need to know the masses of the galaxies and halos themselves. Because scales with the metallicity of the galaxy (Ledoux et al., 2006; Neeleman et al., 2013) it follows from the mass-metallicity relations that a scaling between and the stellar mass of the parent galaxy exists too (Møller et al., 2013). In addition, the galaxies themselves obey scaling relations with velocities. For example, the relation between the stellar mass and the velocity width () of strong emission lines, the so-called stellar-mass Tully-Fisher relation (Kassin et al., 2007) is well known. For various galaxy samples this relation is found to be redshift invariant at (Christensen & Hjorth, 2017).
The existence of these scaling relations allow us to compare DLA systems with a large range of arising from galaxies with a large range in stellar masses. We compile data from the literature for a sample of observed DLA systems, where host galaxies have been detected in emission and emission-line velocities are reported (see details in Møller & Christensen, 2019). Table 1 presents the sample of 21 DLAs at redshifts for which we have information of both and . We also include an additional 11 identified DLA galaxies with measured stellar masses in Table 1, which will be used to investigate how the velocities correlate with halo masses.
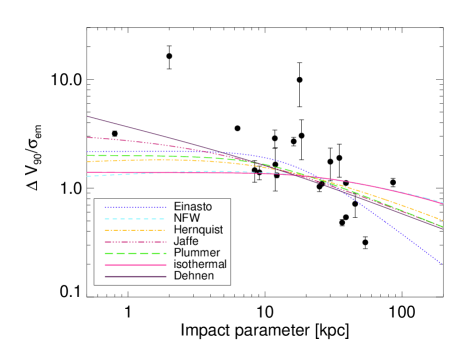
In Fig. 1 we illustrate the measured ratio as a function of impact parameters for the DLAs. In Møller & Christensen (2019) we argue that this relation arises as metallicity traces the local gravitational potential at the location of the DLA.
Following on that result we here investigate the underlying reason for this scaling relation. The gravitational potential that is dominated by dark matter at large distances can be computed from theoretical models of its mass distribution, and here we aim to test a wide range of such models against this new set of observational constraints.
| Quasar | log | log | () | References | |||||
|---|---|---|---|---|---|---|---|---|---|
| [kpc] | [km s-1] | [km s-1] | [log M⊙] | [log M⊙] | [kpc] | ||||
| 0439–433 | 0.1012 | 0.1010 | 7.2 | 275 | — | 10.010.02 | 11.56 | 17.8 | 23 |
| 0151+045 | 0.1602 | 0.1595 | 18.5 | 152 | 5020 | 9.730.04 | 11.43 | 15.9 | 2,3 |
| 0738+313 | 0.2212 | 0.2222 | 20.3 | 60 | — | 9.330.05 | 11.26 | 13.6 | 9,24,29 |
| 1127–145 | 0.3127 | 0.3121 | 17.5 | 123 | — | 8.290.08 | 10.80 | 8.8 | 9,24 |
| 0827+243 | 0.5247 | 0.5263 | 38.4 | 188 | — | 10.090.15 | 11.76 | 21.8 | 9,24,29 |
| 2328+0022 | 0.65179 | 0.65194 | 11.9 | 92 | 5624 | 10.620.35 | 12.21 | 33.2 | 4,1 |
| 2335+1501 | 0.67972 | 0.67989 | 27.0 | 104 | — | 9.830.21 | 11.64 | 19.4 | 4,6,1 |
| 1122–1649 | 0.6819 | 0.68249 | 25.6 | 144 | — | 9.450.15 | 11.33 | 14.5 | 4,24 |
| 1323–0021 | 0.71612 | 0.7171 | 9.1 | 141 | 10114 | 10.800.10 | 12.47 | 42.3 | 5 |
| 1436–0051A | 0.7377 | 0.73749 | 45.5 | 71 | 9925 | 10.410.09 | 12.03 | 27.9 | 4,6 |
| 0153+0009 | 0.77219 | 0.77085 | 36.6 | 58 | 1218 | 10.030.13 | 11.78 | 22.0 | 4,1 |
| 0152–2001 | 0.7798 | 0.78025 | 54.0 | 33 | 10413 | — | — | — | 7 |
| 1009–0026 | 0.8866 | 0.8864 | 39.0 | 94 | 1745 | 11.060.03 | 13.18 | 58.4 | 6,8,9 |
| 1436–0051B | 0.9281 | 0.92886 | 34.9 | 62 | 3311 | 10.200.11 | 11.91 | 24.7 | 4,6 |
| 0021+0043 | 0.94181 | 0.9417 | 86.0 | 139 | 12311 | — | — | — | 10,1 |
| 0452–1640 | 1.00630 | 1.0072 | 16.0 | 70 | — | 9.10.2 | 11.31 | 14.0 | 27,28,1 |
| 0302–223 | 1.00945 | 1.00946 | 25.0 | 61 | 596 | 9.650.08 | 11.60 | 18.4 | 8,9 |
| 2352–0028 | 1.03917 | 1.0318 | 12.2 | 164 | 1256 | 9.40.3 | 11.47 | 16.2 | 6,27,28,1 |
| 2239–2949 | 1.82516 | 1.8260 | 20.8 | 64 | — | 9.810.50 | 11.77 | 20.4 | 25,16 |
| 2206–1958 | 1.91999 | 1.9220 | 8.4 | 136 | 9321 | 9.450.30 | 11.57 | 16.8 | 9,11 |
| 1228–1139 | 2.19289 | 2.1912 | 30.0 | 163 | 9331 | — | — | — | 12,13 |
| 1135–0010 | 2.2066 | 2.2073 | 0.8 | 168 | 533 | — | — | — | 14 |
| 0124+0044 | 2.26223 | 2.2620 | 10.9 | 142 | — | 10.160.14 | 12.01 | 23.3 | 16,1 |
| 2243–603 | 2.3298 | 2.3283 | 26.0 | 173 | 1585 | 10.100.10 | 11.98 | 22.2 | 15,16,26 |
| 2222–0946 | 2.3542 | 2.3537 | 6.3 | 174 | 492 | 9.620.12 | 11.69 | 16.8 | 17,9,22 |
| 0918+1636 | 2.4121 | 2.4128 | 2.0 | 344 | 215 | — | — | — | 18 |
| 1439+1117 | 2.41802 | 2.4189 | 39.0 | 338 | 30312 | 10.740.18 | 12.50 | 35.3 | 19,20 |
| 0918+1636 | 2.5832 | 2.58277 | 16.2 | 288 | 10710 | 10.330.08 | 12.15 | 24.3 | 18,9 |
| 0139–0824 | 2.6771 | 2.6772 | 13.0 | 168 | — | 8.230.20 | 10.90 | 7.3 | 16,1 |
| 0528–250 | 2.8110 | 2.8136 | 9.1 | 304 | — | 8.790.15 | 11.22 | 9.5 | 9,24 |
| 2358+0149 | 2.97919 | 2.9784 | 11.8 | 135 | 479 | — | — | — | 21 |
| 2233+1318 | 3.14930 | 3.15137 | 17.9 | 228 | 2310 | 9.850.14 | 11.85 | 15.9 | 11,9 |
3 Line-of-sight velocity dispersions in halos
To compare the observations with predictions of velocity dispersions of galaxy halos, we need to compute the expected radial profiles. Far from the stellar disc of the galaxy and the baryonic components, the mass contribution is dominated by dark matter. Assuming a density distribution of the DM one can compute the line-of-sight velocity dispersion, , as a function of projected radial distance, , from the galaxy. This quantity should be equivalent to measuring a velocity dispersion as a function of the impact parameter as provided by the observations of . For an isotropic distribution (Binney & Tremaine, 1987; Merritt, 1987; Hernquist, 1990; Dehnen, 1993), this can be computed as
| (1) |
where the normalisation depends on the projected surface density given by
| (2) |
is the radial velocity dispersion, which can be derived from the Jeans equation as
| (3) |
with the mass profile as function of radius being
| (4) |
All equations above depend on the radial density profile, which can be parameterised as a double power-law
| (5) |
where is a scale radius and the central density. Various combinations of [, ] give the known profiles from Hernquist (1990) [1,4,1], Jaffe (1983) [1,4,2], Plummer (1911) [2,5,0], and NFW Navarro et al. (1997) [1,3,1] and an isothermal profile [2,3,0] (Binney & Tremaine, 1987). Other special cases of DM profiles are suggested by Dehnen (1993):
| (6) |
where the factor can be chosen to give a steeper inner profile than other density profiles for . In addition to this suite of halo models, we also investigate the Einasto profile (Einasto, 1965) parameterised as
| (7) |
All these radial DM profiles include the most common and classical halo models used in theoretical works. As the density profiles have varying slopes the differences in the projected line-of-sight velocity dispersions are apparent at either very small or large radial distances.
Line-of-sight radial velocity dispersion profiles, , for the various density distributions are illustrated in Fig. 1. To compare models with the data points, we initially use a common scale radius of kpc for all models, defining a relatively steep slope for the Einasto profile, and for the Dehnen (1993) model to represent a very steep inner density profile. The velocity dispersion profiles are normalised to provide the smallest values to fit the data.
To evaluate whether for a halo gives a value representative of for a DLA, we compute the absolute value of by setting the scale radius kpc, and from abundance matching in Sect. 4, we compute the median DLA halo mass from Table 1 to be M⊙. This gives km s-1 depending on the chosen DM halo mass profile at , while the median measured = 141 km s-1 in Table 1. Therefore it is a good approximation to set . The median stellar mass of the DLA galaxies in Table 1 is M⊙, for which the stellar-mass Tully-Fisher relation in Christensen & Hjorth (2017) implies an emission-line velocity dispersion of km s-1. With these simple considerations, we expect the curves in Fig. 1 to lie around at kpc in good agreement with the measured data points and their spread.
4 Galaxy scale radii in halo models
4.1 Dark matter halo scale radii
Since this analysis involves galaxies with very different stellar masses over a range of redshifts, a direct comparison as done in Section 3 is too simplified since the scale radii of the galaxies are not the same. In order to place the galaxies in the same system and compare to models, it is relevant to scale the observed impact parameters with the galaxies’ scale radii. These scale radii depend on the galaxy mass and dark matter concentration parameters, which again depend on redshifts.
The total stellar masses are known for some of the galaxies in Table 1, and are computed by fitting spectral energy distributions (SEDs) to template spectra created with a range of star formation histories, stellar ages, reddenings, and metallicities. In all SED fits, a Chabrier initial mass function has been adopted. We refer the reader to Christensen et al. (2014) and Rhodin et al. (2018), where SED fits to DLA galaxies are explained in detail. To compute the DM halo masses, we use the formalism from halo abundance matching methods described in Moster et al. (2013). Halo abundance matching techniques generally find that the fraction of stellar to dark matter mass peaks around M⊙ with a weak redshift evolution. For each of the DLA galaxies with known stellar masses we compute halo masses listed in Table 1, taking into account the redshift evolution from abundance matching models. The halo masses correlate with the DLA metallicity, following the scaling between the host galaxy stellar-mass and DLA metallicity. Halo masses of M⊙ for these metal-rich absorbers agree with the high bias factors from cross-correlations with the Lyman- forest for metal-rich systems and consequently large halo masses (Pérez-Ràfols et al., 2018).
The next step is to derive the scale radii. The halo mass within the virial radius of the galaxy () can be described as
| (8) |
where is the overdensity and is the critical energy density in a flat universe at redshift,
| (9) |
The Hubble parameter evolves as with . In this paper, we use a flat cosmology with , , and km s-1 Mpc-1 (Komatsu et al., 2011). The overdensity can be parametrised as
| (10) |
(Bryan & Norman, 1998; Posti et al., 2014), where
| (11) |
The scale radius and halo radius are connected through the concentration parameter, . Numerical simulations (Mo & Mao, 2004) have shown that the concentration parameter depends on the halo mass
| (12) |
More recent numerical simulations find a different dependence (Klypin et al., 2011)
| (13) |
Combining equations 8, 9, 10 and 12, we get
| (14) |
or alternatively with equations 8, 9, 10 and 13, we get
| (15) |
Whether we use equation 12 or 13, for the redshift dependence of the concentration parameters, the differences in the output results are insignificant relative to the scatter of the data points.
The concentration parameter decrease with redshift at roughly as
| (16) |
(Klypin et al., 2011), while at higher redshifts the decrease in the concentration parameter levels off (see also Zhao et al., 2009). At higher redshifts () and for very large halo masses ( M⊙) the trend changes and the concentration parameter starts to increase. However, apart from a single object (DLA1009–0026), the halos and redshifts involved in this analysis do not reach this regime, so we take a very simplistic approach. To reflect the inversion of for the massive host of DLA1009–0026 we assume that 7, similar to the also relatively massive host of DLA1323–0021 that has a slightly lower redshift. Including a redshift dependence, with , equation 15 becomes
| (17) |
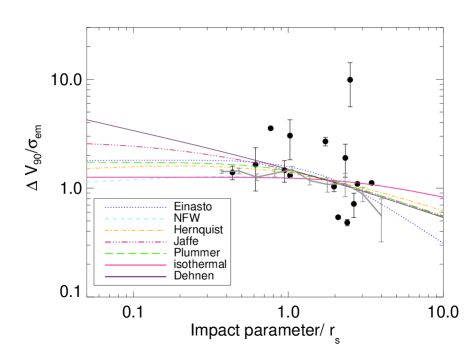
The scale radii for the DLA galaxies are listed in column 9 in Table 1. Fig. 2 illustrates the result, where impact parameters are normalised by their scale radii, reflecting the same radial dependence across all measured DLAs. The DM halo profiles have been normalised to produce the minimum value for the measured data points. Table 2 lists the values of for each model fit. Models with a flatter DM density profile slope, such as the Isothermal or NFW profiles have worse fit compared to the steeper profiles for Dehnen, Jaffe or Einasto models.
| Model | (Fig. 2) | (Fig. 1) |
|---|---|---|
| Einasto | 149 | 58 |
| NFW | 161 | 119 |
| Hernquist | 148 | 83 |
| Jaffe | 134 | 62 |
| Plummer | 147 | 71 |
| Isothermal | 161 | 120 |
| Dehnen | 127 | 57 |
There may be a complication in combining numerous diverse halos with only a single line of sight probed in each case. To compare with the velocity dispersion distribution observed in the Milky Way, we over-plot halo star velocity dispersion measurements (Battaglia et al., 2005). In order for the Milky Way to be placed in the same scaled system, we computed the scale radius kpc at based on the stellar mass =10.8 M⊙ for the Milky Way (Licquia & Newman, 2015), and assume km s-1. As seen, the MW stars follow well the DM potential given by either the Einasto, Plummer or Hernquist models, whereas the DLA data points exhibit a larger scatter.
4.2 Adding baryonic mass components
The halo models addressed above only contain dark matter. However, the baryonic components in the form of stellar mass and gaseous material also contribute to the potential and therefore also to the projected line-of-sight velocity dispersion.
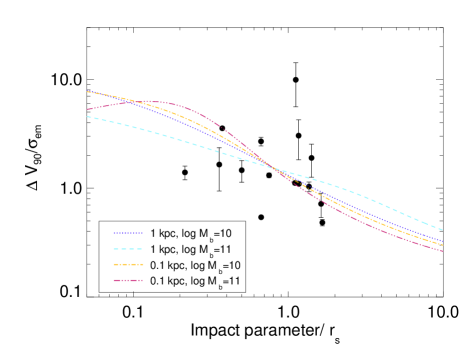
To evaluate the contribution to we add a baryonic component to a halo with a mass M⊙, derived from the median halo mass in our sample. We add an exponential disc galaxy profile with a density profile , where the disc scale length is varied between 0.1 and 1 kpc. A very small disc scale length is used because the halo models use scale radii of 1 kpc. To compute the mass distribution, the disc height, , is assumed to be always equal to 100 pc. Such a disc model is clearly very simplified, but serves the purpose of describing the changes of when including baryons. The total baryonic mass is varied from M⊙, representing a baryonic fraction of %. The radial mass profile of the galaxy is added to equation 4. Since the radial velocity dispersion depends on the dynamics of the baryonic disc, which is not known, we assume it to be equal to the rotational speed of the baryons alone. Finally, this is added in quadrature to for the DM halo to compute the combined .
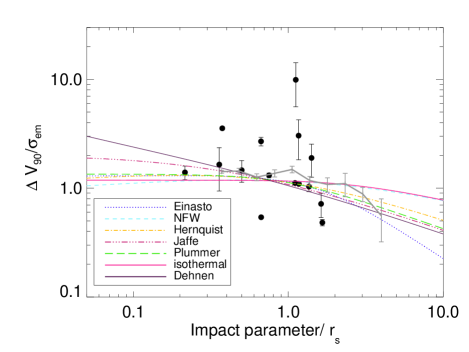
The changes for the computed profiles are illustrated in Fig. 3. When adding a massive disc component, there is a large contribution from baryons to around the disc scale length, while for less massive discs, the difference from the pure DM halo model is less pronounced.
The stellar masses of the DLA galaxies in our sample span almost three orders of magnitude from log , but we do not know the contribution from cold neutral gas to the entire galaxy mass. As DLA galaxies are by definition absorption selected, and therefore sensitive to the amount of neutral gas present, the baryonic mass may also preferentially be in the form of gas that has not yet been processed in star formation, or does not form stars at the time of observations. We therefore test the expected in the case of a gas mass 10 times that of the stellar mass. Such high values of atomic gas to stellar mass are found in local low-mass galaxies selected from the 21 cm Alfalfa survey (Huang et al., 2012). Similarly, recent 21 cm emission studies of local absorption selected (low stellar mass) galaxies have revealed Hi mass to stellar mass ratios of (Kanekar et al., 2018a), and in absorption selected galaxies, high molecular gas fractions have been detected (Møller et al., 2018; Kanekar et al., 2018b). Whether higher redshift DLA systems that probe more massive galaxies also have such high Hi gas mass fractions, is not supported by any current observations but remains to be verified by future observations. A realistic H i disc is larger in size relative to the stellar disc. Adding such a massive, extended H i disk causes the velocity dispersion profile to be flatter with a bump around the chosen scale radius. This is not consistent with the measured data points, and moreover with a fraction of , the total baryonic mass is similar to or even higher than the total DM halo mass, in conflict with the commonly accepted DM to baryonic mass fraction.
In conclusion, the models that include a stellar and gaseous components in addition to the DM halo mass are able to explain the radial dependence of . For reasonable baryon to DM fractions, the contributions from baryons do not play significant role compared to the dominant DM contribution at large impact parameters.
5 Halo virial velocities
5.1 Comparison with numerical simulations
Having derived halo virial masses, we compare the measured values with the distribution of halo virial velocities and values derived from numerical models of DLAs (Haehnelt et al., 1998; Bird et al., 2015). In the simulations, random lines of sight through galaxy halos are drawn and simulated spectra of DLAs are created with radiative transfer models. Then metal absorption line widths are measured for galaxies with known virial masses and virial velocities (Bird et al., 2015). The ratio between velocities peaks around 0.9, with a significant spread in the ratio.
In order to compare the observed DLA systems with simulations, we need to determine the halo virial velocity for each of the 26 DLA galaxies in Table 1 for which we know the stellar and halo masses. We assume the simple relation that the rotational velocity at the radius , where the overdensity is 200 times that of the cosmic value, is equal to the circular velocity . The halo mass at this radius is determined by combining equations 8 and 9: , and the halo virial velocity can be computed as
| (18) |
Comparing our observed data to the models, Fig. 4 shows a remarkable similarity. The histogram of has errorbars representing 68% confidence regions for small-number Poisson statistics (Gehrels, 1986). Testing the full cumulative distribution with a two-sided Kolmogorov-Smirnov (KS) test gives a probability of that the two distributions are drawn from the same underlying sample.
We note that the simulated DLA data are measured at a single redshift of , whereas the data points belong to a compilation of DLAs at all redshifts between 0.1 and 3.2. We checked for a possible redshift dependence by splitting the observed data in two redshift intervals at and , for which the KS test probabilities are and , respectively. For the high redshift sample, the observed galaxies show higher velocities than the simulated ones. Still, the cumulative distribution shapes remain similar to that of the full sample, so that the evidence for a systematic shift with redshift is weak.
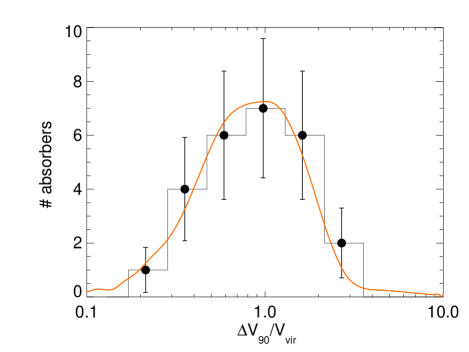
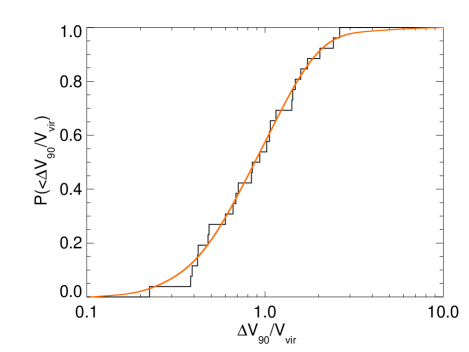
Bird et al. (2015) find that the average halo virial velocity for DLAs is 70 km s-1, while the halos we have analysed here have higher velocities ranging from km s-1 and a median of km s-1, simply because the DLA hosts detected to date are dominated by more massive and luminous galaxies belonging to relatively metal-rich DLAs. In addition, impact parameters are not presented for the simulations, but if a radial dependence of also exist in simulations, it would imply that lower values were more common because the cross section at larger radii is higher. The excellent agreement illustrated in Fig. 4 could therefore be a coincidence. For a proper comparison with numerical simulations we need to know the stellar- or halo masses of hosts for each of the individual simulated DLAs, as well as the impact parameters used for determining .

Even though we do not know the spatial position of the individual components along the line of sight that give rise to the full absorption line profile in observations, the correspondence does give credit to the interpretation that DLA absorption line widths trace the host halo potential. Fig. 5 illustrates the dependence of the impact parameter on the derived fraction. Although there is no clear scaling relation, no DLA systems with a high velocity width relative to is found at large impact parameters, indicating that the DLA systems are gravitationally bound to the halos. To check if redshifts and the local gravitational potential play an important role for in simulations, it is necessary to compare the observed data with simulated DLAs at a range of redshifts with known impact parameters from simulated galaxies that better match the observed masses of the DLA galaxies. Such comparisons between models and simulations will be the aim of a future study.
5.2 DLA systems are bound to the host halos
Having computed the halo mass distributions, we can proceed to ask if the DLA systems are bound to the halos, or whether their velocities are sufficient to allow them to escape from the parent galaxy potential (see also Møller & Christensen, 2019). By computing the relative velocity offsets from the DLA absorption redshift and galaxy emission redshifts listed in Table 1, we can compare with the escape velocities at the DLA impact parameters.
First we scale the halo mass profile to the total mass of the DLA DM halo plus the galaxy stellar mass. Then we find the enclosed mass at the DLA impact parameter and compute the escape velocity at that position. Fig. 6 illustrates that from the 26 DLA-galaxy pairs only three DLA systems (DLA0738+313, DLA1127–145, and DLA0827+243) have relative velocities that allow them to escape the host galaxy potential. However, these three relative velocities are just barely above the escape velocities by 55, 18 and 62 km s-1, respectively. The illustration in Fig. 6 uses a Hernquist density distribution, but another density profile will not change the conclusion. For the remaining 23 DLAs, and even if the DLAs arise in galaxy outflows, the gas does not have sufficiently large velocities to allow it to escape the potential well of the galaxies.
We can only measure the radial velocity component along the line of sight from the absorption and emission redshifts, meaning that any tangential velocity differences are ignored. However, this correction is expected to be small compared to the computed escape velocities. The correction is of the order of a few km s-1 computed from Equation 3 to represent the tangential velocity (dispersion) on the plane of the sky.

6 Discussion and summary
In this paper we use absorption and emission lines in DLA systems and their host galaxies to probe the gravitational potential of the host galaxy halo at the random line of sight to the background quasars through the intervening galaxy. We compare observed DLAs with predictions of velocity dispersions from a range of dark matter models. The velocity offsets between DLA systems and host galaxies compared to escape velocities at the measured impact parameters demonstrate that DLA clouds mostly remain gravitationally bound to the host galaxies. We furthermore compare the ratio of to virial velocities with numerical simulations, and while the match is good, it could be a coincidence as the observations with detected DLA hosts systematically include more massive galaxies than the simulations.
6.1 DLAs as probes of galaxy halos
The absorption line width, , has previously been proven to scale with the DLA metallicity and also with the stellar mass of the host galaxy. As a consequence, metal-rich DLA systems also belong to massive halos. In a sample of 26 metal-rich DLA systems with metallicities in the range with spectroscopically confirmed host galaxies, we compute their corresponding halo masses to lie in the range M⊙ with a median of M⊙. Rotation curves of three DLA galaxies that are also included in our sample yielded similarly high halo masses (Péroux et al., 2013). These high values of halo masses are in excellent agreement with the high bias factor measured by cross-correlating DLAs with the Ly forest, which implies that those metal-strong DLAs arise in massive halos M⊙, while metal-weaker systems arise in halos that are two orders of magnitude less massive (Pérez-Ràfols et al., 2018).
The values lie between km s-1 corresponding to a large dynamical range of galaxy masses. In order to compare velocities in galaxies with masses spanning almost 3 orders of magnitude, we therefore normalise this velocity width by the velocity dispersion of the host galaxy traced by its emission lines, . We investigate the radial dependence of this dimensionless parameter for DLAs and their host galaxies, and compare with line-of-sight velocity dispersions expected from various DM model distributions. The DLA data suggest a steep radial dependence of the distribution out to a distance of 60 kpc from the host. While the different halo mass distributions give quite different predictions for the line-of-sight velocity dispersions at either very large or small impact parameters, the currently known data sample does not allow us to rule out any of the models.
Extra mass-components from baryons, which dominate at low impact parameters, give rise to steeper or flatter profiles depending on the (baryonic) scale radii. However, in order to explain the steepness of the relations and the scatter of data points, we have to modify the baryonic component for each DLA system individually such that no global scaling relation is obvious. In comparison, the velocity dispersions of halo stars in the Milky Way apparently can be described to follow pure DM models without the need to add a baryonic component.
6.2 Spread of measurements
Several effects could contribute to the observed scatter of the data points relative to that predicted by the various DM halo models. Outflows from galaxies would increase both and as the latter also scales with galaxy star-formation rates (Krühler et al., 2015; Christensen & Hjorth, 2017). Outflows will therefore cause minor increase in the scatter of the ratio. Additionally, some DLAs are known to arise in galaxy groups (Kacprzak et al., 2010; Péroux et al., 2017; Fynbo et al., 2018), and dynamical interactions between group members and their overlapping halos are likely to affect the kinematics of the absorbers, as detected in the complex inter-group gas kinematics associated with the DLA towards Q1127–145 (Chen et al., 2019).
The DM halo models presented in this work assume spherical symmetry, which does not need to be the case. In galaxy clusters for example, velocity anisotropies along different directions have been measured (e.g. Wojtak et al., 2009). How this can affect individual halos such as those probed by DLAs is not clear, but any anisotropy cannot explain the very large values of in Fig. 2.
When comparing the distributions in Fig. 1 that were not scaled according to DM halo models (see also Møller & Christensen, 2019) to the scaled models in Fig. 2, it is not evident that the more advanced theoretical models provide better fits to the data. Table 2 shows that the unscaled data have less scatter compared to the predicted velocities from all DM distributions. When computing the scale radii, , we rely on abundance matching of halo to stellar mass ratios. However, studies of weak gravitational lensing, Tully-Fisher relations, and stellar kinematics have demonstrated that individual galaxy halo masses can be under-predicted by abundance matching by as much as a factor of 10 (Leauthaud et al., 2012). Scale radii would accordingly be smaller by up to dex and the data points move to smaller values, but because this is not a systematic shift we cannot make a global correction to the data in Fig. 2.
Some of the scatter seen in Fig. 2 may be caused by DLA galaxies observed with a spectral resolution that only allows the emission lines to be marginally resolved and is therefore uncertain. Another effect for the data point with the highest value (from DLA2233+131 at ), is that it has an unusually small . At redshifts the stellar-mass Tully-Fisher relation has a much larger scatter compared to at lower redshifts (Christensen & Hjorth, 2017), and the small may reflect this breakdown of the TF relation. Therefore the normalisation by may not be valid at .
In addition, the impact parameters are measured in projection, which could in principle move the data points in Figures 2 and 3 slightly to the right. DLAs likely consist of multiple individual cloud components that each have different physical distances from the halo centre, and for a uniform distribution along the line of sight, the average distance will be dominated by components close to the plane of the sky, and the correction to the measured impact parameter will therefore be small. Occasionally, DLA systems have a single absorption component, which is significantly offset from the rest of the components. If it happens to contribute by more than 5% of the total optical depth will be severely affected. Possibly this single component does belong to the DLA system, e.g. in a high velocity cloud along the line of sight, or occasionally to a rotating disk (Prochaska & Wolfe, 1997), or it could be otherwise unrelated. In this work we use reported in the literature along with a few additional values measured from archive data. For a single one of the DLAs (towards Q0153+0009) we find a significantly smaller value than Meiring et al. (2009), who determined a higher value from a weak component offset in velocity compared to the main bulk of components.
6.3 Observed and simulated DLA velocity widths
In order to use the DM models to predict the projected velocity dispersions, the measured data need to have several trace particles along the line of sight for a proper comparison. The observed DLA systems are likely contained in few gas clouds that are confined spatially within the galaxy halo, and the global velocity widths of these gas clouds represent the dynamical motions. In this work we assume that the velocities represented by is a measure of the projected velocity dispersion, and that the components in a DLA system trace multiple individual clouds along the quasar line-of-sight (see also the discussion in Møller & Christensen, 2019). Numerical simulations have investigated the spatial location of these individual components finding that the high density DLA absorption systems typically trace a path length of kpc depending on how large is (Bird et al., 2015). As the halo masses in Table 1 imply virial radii in the range kpc, similar in size to the simulated objects, we assume that the observed DLAs probe similar path length through the halos.
The earliest simulations were unable to reproduce the large (Haehnelt et al., 1998; Pontzen et al., 2008), but by including feedback from supernova explosions, modern numerical simulations are better able to reproduce the observed distributions (Cen, 2012; Bird et al., 2015). The observed values have a few values above what can be explained from simple dark matter plus baryon models hinting that additional velocity components to are needed for some of the systems. The data fits the simulated for DLAs remarkably well, suggesting that the observations do indeed trace gaseous components in galaxy halos that have been affected by feedback effects. By comparing the actual measured with the expected value from models alone, we may derive how much of the DLA gas have been affected by such feedback mechanisms.
In a future investigation, we will expand this investigation by analysing simulated DLAs at different redshifts instead of the single model used here. It would also be interesting to investigate the dependence of with impact parameters in simulations in order to compare with the observed trends.
Acknowledgements
We thank Steen H. Hansen and Radek Wojtak for useful discussions. LC and HR are supported by YDUN grant DFF 4090-00079. KEH acknowledges support by a Project Grant (162948–051) from The Icelandic Research Fund. The Cosmic Dawn Center is funded by the DNRF.
References
- Arabsalmani et al. (2015) Arabsalmani, M., Møller, P., Fynbo, J. P. U., Christensen, L., Freudling, W., Savaglio, S., & Zafar, T. 2015, MNRAS, 446, 990
- Augustin et al. (2018) Augustin, R., et al. 2018, MNRAS, 478, 3120
- Battaglia et al. (2005) Battaglia, G., et al. 2005, MNRAS, 364, 433
- Binney & Tremaine (1987) Binney, J., & Tremaine, S. 1987, Galactic dynamics
- Bird et al. (2015) Bird, S., Haehnelt, M., Neeleman, M., Genel, S., Vogelsberger, M., & Hernquist, L. 2015, MNRAS, 447, 1834
- Bouché et al. (2013) Bouché, N., Murphy, M. T., Kacprzak, G. G., Péroux, C., Contini, T., Martin, C. L., & Dessauges-Zavadsky, M. 2013, Science, 341, 50
- Bryan & Norman (1998) Bryan, G. L., & Norman, M. L. 1998, ApJ, 495, 80
- Cen (2012) Cen, R. 2012, ApJ, 748, 121
- Chen et al. (2019) Chen, H.-W., Boettcher, E., Johnson, S. D., Zahedy, F. S., Rudie, G. C., Cooksey, K. L., Rauch, M., & Mulchaey, J. S. 2019, ApJ, 878, L33
- Chen et al. (2005) Chen, H.-W., Kennicutt, R. C., Jr., & Rauch, M. 2005, ApJ, 620, 703
- Christensen & Hjorth (2017) Christensen, L., & Hjorth, J. 2017, MNRAS, 470, 2599
- Christensen et al. (2014) Christensen, L., Møller, P., Fynbo, J. P. U., & Zafar, T. 2014, MNRAS, 445, 225
- Christensen et al. (2005) Christensen, L., Schulte-Ladbeck, R. E., Sánchez, S. F., Becker, T., Jahnke, K., Kelz, A., Roth, M. M., & Wisotzki, L. 2005, A&A, 429, 477
- Crighton et al. (2015) Crighton, N. H. M., et al. 2015, MNRAS, 452, 217
- De Cia et al. (2018) De Cia, A., Ledoux, C., Petitjean, P., & Savaglio, S. 2018, A&A, 611, A76
- Dehnen (1993) Dehnen, W. 1993, MNRAS, 265, 250
- Dessauges-Zavadsky et al. (2003) Dessauges-Zavadsky, M., Péroux, C., Kim, T. S., D’Odorico, S., & McMahon, R. G. 2003, MNRAS, 345, 447
- Einasto (1965) Einasto, J. 1965, Trudy Astrofizicheskogo Instituta Alma-Ata, 5, 87
- Ellison et al. (2007) Ellison, S. L., Hennawi, J. F., Martin, C. L., & Sommer-Larsen, J. 2007, MNRAS, 378, 801
- Ellison et al. (2005) Ellison, S. L., Kewley, L. J., & Mallén-Ornelas, G. 2005, MNRAS, 357, 354
- Fynbo et al. (2013) Fynbo, J. P. U., et al. 2013, MNRAS, 436, 361
- Fynbo et al. (2018) Fynbo, J. P. U., et al. 2018, MNRAS, 479, 2126
- Fynbo et al. (2010) Fynbo, J. P. U., et al. 2010, MNRAS, 408, 2128
- Gehrels (1986) Gehrels, N. 1986, ApJ, 303, 336
- Haehnelt et al. (1998) Haehnelt, M. G., Steinmetz, M., & Rauch, M. 1998, ApJ, 495, 647
- Hernquist (1990) Hernquist, L. 1990, ApJ, 356, 359
- Huang et al. (2012) Huang, S., Haynes, M. P., Giovanelli, R., & Brinchmann, J. 2012, ApJ, 756, 113
- Jaffe (1983) Jaffe, W. 1983, MNRAS, 202, 995
- Kacprzak et al. (2010) Kacprzak, G. G., Murphy, M. T., & Churchill, C. W. 2010, MNRAS, 406, 445
- Kanekar et al. (2018a) Kanekar, N., Neeleman, M., Prochaska, J. X., & Ghosh, T. 2018a, MNRAS, 473, L54
- Kanekar et al. (2018b) Kanekar, N., et al. 2018b, ApJ, 856, L23
- Kanekar et al. (2014) Kanekar, N., et al. 2014, MNRAS, 438, 2131
- Kassin et al. (2007) Kassin, S. A., et al. 2007, ApJ, 660, L35
- Klypin et al. (2011) Klypin, A. A., Trujillo-Gomez, S., & Primack, J. 2011, ApJ, 740, 102
- Komatsu et al. (2011) Komatsu, E., et al. 2011, ApJS, 192, 18
- Krogager et al. (2013) Krogager, J.-K., et al. 2013, MNRAS, 433, 3091
- Krogager et al. (2016) Krogager, J.-K., Fynbo, J. P. U., Noterdaeme, P., Zafar, T., Møller, P., Ledoux, C., Krühler, T., & Stockton, A. 2016, MNRAS, 455, 2698
- Krogager et al. (2017) Krogager, J.-K., Møller, P., Fynbo, J. P. U., & Noterdaeme, P. 2017, MNRAS, 469, 2959
- Krühler et al. (2015) Krühler, T., et al. 2015, A&A, 581, A125
- Kulkarni et al. (2012) Kulkarni, V. P., Meiring, J., Som, D., Péroux, C., York, D. G., Khare, P., & Lauroesch, J. T. 2012, ApJ, 749, 176
- Leauthaud et al. (2012) Leauthaud, A., et al. 2012, ApJ, 744, 159
- Ledoux et al. (2006) Ledoux, C., Petitjean, P., Fynbo, J. P. U., Møller, P., & Srianand, R. 2006, A&A, 457, 71
- Licquia & Newman (2015) Licquia, T. C., & Newman, J. A. 2015, ApJ, 806, 96
- Maiolino et al. (2008) Maiolino, R., et al. 2008, A&A, 488, 463
- Meiring et al. (2009) Meiring, J. D., Lauroesch, J. T., Kulkarni, V. P., Péroux, C., Khare, P., & York, D. G. 2009, MNRAS, 397, 2037
- Merritt (1987) Merritt, D. 1987, ApJ, 313, 121
- Mo & Mao (2004) Mo, H. J., & Mao, S. 2004, MNRAS, 353, 829
- Mo et al. (1998) Mo, H. J., Mao, S., & White, S. D. M. 1998, MNRAS, 295, 319
- Møller & Christensen (2019) Møller, P., & Christensen, L. 2019, MNRAS submitted
- Møller et al. (2018) Møller, P., et al. 2018, MNRAS, 474, 4039
- Møller et al. (2013) Møller, P., Fynbo, J. P. U., Ledoux, C., & Nilsson, K. K. 2013, MNRAS, 430, 2680
- Moster et al. (2013) Moster, B. P., Naab, T., & White, S. D. M. 2013, MNRAS, 428, 3121
- Nagamine et al. (2007) Nagamine, K., Wolfe, A. M., Hernquist, L., & Springel, V. 2007, ApJ, 660, 945
- Navarro et al. (1997) Navarro, J. F., Frenk, C. S., & White, S. D. M. 1997, ApJ, 490, 493
- Neeleman et al. (2018) Neeleman, M., Kanekar, N., Prochaska, J. X., Christensen, L., Dessauges-Zavadsky, M., Fynbo, J. P. U., Møller, P., & Zwaan, M. A. 2018, ApJ, 856, L12
- Neeleman et al. (2016) Neeleman, M., et al. 2016, ApJ, 820, L39
- Neeleman et al. (2013) Neeleman, M., Wolfe, A. M., Prochaska, J. X., & Rafelski, M. 2013, ApJ, 769, 54
- Noterdaeme et al. (2012a) Noterdaeme, P., et al. 2012a, A&A, 540, A63
- Noterdaeme et al. (2012b) Noterdaeme, P., et al. 2012b, A&A, 547, L1
- Pérez-Ràfols et al. (2018) Pérez-Ràfols, I., Miralda-Escudé, J., Arinyo-i-Prats, A., Font-Ribera, A., & Mas-Ribas, L. 2018, MNRAS, 480, 4702
- Péroux et al. (2013) Péroux, C., Bouché, N., Kulkarni, V. P., & York, D. G. 2013, MNRAS, 436, 2650
- Péroux et al. (2011a) Péroux, C., Bouché, N., Kulkarni, V. P., York, D. G., & Vladilo, G. 2011a, MNRAS, 410, 2237
- Péroux et al. (2011b) Péroux, C., Bouché, N., Kulkarni, V. P., York, D. G., & Vladilo, G. 2011b, MNRAS, 410, 2251
- Péroux et al. (2016) Péroux, C., et al. 2016, MNRAS, 457, 903
- Péroux et al. (2017) Péroux, C., et al. 2017, MNRAS, 464, 2053
- Plummer (1911) Plummer, H. C. 1911, MNRAS, 71, 460
- Pontzen et al. (2008) Pontzen, A., et al. 2008, MNRAS, 390, 1349
- Posti et al. (2014) Posti, L., Nipoti, C., Stiavelli, M., & Ciotti, L. 2014, MNRAS, 440, 610
- Prochaska et al. (2008) Prochaska, J. X., Chen, H.-W., Wolfe, A. M., Dessauges-Zavadsky, M., & Bloom, J. S. 2008, ApJ, 672, 59
- Prochaska et al. (2003) Prochaska, J. X., Gawiser, E., Wolfe, A. M., Castro, S., & Djorgovski, S. G. 2003, ApJ, 595, L9
- Prochaska & Wolfe (1997) Prochaska, J. X., & Wolfe, A. M. 1997, ApJ, 487, 73
- Rafelski et al. (2014) Rafelski, M., Neeleman, M., Fumagalli, M., Wolfe, A. M., & Prochaska, J. X. 2014, ApJ, 782, L29
- Rahmani et al. (2018) Rahmani, H., et al. 2018, MNRAS, 480, 5046
- Rahmati & Schaye (2014) Rahmati, A., & Schaye, J. 2014, MNRAS, 438, 529
- Rhodin et al. (2018) Rhodin, N. H. P., Christensen, L., Møller, P., Zafar, T., & Fynbo, J. P. U. 2018, A&A, 618, A129
- Rudie et al. (2017) Rudie, G. C., Newman, A. B., & Murphy, M. T. 2017, ApJ, 843, 98
- Sánchez-Ramírez et al. (2016) Sánchez-Ramírez, R., et al. 2016, MNRAS, 456, 4488
- Som et al. (2015) Som, D., Kulkarni, V. P., Meiring, J., York, D. G., Péroux, C., Lauroesch, J. T., Aller, M. C., & Khare, P. 2015, ApJ, 806, 25
- Srianand et al. (2016) Srianand, R., Hussain, T., Noterdaeme, P., Petitjean, P., Krühler, T., Japelj, J., Pâris, I., & Kashikawa, N. 2016, MNRAS, 460, 634
- Srianand et al. (2008) Srianand, R., Noterdaeme, P., Ledoux, C., & Petitjean, P. 2008, A&A, 482, L39
- Tremonti et al. (2004) Tremonti, C. A., et al. 2004, ApJ, 613, 898
- Weatherley et al. (2005) Weatherley, S. J., Warren, S. J., Møller, P., Fall, S. M., Fynbo, J. U., & Croom, S. M. 2005, MNRAS, 358, 985
- Wojtak et al. (2009) Wojtak, R., Łokas, E. L., Mamon, G. A., & Gottlöber, S. 2009, MNRAS, 399, 812
- Wolfe et al. (2005) Wolfe, A. M., Gawiser, E., & Prochaska, J. X. 2005, ARA&A, 43, 861
- Wolfe & Prochaska (1998) Wolfe, A. M., & Prochaska, J. X. 1998, ApJ, 494, L15
- Wolfe et al. (1986) Wolfe, A. M., Turnshek, D. A., Smith, H. E., & Cohen, R. D. 1986, ApJS, 61, 249
- Zafar et al. (2017) Zafar, T., Møller, P., Péroux, C., Quiret, S., Fynbo, J. P. U., Ledoux, C., & Deharveng, J.-M. 2017, MNRAS, 465, 1613
- Zafar et al. (2013) Zafar, T., Péroux, C., Popping, A., Milliard, B., Deharveng, J.-M., & Frank, S. 2013, A&A, 556, A141
- Zhao et al. (2009) Zhao, D. H., Jing, Y. P., Mo, H. J., & Börner, G. 2009, ApJ, 707, 354