Quantifying information loss on chaotic attractors through recurrence networks
Abstract
We propose an entropy measure for the analysis of chaotic attractors through recurrence networks which are un-weighted and un-directed complex networks constructed from time series of dynamical systems using specific criteria. We show that the proposed measure converges to a constant value with increase in the number of data points on the attractor (or the number of nodes on the network) and the embedding dimension used for the construction of the network, and clearly distinguishes between the recurrence network from chaotic time series and white noise. Since the measure is characteristic to the network topology, it can be used to quantify the information loss associated with the structural change of a chaotic attractor in terms of the difference in the link density of the corresponding recurrence networks. We also indicate some practical applications of the proposed measure in the recurrence analysis of chaotic attractors as well as the relevance of the proposed measure in the context of the general theory of complex networks.
keywords:
Recurrence Networks , Network Entropy , Chaotic Attractors1 Introduction
Chaotic dynamical systems are those whose evolution causes exponential divergence of nearby trajectories [1]. This, in turn, leads to a loss of information during the evolution of the system which is quantified using an entropy measure called Kolmogorov-Sinai entropy [2] or K-S entropy. In the case of chaotic attractors generated from time series, a related measure called correlation entropy [3] denoted by is used for this purpose.
In the case of a fully developed chaotic attractor, there can also be a loss of information as a result of a structural change on the attractor [4], which is clearly different from the information loss arising out of the dynamical evolution of the system mentioned above. An obvious example is the effect of contamination by noise which changes the structure of the attractor. To quantify such an information loss, we require tools that can capture the structural changes on the attractor. One such tool is the characterization of the attractor through a complex network, which has gained increasing importance over the past one decade [5, 6, 7, 8]. In this approach, the chaotic attractor is first transformed into a complex network using some suitable method. The resulting complex network, which is characteristic to the structure of the attractor, is then analysed using standard network measures [9, 10, 11]. This approach has, over the years, become a mature field with several new methods and ideas emerging, especially regarding the characterization of attractors re-constructed from time series.
In this work, we concentrate on a key measure, namely entropy, and show its effectiveness in quantifying structural information loss on chaotic attractors using measures of recurrence networks. In fact, network entropy has been proposed by various authors [12, 13, 14, 15] in different contexts in the literature, whose details are given in the next section. However, none of them have addressed the specific issue of information loss on a chaotic attractor through network measures. Here, we show that network based analysis is useful to quantify information loss associated with the change in the structure of chaotic attractors. For this, we propose a new entropy measure suitable for the analysis of recurrence networks by modifying the basic equation for network entropy already existing in the literature. We also comment on some practical aspects of the proposed measure and its relevance in the context of the theory of complex networks.
Our paper is organized as follows: A brief review of the existing network entropy measures is given in the next section where we also present the details of the entropy measure that we propose in this work with specific emphasis to quantify the information loss on chaotic attractors due to structural changes. The complex network that we construct from the time series is called the recurrence network, since the specific property of recurrence [16] of dynamics is used for its construction. The details of this construction procedure are presented in §3, where we apply the proposed entropy measure for the analysis of recurrence networks from chaotic attractors. In §4, we show how the proposed measure can be used to quantify the information loss on chaotic attractors in terms of the changes in the link density of the corresponding recurrence networks. In §5, we show that the measure proposed here is useful in the analysis of real world data as well. The paper is concluded in §6.
2 Entropy measure for complex networks
Entropy is a key concept originating from statistical thermodynamics [17] and effectively used in information theory [18] and in the theory of dynamical systems [19]. In the realm of complex networks, entropy has been defined in different contexts, to measure the robustness and stability of a network [13], as a measure of complexity [12, 15] and to predict the most probable network under the given constraints using the maximum entropy principle [14]. There are competing notions of graph entropy measures applied in such diverse fields as computer science, information theory, sociology, chemistry and biology. What may be useful in one domain may not be in another. For example, graph entropy has been used to characterize the structure of graph based systems in mathematical chemistry [20], where it serves as a complexity measure. Details regarding the history of graph entropy measures can be found in the review by Dehmer and Mowshowitz [21].
In this work, we consider an entropy measure very close to the structural entropy of network ensembles as given by Karthik and Bianconi [22]. The authors, however, use a statistical mechanical approach where entropy of a network ensemble is proportional to number of networks in the ensemble. By defining free energy on the ensemble, they show that scale free degree distributions have small value of structural entropy while Poisson degree distributions are more likely with large structural entropy.
Here we define an entropy measure in terms of the uncertainty in information content on a complex network with links as channels of information transfer between the nodes. Note that the term information is used here in a general sense depending on what system or process the complex network represents. Consider an un-weighted and un-directed complex network of any topology of nodes and let the node has degree , where , with no isolated node present in the network. Note that is an index representing the node number here and many nodes can share the same value of degree. We now define the probability of information transfer through the node as:
| (1) |
since the node is connected to only other nodes out of a maximum possible nodes.
We now introduce a new measure analogous to the structural entropy of network as:
| (2) |
Note that the first term in the above equation is the Shannon entropy of degree distribution which has been discussed in various contexts [23]. The novelty here is to add the second term and it implies that the measure is decided not only by the presence of link between two nodes, but also by its absence denoted by the remaining degree [24]. We show below that the proposed measure can characterize the uncertainty of information associated with the structural changes of a complex network. Hence we call it the entropy measure of a network.
If all , then there is no information transfer and . If all the nodes are mutually connected, that is, , then the information content becomes saturated and no new information can be generated from the network (or the function of the network disappears) and . Suppose we now consider any regular or homogeneous network with all less than , then we can show that
| (3) |
where . Note that the superscript in the above equation is used to denote homogeneous networks. Thus, for an un-weighted and un-directed complex network of nodes with all , first increases as increases from zero, becomes a maximum and decreases to zero again as . In other words, varies as a one-hump function with .
We now represent the above equation for in terms of the link density of the network. Any complex network, in general, has a range of values for , from to . The total number of links in the network is given by:
| (4) |
since a link is shared by two nodes. If we assume a homogeneous version of this network (with fixed), the degree of each node is:
| (5) |
Therefore we get the probability associated with each node is:
| (6) |
where is the link density of the network. From above, the entropy measure of this network is given by:
| (7) |
As and , the entropy measure tends to zero. In between, at an optimum value of , becomes maximum.
Note that, we have an ensemble of networks with fixed (for any ) and each element of this ensemble has a different degree distribution and different value of . Out of this ensemble, there is one element (since all nodes are equivalent) which is homogeneous having the maximum value of entropy measure, . Entropy of all other elements is less than that of the homogeneous network: . This also implies that the entropy measure proposed here is minimum for the completely heterogeneous network [25], with each value different from one another: . Thus, for an ensemble of networks with given and , increases from a minimum value to a maximum value .
The above result can be understood from an information content point of view as follows: Entropy is a measure of uncertainty in a system or process and hence can be considered as a measure of uncertainty in information content associated with a network. When the network characterizing a system or process becomes completely homogeneous, the information loss is maximum, equal to and vice versa. In other words, can be taken as a measure of the information to be generated for transforming a homogeneous network to any other complex network of arbitrary degree distribution of the same link density . It should be noted that this result is independent of due to the normalization of the measure with respect to .
We now try to quantify the above information loss in terms of the link density by relaxing the condition for constant . This implies changes in the entropy measure due to a change in the number of links in the network rather than their re-distribution between the nodes. We have shown that the variation of for homogeneous networks as a function of has the form of a one-hump curve. So there is an optimum value, say , at which is maximum. This value of can be obtained by using the condition:
| (8) |
Using Eq. (7) and simplifying, we get . Putting this back in Eq. (7), the maximum value of entropy for any homogeneous network is . Also, there are two values of that lead to the same value of , since its value remains unchanged by replacing by in the defining equation. In other words, one can find a complementary network leading to the same value of . We now show that the above results can be used for quantifying information loss on chaotic attractors through RNs, whose details are given in the next section.
3 Recurrence networks and entropy measure
The first step in the network based approach is to transform the time series to a complex network. Several schemes [26, 27, 28] have been proposed for this over the last two decades and each one is useful in particular contexts of application. Here we use a specific scheme based on the property of recurrence of every dynamical system. The resulting network, called the recurrence network (RN) [29, 30], captures the structure of the embedded attractor. The method of RN is useful for the analysis of both synthetic and real world data and has found numerous applications from identifying dynamical transitions [31] and extreme events [32] to detecting epileptic states in biomedical time series [33] and has opened up a new window in the pursuit of complexity in real world systems, such as, climate data analysis [34, 35].
To transform the time series into a RN, it is first embedded in a multi-variate state space of dimension using the time delay co-ordinates [36]. Every point on the reconstructed attractor is then identified as a node and a recurrence threshold () is set to define the connection between two nodes. Two nodes are considered to be connected if the corresponding points on the attractor are within the limit of this threshold. From the construction, it is clear that the RN is an un-weighted and un-directed network with the elements of the adjacency matrix either or depending on whether two nodes are connected or not.
The choice of the parameter is crucial for the construction of the RN to ensure that the resulting network is a proper representation of the embedded attractor. We have recently proposed a scheme [37] for the construction of RN where the value of is automated for a given embedding dimension . Here the time series is first transformed into a uniform deviate so that the size of the embedded attractor is rescaled into a unit -cube. A critical range of threshold is selected for the construction of the network whose minimum is chosen with the standard condition that there exists a single giant component in the resulting RN. We have shown that [37] this critical range is approximately identical for several chaotic systems and white noise and depends only on the embedding dimension . The threshold values used here for the construction of the network are , , and for varying from to respectively. The scheme has been effectively employed to study the influence of noise on the structure of chaotic attractors [38] and for the analysis of light curves from a prominent black hole system [39]. Here we use this scheme for the construction of RN from time series.
All the results presented in §2 are true for RNs as well, as they are un-weighted and un-directed complex networks. We first show that the proposed entropy measure is a characteristic property of every chaotic attractor, independent of the parameters used for the construction of the network. For this, we construct RNs from time series of several standard chaotic attractors and white noise using the scheme mentioned above [37]. The RNs are constructed for differerent fixed values of by changing the embedding dimension and vice versa.
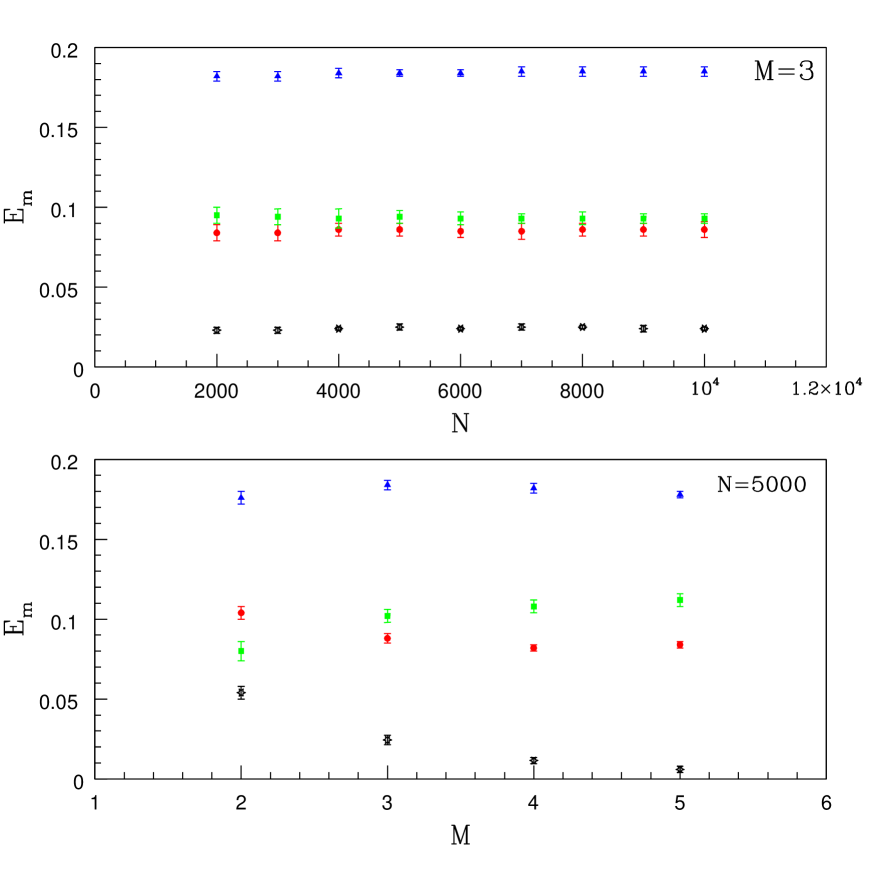
The variation of for RNs from three standard chaotic attractors and white noise as a function of and are shown in Fig. 1. While the values saturate for all the chaotic attractors with respect to both and , it shows a decreasing trend for white noise as a function of (bottom panel). The calculations are repeated for different time series in each case and the average values are shown in the figure with the standard deviation as the error bar. It is clear that the proposed measure is a characteristic property of every chaotic attractor independent of both and .
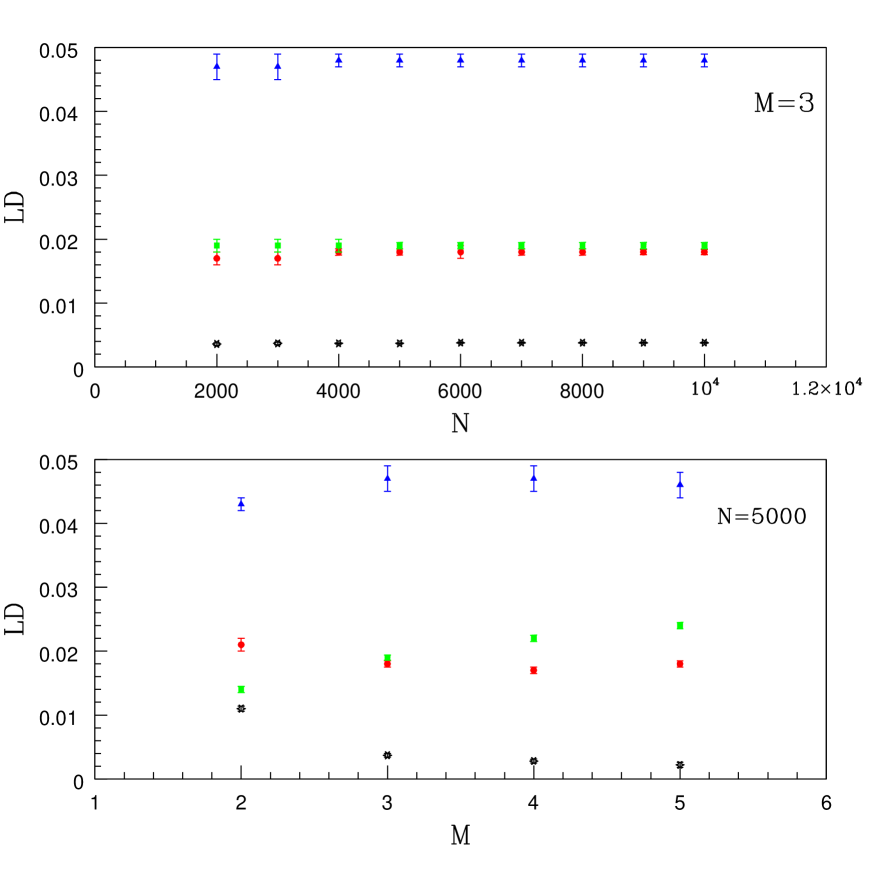
Since the proposed measure is closely related to the link density of the network as shown in the previous section, we also check how the link density (LD) varies with and . These results are shown in Fig. 2, where variation in link density is shown with and for the same networks used in the previous figure. It is evident that the behaviour is identical to that of . Also, the values of the LD for a given and are widely different between Henon, Lorenz and white noise. This is due to the difference in the structure of the RN which, in turn, depends on the structure of the embedded attractor. This implies that one has to be careful in choosing a specific value of LD commonly for all systems as a criterion for selecting the recurrence threshold for constructing the network.
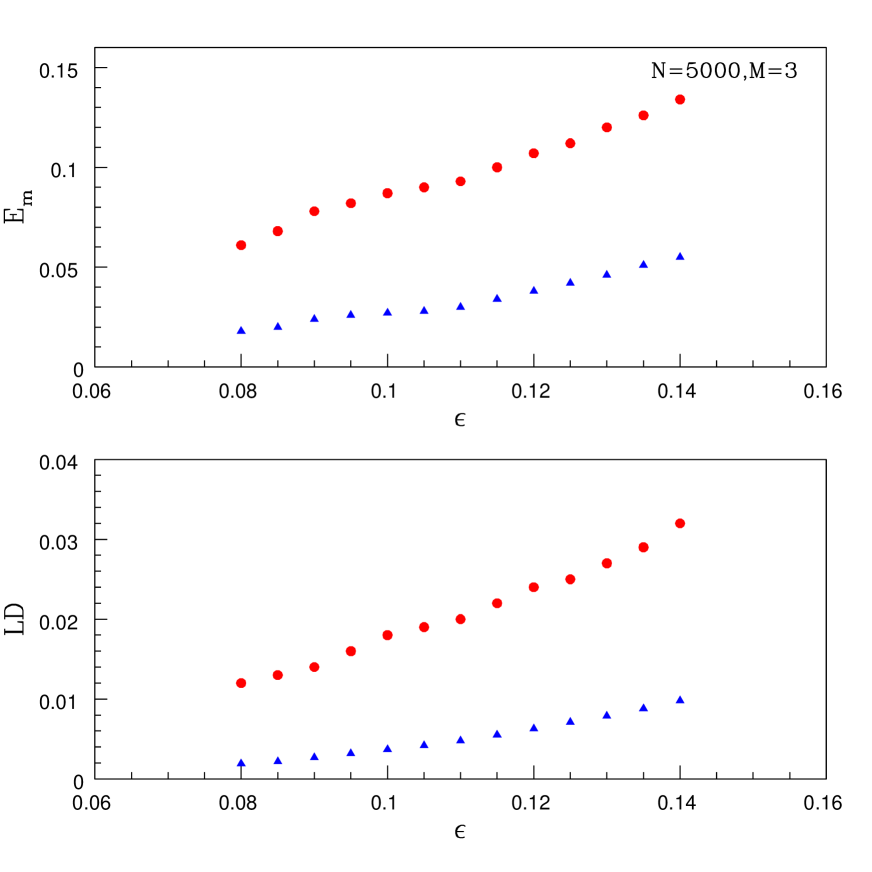
Here we have used a specific scheme for the choice of the recurrence threshold and the construction of the RN from time series which is based on our previous results. As is well known, there is no standard procedure for the choice of and there are, in fact, several suggestions for choosing it in the literature pertaining to different contexts and applications. A more detailed discussion regarding this can be found in the very recent review by Zou et al. [23]. Hence it is important to know how the measure proposed here is affected by small changes in . This is shown in Fig. 3 (top panel). Here we show the variation of with for the RNs constructed from Lorenz attractor time series and white noise. In the bottom panel of the same figure, we show the corresponding variation in LD with . As increases, it is natural that the LD increases due to increase in connections. This change is also reflected in . However, around the threshold value used for the construction of the networks, this change is comparatively small in both cases vindicating our choice of .
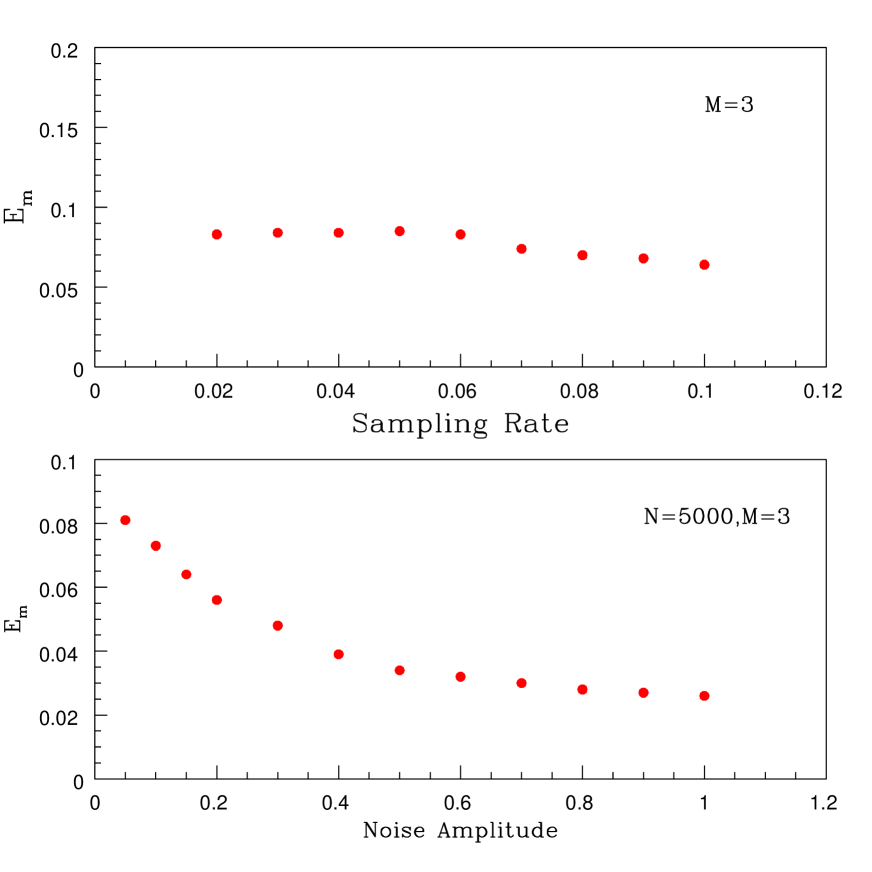
It is also important to check the dependence of on other parameters involved in the construction of RN. We have already shown in Fig. 1 that the measure is stable with respect to changes in and as per our scheme. We now check the dependence of on the sampling rate for the generation of chaotic time series. This shown in Fig. 4 (top panel). We show the results for the variation of for the Lorenz attractor generated with sampling rates increasing from to . The total time of evolution in each case is fixed as seconds (increasing the length of time series as sampling rate decreases) to ensure there are enough trajectory points on the attractor. The values of are approximately constant for the first few sampling rates, but decreases as . This is an indication that as becomes large, the attractor gets slightly over sampled and the finer details of the Lorenz attractor is lost. We have used in our computations in this work.
Finally, in the analysis of real world data, noise contamination is always present. We now check how is affected by additive noise in a time series. A more detailed discussion on this is given in §4. We construct RNs from Lorenz attractor time series by adding different percentages of white noise from to . Results of computation of for these RNs are also shown in Fig. 4 (bottom panel). It is clear that as the noise amplitude increases, there is a systematic decrease in the value of .
4 Entropy measure and information loss
Let us now consider the RN constructed from a typical chaotic attractor for a fixed . The topology and the structure of the network will be characteristic to that of the attractor [38], with a range of values for , a characteristic degree distribution and an entropy measure denoted by . Imagine an ensemble of networks with the same link density of which the RN is just one element.
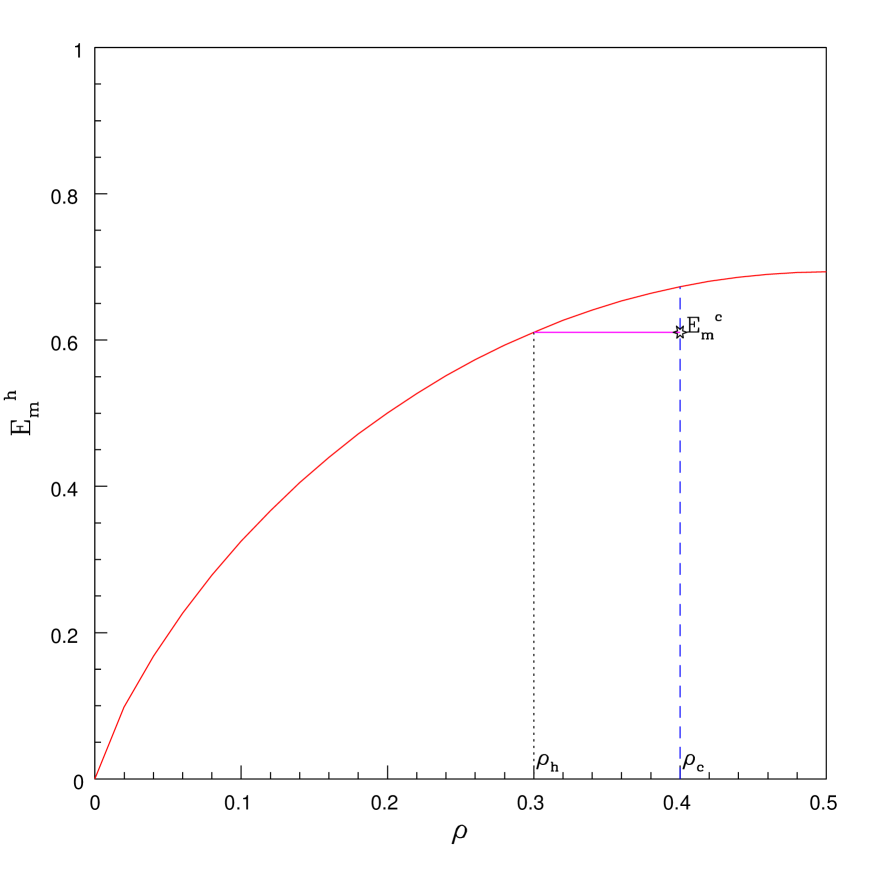
From our discussion in §2, the element of this ensemble with the maximum entropy is the homogeneous network. In Fig. 5, we show the variation of as varies from to . The vertical dashed line in the figure represents the ensemble of networks with a fixed link density as that of the RN. The element corresponding to the point where the dashed line meets the curve is the homogeneous network with the maximum entropy for the fixed value of . The point, represented by asterisk on the dashed line, corresponds to the RN from the attractor with the entropy measure denoted by . Obviously, any RN can be obtained starting from a homogeneous network of same number of nodes and by re-distributing the links (without changing the link density). By doing this, the entropy measure drops from to . In other words, we can consider as a measure of the information loss when a RN gets transformed into a homogeneous network of same . Since is a characteristic property of the attractor, should also be characteristic to the attractor.
The value of also indicates how much the structure of a given network differs from a corresponding homogeneous network for a given link density. For example, the value of of the RN from white noise is found to be much less compared to that of the RN from a chaotic attractor. However, the value of , which depends on the link density, is also very small for the homogeneous network corresponding to white noise making its smaller compared to that of the RN from any chaotic attractor.
| System | ||||
|---|---|---|---|---|
| Lorenz | 0.0034 | 0.0184 | 0.0162 | 0.0022 |
| Rössler | 0.0018 | 0.0210 | 0.0194 | 0.0016 |
| Henon | 0.0037 | 0.0448 | 0.0421 | 0.0027 |
| White Noise | 0.0004 | 0.0037 | 0.0036 | 0.0001 |
We now try to represent the above information loss in terms of the link density, since it is a directly measurable parameter for any complex network. For this, again consider Fig. 5. There is a homogeneous network with the same value of entropy as that of the RN as indicated by the horizontal solid line. This homogeneous network has a reduced link density denoted by the vertical dotted line. Suppose the given RN is transformed into a homogeneous network with the reduced link density . Then, from the figure, its entropy remains unchanged at . In other words, the loss of information can now be obtained in terms of a measurable change of two homogeneous networks, which varies directly with the corresponding change in entropy . In Table I, we show the values of and for the RNs from some standard chaotic attractors and white noise. Note that, the RN from white noise is very close to a homogeneous network with the degree of each node centered around an average value and hence both and . Interestingly, the link density and the value of are slightly higher for the RN from the Rössler attractor compared to that of the Lorenz attractor. However, and are higher for the latter, indicating that its RN is more different from a homogeneous network compared to that of Rössler. It is thus clear that the proposed measure is suitable for characterizing the structural changes of a chaotic attractor.
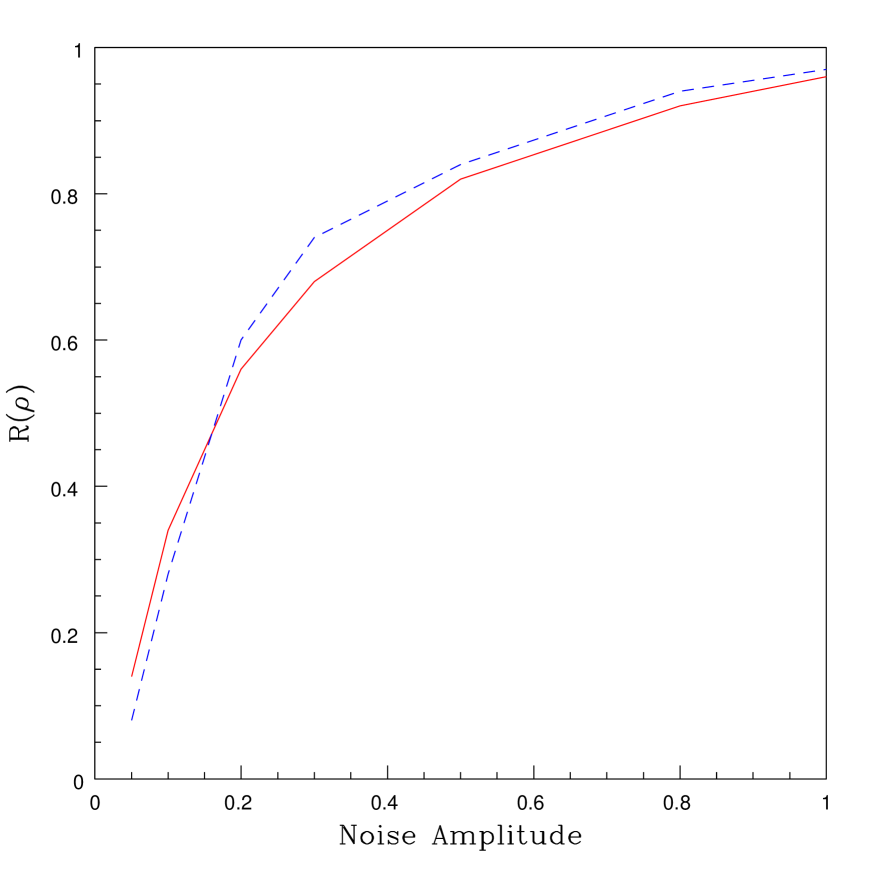
We now consider one such example of structural loss for a chaotic attractor, namely, due to contamination by noise. We have already shown [38] that when noise is added to a chaotic time series, the range of values in the constructed RN gets depleted. When the percentage of noise is sufficiently high, the structure of the attractor and hence the corresponding RN tends to that from a white noise. The noise affects the highly clustered nodes in the RN. As a consequence, the degree of each node tends to be approximately identical to some average value , reducing the link density, and consequently the value of . As the noise level increases, the difference in the value of with respect to that of the original RN (that is, ) also increases correspondingly. Since is characteristic to the attractor, the variation in the ratio , which we denote by , with noise level can serve as a quantifier to study how the structure of the attractor is affected by noise. Here the denominator is a constant for a given attractor, with representing the link density of the RN from a pure white noise. In the absence of noise, and . As the network becomes identical to the RN from white noise, and . In Fig. 6, we plot the variation of for the RNs from two standard chaotic attractors as a function of noise amplitude. Note that, though the structure of the two attractors are very different, the variation of is approximately identical.
5 Analysis of real world data
In this section we consider whether the proposed measure is suitable for the analysis of real world data. To show this, we analyse light curves from a variable star. We choose a sample light curve, namely KIC 4484128, from the group of RRLyrae stars in Kepler archive where nonlinear behavior is reported in previous analysis [40, 41]. Continuous data segment without gaps sampled at days involving data points is generated and more details regarding the data can be found elsewhere [41].
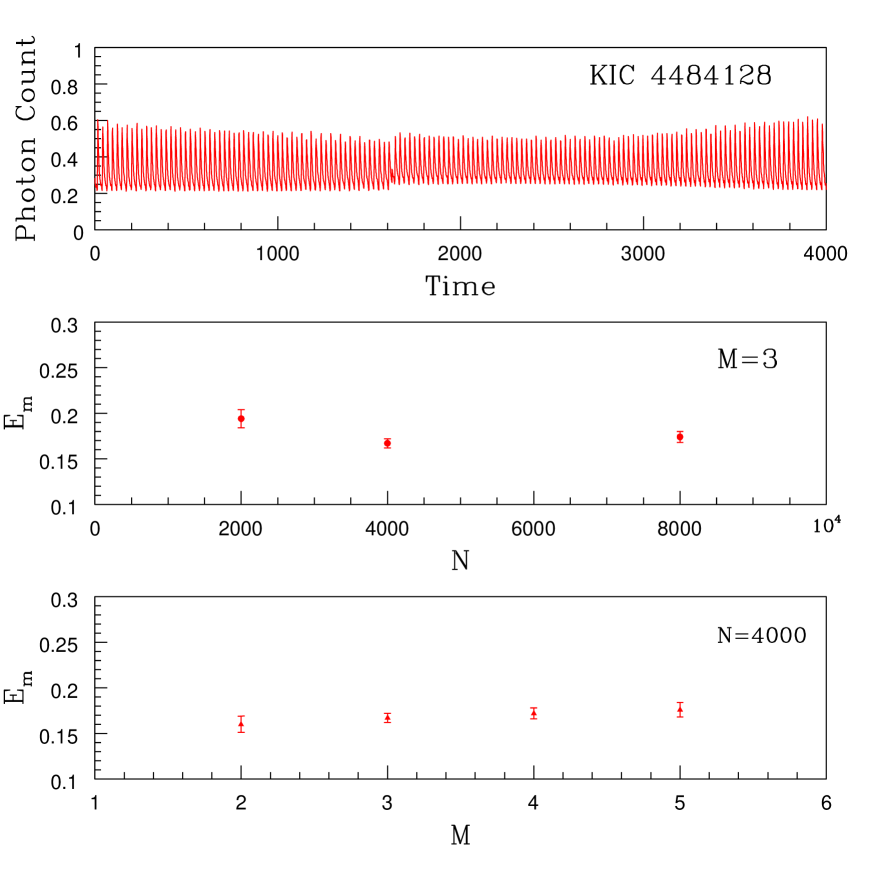
For the present analysis, this full data is divided into different segments of varying lengths, of data points (16 segments), data points (8 segments) and data points (4 segments). A typical segment is shown in Fig. 7 (top panel). RNs are constructed from each segment using our scheme and computed in each case. The results are shown in Fig. 7 (middle panel) for varying with fixed as 3 and vice versa in Fig. 7 (bottom panel) with fixed at . It is found that remains constant in both cases making it a robust measure useful for experimental time series. Moreover, we have also checked the and values for this data and find the average values of both as and for and , which is again an indication of inherent nonlinearity in the data. This, in turn, rules out pure stochastic process in the temporal variability of the light curve, as suspected earlier.
Another possible practical application of the proposed measure in this context is the following: There are large number of variable stars in the Kepler Archive which have been classified from an astrophysical point of view based on their intensity and spectral variations. It is also possible to classify them from a dynamical perspective and noise content for a better understanding of their temporal variability. The measure proposed here seems to be suitable for this as it can capture subtle variations in the light curve as reflected in the RN. These measures are reliable even with a short time series of a few thousand data points as in the case of variable stars where long time series is difficult to get due to various practical difficulties of observation.
6 Conclusion
Nonlinear time series analysis using complex network measures has become an important area of research over the last two decades. One method of constructing the network, based on the property of recurrence, has become very popular due to the large number of practical applications of the resulting RN. Eventhough several measures have been used for the recurrence network analysis of chaotic time series, the use of entropy has been limited in all the previous analysis. Specifically, none of them have addressed the issue of information loss on a chaotic attractor through network measures.
In this work, we propose an entropy measure for the recurrence network based analysis of chaotic time series. We show that the measure can uniquely characterize the structural information loss of a chaotic attractor in terms of the changes in the link density of the RN constructed from the attractor. We also indicate how the measure can be useful in practice in identifying the loss of information on the structure of a chaotic attractor due to noise contamination.
Another possible practical application of the proposed measure is to use it as a discriminating measure in the analysis of real data by looking at how much the network constructed from the data is different from a homogeneous network. Also, the method has specific advantage that the finiteness of the data will not affect the accuracy of the analysis since the measure is independent of , unlike the dimension measures used for similar studies previously [2]. The time series measured or observed from a real world system or process can vary based on several factors, such as, inherent dynamical changes, parametric instability, the amount and nature of noise added, etc. One important application of nonlinear time series analysis is to discriminate the data by identifying the subtle changes using measures of nonlinear dynamics. We hope the proposed measure will also be useful in this regard.
Finally, though our focus in this work is the information loss on chaotic attractors through RNs, the measure proposed here could also be useful in many other contexts in the formal theory of complex networks. One possible application which we indicate here is the study of diffusion process on complex networks [42]. In this context, the entropy represents the minimum amount of information necessary to describe the diffusion on the network and is sensitive to the network topology. A high entropy indicates a large randomness and easiness of propogation from one node to another. Thus, maximizing entropy rate allows us to extract optimal diffusion process providing tools for design of network structure with a wide range of practical applications.
Acknowledgments
KPH acknowledges the computing facilities in IUCAA, Pune.
References
- [1] J. C. Sprott, Chaos and Time Series Analysis (Oxford University Press, Oxford, 2003)
- [2] R. C. Hilborn, Chaos and Nonlinear Dynamics, (Oxford University Press, Oxford, 1994).
- [3] M. B. Kennel and S. Isabelle, Method to distinguish possible chaos from colored noise, Phys. Rev. A 46, 3111 (1992).
- [4] H. D. I. Abarbanel, Analysis of observed chaotic data, (Springer, New York, 1996).
- [5] L. Lacasa, B. Luque, F. Ballesteris, J. Luque and J. C. Nuno, From time series to complex networks: the visibility graph, Proc. Natl. Acad. Sci. USA 105, 4972 (2008)
- [6] N. Marwan, J. F. Donges, Y. Zou, R. V. Donner and J. Kurths, Complex network approach for recurrence analysis of time series, Phys. Lett. A 373, 4246 (2009)
- [7] Y. Yang and H. Yang, Complex network based time series analysis, Physica A 387, 1381 (2008)
- [8] R. V. Donner, Y. Zou, J. F. Donges, N. Marwan and J. Kurths, Recurrence networks: A novel paradigm for nonlinear time series analysis, New J. Phys. 12, 033025 (2010)
- [9] S. H. Strogatz, Exploring complex networks, Nature 410, 268 (2001)
- [10] M. E. J. Newman, The structure and function of complex networks, SIAM Rev. 45, 167 (2003)
- [11] B. Barzel and A. L. Barabasi, Universality in network dynamics, Nature Phys. 9, 673 (2013)
- [12] C.Bandt and B. Pompe, Permutation entropy: A natural complexity measure for time series analysis, Phys. Rev. Lett. 88, 174102 (2002)
- [13] L. Demetrius and T. Manke, Robustness and network evolution - an entropic principle, Physica A 346, 682 (2005)
- [14] M. H. Safar, I. Y. Sorkhoh, H. M. Farahat and K. A. Mahdi, On maximizing the entropy of complexnetworks, Procedia Comp. Sci. 5, 480 (2011)
- [15] G. Bianconi, Entropy of network ensembles, Phys. Rev. E 79, 036114 (2009)
- [16] J. P. Eckmann, S. O. Kamphorst and D. Ruelle, Recurrence plot of dynamical systems, Europhys Letters 5, 973 (1987)
- [17] R. Balian, From Microphysics to Macrophysics, (Springer, New York, 1991)
- [18] T. M. Cover and J. A. Thomas, Elements of Information Theory, (Wiley, New York, 1991)
- [19] C. Beck and F. Schlogl, Thermodynamics of chaotic systems, (Cambridge University Press, Cambridge, 1993)
- [20] D. Bonchev, Information theoretic indices for characterization of chemical structures, (Research Studies Press, Chichester, 1983)
- [21] M. Dehmer and A. Mowshowitz, A history of graph entropy measures, Information Sciences 181, 57 (2011)
- [22] K. Anand and G. Bianconi, Entropy measures for networks: Toward an information theory of complex topologies, Phys. Rev. E 80, 045102(R) (2009)
- [23] Y. Zou, R. V.Donner, N. Marwan, J. F. Donges and J. Kurths, Complex network approaches to nonlinear time series analysis, Phys. Reports 787, 1-97 (2019)
- [24] R. Sole and S. Volverde, Information theory of complex networks: On evolution and architectural constraints, Complex Networks 650, 189 (2004)
- [25] Rinku Jacob, K. P. Harikrishnan, R. Misra and G. Ambika, Measure for degree heterogeneity in complex networks and its application to recurrence network analysis, Royal Soc. Open Sci. 4, 160757 (2017)
- [26] J. Zhang and M. Small, Complex networks from pseudoperiodic time series: topology versus dynamics, Phys. Rev. Lett. 96, 238701 (2006)
- [27] X. Xu, J. Zhang and M. Small, Super family phenomena and motifs of networks induced from time series, Proc. Natl. Acad. Sci. USA 105, 19601 (2008)
- [28] Z. Gao and N. Jin, Complex networks from time series based on phase space reconstruction, Chaos 19, 033137 (2009)
- [29] R. V. Donner, M. Small, J. F. Donges, N. Marwan, Y. Zou, R. Xiang and J. Kurths, Recurrence based time series analysis by means of complex network methods, Int. J. Bif. Chaos 21, 1019 (2011)
- [30] R. V. Donner, J. Heitzig, J. F. Donges, Y. Zou, N. Marwan and J. Kurths, The geometry of chaotic dynamics-A complex network perspective, European Phys. J. B 84, 653 (2011)
- [31] J. F. Donges, R. V. Donner, K. Rehfeld, N. Marwan, M. H. Trauth and J. Kurths, Identification of dynamical transitions in marine palaeoclimate records by recurrence network analysis, Nonlinear Proc. Geophys. 18, 545 (2011)
- [32] N. Marwan and J. Kurths, Complex network based techniques to identify extreme events and (sudden) transitions in spatio-temporal systems, Chaos 25, 097609 (2015)
- [33] N. Marwan, N. Wessel, U. Meyerfeldt, A. Schirdewan and J. Kurths, Recurrence plot measures of complexity and its application to heart rate variability data, Phys. Rev. E 66, 026702 (2002)
- [34] N. Marwan, M. H. Trauth, M. Vuille and J. Kurths, Comparing modern and Pleistocene ENSO-like influences in NW Argentina using nonlinear time series analysis, Clim. Dynamics 21, 317 (2003)
- [35] N. Boers, B. Bookhagen, H. M. J. Barbosa, N. Marwan, J. Kurths and J. Marengo, Prediction of extreme floods in the eastern Central Andes based on complex network approach, Nature Comm. 5, 5199 (2014)
- [36] P. Grassberger and I. Procaccia, Measuring the strangeness of strange attractors, Physica D 9, 189 (1983)
- [37] Rinku Jacob, K. P. Harikrishnan, R. Misra and G. Ambika, Uniform framework for the recurrence-network analysis of chaotic time series, Phys. Rev. E 93, 012202 (2016)
- [38] Rinku Jacob, K. P. Harikrishnan, R. Misra and G. Ambika, Characterization of chaotic attractors under noise: A recurrence network perspective, Commun. Nonlinear Sci. Numer. Simulat. 41, 32 (2016)
- [39] Rinku Jacob, K. P. Harikrishnan, R. Misra and G. Ambika, Recurrence network measures for hypothesis testing using surrogate data: Application to black hole light curves, Commun. Nonlinear Sci. Numer. Simulat. 54, 84(2018)
- [40] J. F. Lindner, V. Kohar, B. Kia, M. Hippke, J. G.Learned and W. L.Ditto, Strange nonchaotic stars, Phys. Rev. Lett. 114, 054101 (2015)
- [41] S. V. George, G. Ambika and R. Misra, Detecting dynamical states from noisy time series using bicoherence, Nonlinear Dyn. 89, 465 (2017)
- [42] J. Gomez-Gardenes and V. Latora, Entropy rate of diffusion processes on complex networks, Phys. Rev. E 78, 065102(R) (2008)