Complicated Table Structure Recognition
Abstract
The task of table structure recognition aims to recognize the internal structure of a table, which is a key step to make machines understand tables. Currently, there are lots of studies on this task for different file formats such as ASCII text and HTML. It also attracts lots of attention to recognize the table structures in PDF files. However, it is hard for the existing methods to accurately recognize the structure of complicated tables in PDF files. The complicated tables contain spanning cells which occupy at least two columns or rows. To address the issue, we propose a novel graph neural network for recognizing the table structure in PDF files, named GraphTSR. Specifically, it takes table cells as input, and then recognizes the table structures by predicting relations among cells. Moreover, to evaluate the task better, we construct a large-scale table structure recognition dataset from scientific papers, named SciTSR, which contains 15,000 tables from PDF files and their corresponding structure labels. Extensive experiments demonstrate that our proposed model is highly effective for complicated tables and outperforms state-of-the-art baselines over a benchmark dataset and our new constructed dataset.111https://github.com/Academic-Hammer/SciTSR
1 Introduction
The task of table structure recognition is to recognize the internal structure of a table, which is a key step to make machines understand tables. The recognized machine-understandable tables have many potential applications including question answering, dialogue systems and table-to-text Pasupat and Liang (2015); Jauhar et al. (2016); Li et al. (2016); Yan et al. (2016); Bao et al. (2018); Jain et al. (2018).
Currently, table structure recognition has been studied for many file formats such as ASCII text, HTML and image. As a popular and widely-used file format, PDF also attracts lots of attention, and many approaches have been proposed for PDF format. The existing approaches can be classified into two categories: rule-based methods Ramel et al. (2003); Yildiz et al. (2005); Hassan and Baumgartner (2007) and data-driven methods Schreiber et al. (2017); Li et al. (2019).
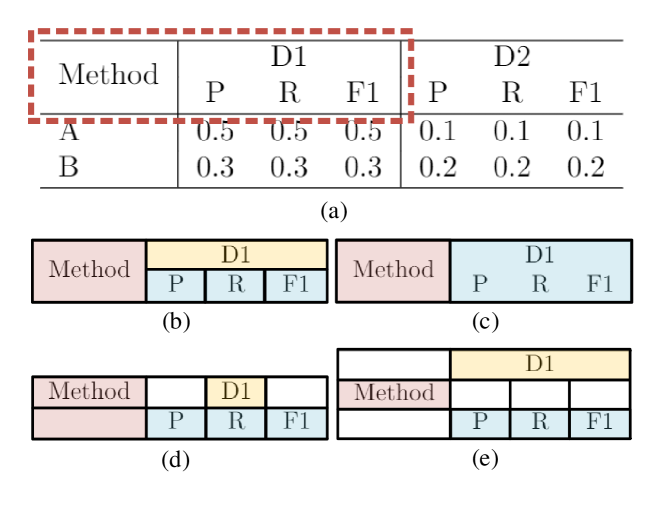
However, it is hard for the existing methods to accurately recognize the structure of complicated tables in PDF files. A spanning cell is a table cell that occupies at least two columns or rows. If a table contains spanning cells, it is called a complicated table. We provide an intuitive example of a complicated table in Figure 1 , and we show a table in a PDF file in Figure 1 (a). In Figure 1 (b), we show the real structure of the table area enclosed by the dashed box in Figure 1 (a). In Figure 1 (c) - (e), we present the recognized structure by existing methods, i.e., Adobe Arcobat SDK, DeepDeSRT Schreiber et al. (2017) and Tabby Shigarov et al. (2016). It can be observed that none of these existing methods provides a correct result in this case. Although the proportion of spanning cells is usually small in a complicated table, they contain more important semantic information than other cells, because they are more likely to be table headers in a table. The table header of a table is crucial to understand the table. Therefore, the recognition of complicated table structures is an important problem to be solved.
To address the aforementioned issue, we propose a novel graph neural network model that reformulates the task as a edge prediction problem on graphs. Specifically, it encodes a table by a stack of graph attention blocks, and then recognizes the table structure by predicting relations among cells. Additionally, because there is no available training data for this task, we construct a new large-scale dataset for table structure recognition in PDF files, in which tables are collected from scientific papers, denoted as SciTSR. It contains 15,000 tables and the corresponding structure labels. Over a benchmark and our SciTSR dataset, extensive experiments demonstrate that our proposed model outperforms state-of-the-art baselines greatly, especially in the case of complicated tables. Our contributions are two-fold:
-
•
We propose a novel graph neural network model to recognize the structure of tables in PDF files, especially complicated tables. Extensive experiments demonstrate that our proposed model outperforms state-of-the-art baselines greatly.
-
•
We construct a new large-scale table structure recognition dataset from scientific papers, which contains 15,000 tables and corresponding structure labels. To the best of our knowledge, this is the first large-scale dataset for table structure recognition in PDF files.
2 Related Work
In this section, we will introduce the related methods and datasets on the task of able structure recognition in PDF files.
2.1 Methods
Existing methods can be classified into two categories: rule-based methods and data-driven methods.
Rule-based methods
In 2003, Ramel et al. utilized ruling lines and arrangement of text components to recognize table structures from exchange format files Ramel et al. (2003). Later, Yildiz et al. proposed to recognize columns by computing horizontal overlaps of texts, by using the text blocks generated by pdftohtml222http://pdftohtml.sourceforge.net/ tool as input Yildiz et al. (2005). In 2007, Hassan and Baumgartner employed a similar idea to the work of Ramel et al. (2003) but extended it to PDF format. In 2009, Oro and Ruffolo proposed to recognize table structures by grouping basic content elements in a bottom-up way Oro and Ruffolo (2009). Unlike these methods that use “hard” rules, Shigarov et al. presented a “soft” rule-based method that can be adapted to different domains Shigarov et al. (2016).
Data-driven methods
As far as we know, there are two data-driven methods that leverage deep learning to solve this task. In 2017, Schreiber et al. first proposed a model called DeepDeSRT, which treats the table structure recognition task as an image semantic segmentation problem, and then recognizes the regions of columns and rows respectively Schreiber et al. (2017). In 2019, Li et al. proposed an image-to-text model, which is first trained to encode the table image and then decode the table structure as a HTML-like sequence of tags Li et al. (2019). Despite the tag sequence is designed to represent a table, it doesn’t provide column coordinates of cells. Thus, the tag sequence cannot be used to restore a table, which means their model is not a complete model for this task. So it cannot be used as a baseline in our experiments.
Overall, all these approaches only work well on simple grid-like tables but fail on the complicated tables with spanning cells. Therefore, we propose a novel graph neural network model to address this issue, and it will be introduced in section 3.
2.2 Datasets
There are two related datasets for table structure recognition. One is the ICDAR-2013 dataset from ICDAR 2013 Table Competition Göbel et al. (2013), which has only 156 tables in total. Although every PDF document is well labeled, the size of the dataset is too small to support data-driven models. Recently, Li et al. (2019) releases a large-scale dataset called TableBank for table detection and structure recognition. However, TableBank only provides tables in image format, and column coordinates information is missed in its structure labels. That means it cannot be used for this task. So we construct a new large-scale table structure recognition dataset from scientific papers for this task, which will be introduced in section 4.
3 Method
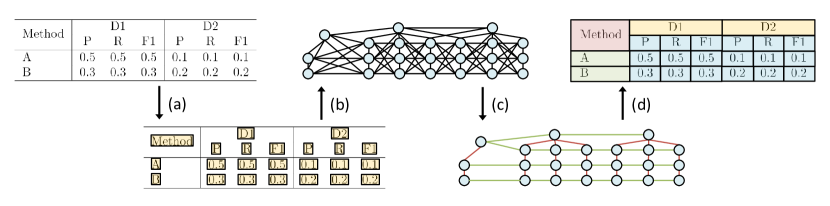
Figure 2 illustrates an overview of our method. Given a table in PDF format as input, our method recognizes its structure by the following four steps: (a) Pre-processing: obtaining cell contents and their corresponding bounding box from PDF; (b) Graph construction: building an undirected graph on these cells; (c) Relation prediction: predicting adjacent relations by our proposed GraphTSR; (d) Post-processing: recovering table structure from the labeled graph. We use the same pre-processing procedure as Shigarov et al. (2016), and employ a simple post-processing to convert a labeled graph to structure data. Thus, in this section, we mainly focus on introducing step (b) and (c). We first formally define the problem in section 3.1, and then introduce step (b) and (c) in section 3.2 and 3.3.
3.1 Problem Definition
Consider that each cell in a table can be viewed as a vertex, and an adjacent relation (i.e., vertical, horizontal) can be viewed as a labeled edge. So a table can be represented as a graph with labeled edges , where is a set of vertices, and is a set of relations. The relation set is actually the table structure we want to recognize. Given a set of vertices of table as input, the problem is to find out an approximation to the real relations .
3.2 Graph Construction
Let denote the unlabeled edges of , the goal of graph construction is to build such edges so that is as large as possible. The simplest idea is to construct a complete graph where . However, it is impractical because it requires our model to encode edges, and thus we need to reduce in a reasonable size. In this paper, we use a simple nearest neighbors (NN) method to construct , in which each vertex is connected to its nearest neighbors so that the total number of edges will be reduced to . In the next sub-section, we will introduce GraphTSR, which takes unlabeled as input and classifies each edge into one of the categories of “vertical”, “horizontal” and “no relation”.
3.3 GraphTSR
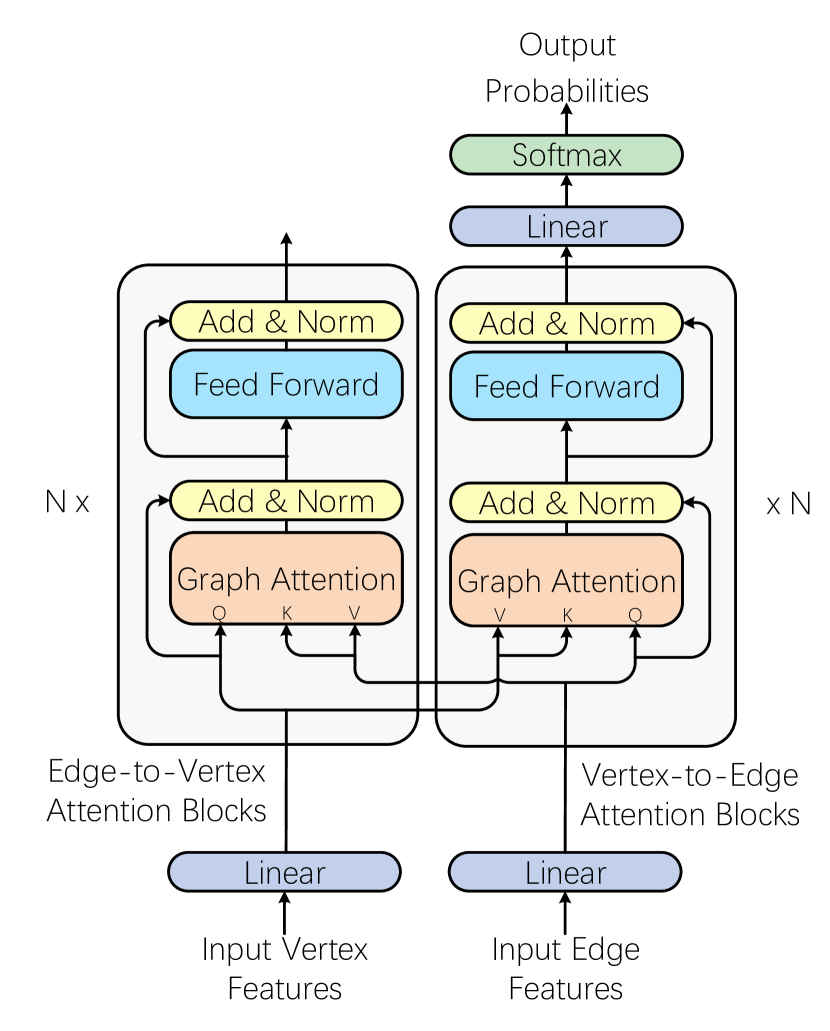
Our proposed GraphTSR is illustrated in Figure 3. It takes the vertex and edge features of a graph as input, and then computes their representations by edge-to-vertex graph attention blocks and vertex-to-edge graph attention blocks, respectively. Finally, it performs a classification over these edges.
Vertex and edge features
We design several features as the initial representation of vertices and edges. Three types of vertex features are designed including the size of cells, the absolute locations and the relative locations. As for the edge features, we use several measures of distance between cells including Euclidean distance, x-axis distance and y-axis distance in both absolute and relative manner. We also compute the overlap of cell pairs along x-axis and y-axis as the edge features.
Graph attention
Let us first review the commonly-used scaled dot-product attention proposed by Vaswani et al. (2017):
where is the dimension of keys, and are the matrices of “queries”, “keys” and “values”, respectively. Differently, inspired by the work of Veličković et al. (2017), the graph attention of our proposed GraphTSR doesn’t draw global dependencies between nodes but local dependencies on neighboring nodes, which is computed as:
where are the and row of and , and is the set of neighbors of node . Let be the row of . Then the graph attention function is:
Graph attention blocks
To support edge features, the original graph is converted to a bipartite graph with additional nodes that represent edges in the original graph. With this setting, we use edge-to-vertex graph attention blocks and vertex-to-edge graph attention blocks to encode vertices and edges separately. As shown in Figure 3, the computation of the two kinds of attention blocks is symmetrical, so we only introduce the computation of an edge-to-vertex attention block.
In the GraphTSR, we simply set , which means we use the same dimension size for “keys” and “values”. Suppose that the outputs of the edge-to-vertex and vertex-to-edge attention block are and , respectively. We denote them as and for simplicity. At the edge-to-vertex attention block, we first compute by:
where are learnable parameters. That means the edge nodes serve as “keys” and “values”, in the edge-to-vertex attention block. Then, by attending neighboring edge nodes, the representation of vertex nodes is updated as:
where is the layer normalization function Lei Ba et al. (2016). Finally, the output of the attention block is calculated as:
where is a fully connected feed-forward network, which consists of two linear transformations with a ReLU activation in between:
where , , and are learnable parameters, and is the row of representing vertex node in the graph.
4 SciTSR Dataset
We construct a large-scale table structure recognition dataset, named SciTSR, which contains 15,000 tables in PDF format and their corresponding high quality structure labels obtained from LaTeX source files. In this section, we will introduce the construction details and statistics of our SciTSR dataset.
4.1 Construction
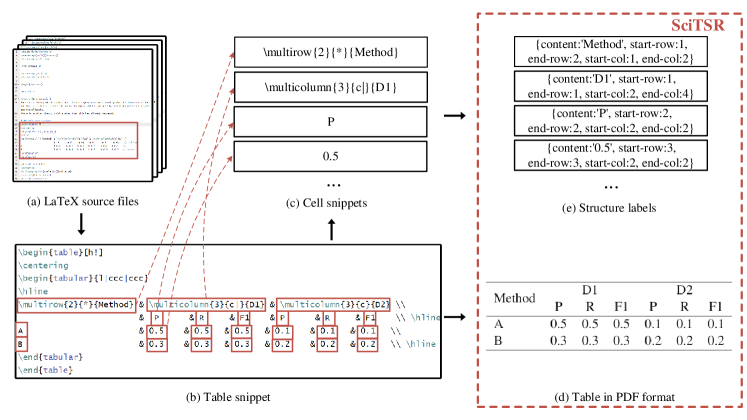
The construction pipeline of SciTSR dataset is shown in Figure 4.
We first crawl LaTeX source files from arXiv333https://arxiv.org/, where there are a large number of papers in LaTeX format.
Then we extract all the table snippets (Figure 4 (b)) from the LaTeX source files by a regular expression. A table snippet is a LaTeX code snippet used to present tables, which usually begins with ‘\begin{table}’ command and ends with ‘\end{table}’ command.
After that, we compile each table snippet to an individual PDF file (Figure 4 (d)).
To obtain the structure labels, we split each table snippet with ‘\\’ and ‘&’, thus we get a series of cell snippets (Figure 4 (c)) and their corresponding coordinates (i.e., start row, end row, start column and end column).
As there are many kinds of commands, such as ‘\textbf{}’ and ‘\alpha’, in the code, the cell snippets are not always same as the actual text in PDF. So we compile the cell snippets into PDF files, and then extract the real text from them.
Note that there are several commands like ‘\multirow{}’ or ‘\multicolumn{}’ in the cell snippets, which means these cells are spanning cells. Therefore, we re-compute their coordinates by parsing the ‘\multirow{}’ and ‘\multicolumn{}’ commands.
By now, we get all the cell contents and their coordinates, namely structure labels, and we dumped them in JSON format (Figure 4 (e)).
4.2 Statistics
| Train | Test | |
|---|---|---|
| #tables | 12,000 | 3,000 |
| #complicated tables | 2,885 | 716 |
| Ratio of complicated tables | 24.0% | 23.9% |
| Avg. #rows / table | 9.29 | 9.31 |
| Avg. #columns / table | 5.21 | 5.18 |
| Avg. #cells / table | 47.74 | 48.80 |
| Dataset | Train | Test |
|---|---|---|
| ICDAR-2013 | 0 | 156 |
| SciTSR | 12,000 | 3,000 |
| SciTSR-COMP | - | 716 |
| Method | ICDAR-2013 | SciTSR | SciTSR-COMP | ||||||
|---|---|---|---|---|---|---|---|---|---|
| Precision | Recall | F1 | Precision | Recall | F1 | Precision | Recall | F1 | |
| Tabby | 0.789 | 0.845 | 0.816 | 0.914 | 0.910 | 0.912 | 0.869 | 0.841 | 0.855 |
| DeepDeSRT | 0.573 | 0.564 | 0.568 | 0.898 | 0.897 | 0.897 | 0.811 | 0.813 | 0.812 |
| Adobe | - | - | - | 0.829 | 0.796 | 0.812 | 0.796 | 0.737 | 0.765 |
| GraphTSR | 0.819 | 0.855 | 0.837 | 0.936 | 0.931 | 0.934 | 0.943 | 0.925 | 0.934 |
| Method | ICDAR-2013 | SciTSR | SciTSR-COMP | ||||||
|---|---|---|---|---|---|---|---|---|---|
| Precision | Recall | F1 | Precision | Recall | F1 | Precision | Recall | F1 | |
| Tabby | 0.846 | 0.862 | 0.854 | 0.926 | 0.920 | 0.921 | 0.892 | 0.872 | 0.882 |
| DeepDeSRT | 0.632 | 0.617 | 0.615 | 0.906 | 0.887 | 0.890 | 0.863 | 0.831 | 0.846 |
| Adobe | - | - | - | 0.930 | 0.784 | 0.851 | 0.901 | 0.717 | 0.798 |
| GraphTSR | 0.885 | 0.860 | 0.872 | 0.959 | 0.948 | 0.953 | 0.964 | 0.945 | 0.955 |
The statistics of the SciTSR dataset are shown in Table 1. There are 15,000 tables as well as their corresponding structure labels in total, and we split 12,000 for training and 3,000 for test. There are averagely about 9 rows, 5 columns and 48 cells in a table. Particularly, we focus on the complicated tables, which have at least one spanning cell in them. There are 2,885 and 716 complicated tables in training and test set, about 24.0% and 23.9%, respectively. That means the majority of tables in SciTSR dataset are still simple grid-like tables. Furthermore, to reflect the model’s ability of recognizing complicated tables, we extract all the 716 complicated tables from the test set as a test subset, called SciTSR-COMP.
5 Experiment
5.1 Dataset
We evaluate our model and baselines on our SciTSR dataset and the widely used ICDAR-2013 dataset Göbel et al. (2013). Both datasets provide tables in PDF format and the corresponding structure labels, which contains contents and coordinates (i.e., the number of start row, end row, start column and end column) of cells. It should be noted that ICDAR-2013 dataset doesn’t have a training set, but only provides a small test set. While our SciTSR dataset provides a large number of tables for both train and test set. Statistics of these datasets are listed in Table 2.
5.2 Metrics
We employ the widely used evaluation procedure presented by Göbel et al. (2012), which is also used in ICDAR 2013 table competition. Specifically, it first converts a table to a list of horizontally and vertically adjacent relations between cells and their vertical and horizontal neighbors, and then make a comparison on relations extracted from output tables and ground truth by using precision and recall measures. We first calculate these scores separately on each table, and then compute both macro- and micro-averaged scores as the final result.
5.3 Baselines
We compare our method with two state-of-the-art baselines and a commercial software:
-
•
Tabby: The Tabby Shigarov et al. (2016) is a rule-based tool for extracting tables from PDF documents, and we use their open-source implementation for experiments444http://github.com/cellsrg/tabbypdf/.
-
•
DeepDeSRT: DeepDeSRT Schreiber et al. (2017) is a data-driven method that utilizes a semantic segmentation model to recognize the table structure as a set of segmented rows and columns. We implemented this model because there is no available code for this method.
-
•
Adobe: We use the Adobe Acrobat DC SDK555https://www.adobe.com/devnet/acrobat/sdk/eula.html to extract tables to HTML format, and then parse these files to obtain structure labels. For the sake of simplicity, we denote it as Adobe.
The tag sequences generated by the image-to-text model Li et al. (2019) don’t provide column coordinates. They cannot be used to restore the origin tables. So we don’t use it as a baseline in our experiment.
| Method | Macro | Micro | ||||
|---|---|---|---|---|---|---|
| Precision | Recall | F1 | Precision | Recall | F1 | |
| Tabby | 0.363 | 0.397 | 0.379 | 0.141 | 0.332 | 0.196 |
| DeepDeSRT | - | - | - | - | - | - |
| Adobe | 0.480 | 0.490 | 0.485 | 0.647 | 0.468 | 0.543 |
| GraphTSR | 0.711 | 0.696 | 0.703 | 0.630 | 0.620 | 0.625 |
5.4 Implementation Details
We implement our model with PyTorch 0.4.1, and train a 4-block GraphTSR with for both edge-to-vertex and vertex-to-edge attention blocks. It’s trained to minimize the cross-entropy on the labeled edges using the Adam Kingma and Ba (2014) optimizer with an initial learning rate of 0.0005. Because most of the edges constructed by NN is labeled as “no relation”, we set a manual rescaling weight of 0.2 for “no relation” and 1.0 for the “vertical” and “horizontal” relations. Besides, when constructing edges, is set as to cover most real edges. We also use a weight decay with on parameters and dropout Srivastava et al. (2014) with to the output of each sub-layer before it is added to the sub-layer input and normalized to prevent over-fitting. During training, we utilize a batch size of 1 graph for 15 epochs on Intel Xeon CPUs, and each epoch takes about 20 minutes for 12,000 tables in total. Because our proposed GraphTSR cannot directly take PDF files as input, we compute a matching between pre-processed cells from input PDFs and ground truth cells generated by LaTeX documents to label edges as training data.
5.5 Result and Discussion
Overall results
Our main results are shown in Table 3 and 4, where the results are presented by macro- and micro-averages scores, respectively. From the tables, it can be observed that: (1) Our model outperforms state-of-the-art baselines on all datasets. On both ICDAR-2013 and SciTSR dataset, F1 scores of our method are at least 2% higher than baselines. While in SciTSR-COMP, our method outperforms other methods at least 7% in F1 scores, providing a significant improvement. (2) Our model shows a strong generalization ability. Both DeepDeSRT and our model are trained on the SciTSR training set and tested on ICDAR-2013 dataset because it doesn’t provide a training set. With the same training set, we can see that DeepDeSRT suffers from a big drawback on the test set of ICDAR-2013, because there is a domain difference between ICDAR-2013 dataset and our SciTSR dataset. In contrast, our model still achieves the best results comparing to the other three baselines, which demonstrates the strong generalization ability of our model. It also suggests that directly taking images as input makes the model sensitive to fonts or styles of tables, and finally fails to generalize on tables with unseen fonts or styles.
Results on complicated tables
To evaluate the power of our model for complicated tables, we conduct experiments on SciTSR-COMP dataset, and the results are shown in Table 3 and 4. Comparing to the results on SciTSR dataset, we observe that all the baselines have at least a 4% performance drop off on SciTSR-COMP while our method remains a high level of F1 scores, which indicates that our model is better able to capture structures of complicated tables. Though the SciTSR-COMP test set only contains complicated tables, the dominant type of cells is still the non-spanning cells. The results on SciTSR-COMP cannot perfectly show the power of our model on complicated tables. Therefore, we perform additional experiments that on only spanning cells, which means relations between non-spanning cells won’t be considered in the evaluation. The experiment results are presented in Table 5, where all the methods have different degrees of decline in performance, especially Tabby, which reaches a decrease of micro-F1 to 72.5%. However, our method consistently outperforms the baselines greatly. Note that as the output of DeepDeSRT is always grid-like tables without spanning cells, it cannot recognize any spanning cells.
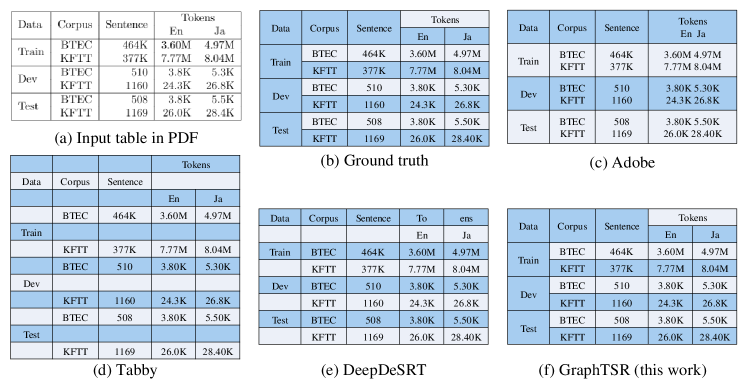
Case study
We collect the outputs of these methods on SciTSR-COMP test set, and perform a case study to analyze the advantages of our model on complicated tables. Figure 5 shows an example from SciTSR-COMP, which is a table presented in a scientific paper666https://aclweb.org/anthology/D16-1162. We compare the ground truth table structures and the recognized table structures by different methods, where cells are marked with different colors to distinguish from each other. From the results, it can be found that our model recognizes the internal structure of the table correctly while other methods have different degrees of mistakes. In Figure 5 (c), Adobe simply recognizes the structure as a grid-like table where contents in the same ruling box are incorrectly merged into a single cell. While in Figure 5 (d), the headers and their corresponding body cells are placed into different rows because of the small horizontal overlap (i.e., Train and BTEC). In Figure 5 (e), limited to the design of the model, the DeepDeSRT can only recognize a table as a grid-like structure, so all the spanning cells are split into non-spanning cells.
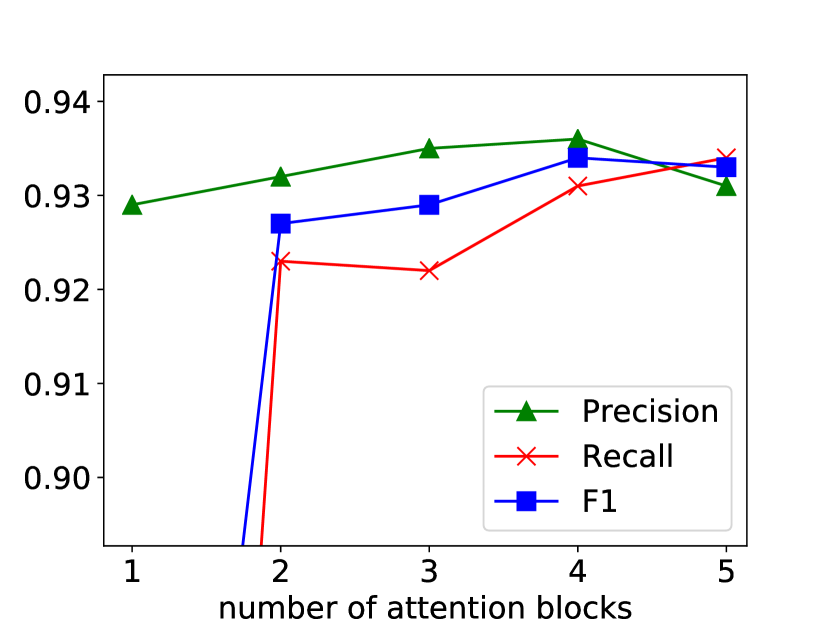
Impact of the number of attention blocks
To better understand the impact of the number of graph attention blocks in the GraphTSR, we perform a study by changing . The results is illustrated in Figure 6. It can be observed that the performance of our model improves as increases. Moreover, we find that has a great impact on the recall scores. It suggests that if is set to be too small, nodes in the graph can only access limited surrounding nodes, resulting in the conservative prediction of the model. In other words, when is small, the model tends to predict “no relation” between two cells.
6 Conclusion
In this paper, we propose a novel graph neural model for complicated table structure recognition in PDF files. Moreover, we release a large-scale dataset for table structure recognition in PDF files, which contains 15,000 tables and their corresponding structure labels. Extensive experiments show the power of our model on complicated tables.
References
- Bao et al. (2018) Junwei Bao, Duyu Tang, Nan Duan, Zhao Yan, Yuanhua Lv, Ming Zhou, and Tiejun Zhao. 2018. Table-to-text: Describing table region with natural language. In Thirty-Second AAAI Conference on Artificial Intelligence.
- Göbel et al. (2012) Max Göbel, Tamir Hassan, Ermelinda Oro, and Giorgio Orsi. 2012. A methodology for evaluating algorithms for table understanding in pdf documents. In Proceedings of the 2012 ACM symposium on Document engineering, pages 45–48. ACM.
- Göbel et al. (2013) Max Göbel, Tamir Hassan, Ermelinda Oro, and Giorgio Orsi. 2013. Icdar 2013 table competition. In 2013 12th International Conference on Document Analysis and Recognition, pages 1449–1453. IEEE.
- Hassan and Baumgartner (2007) Tamir Hassan and Robert Baumgartner. 2007. Table recognition and understanding from pdf files. In Ninth International Conference on Document Analysis and Recognition (ICDAR 2007), volume 2, pages 1143–1147. IEEE.
- Jain et al. (2018) Parag Jain, Anirban Laha, Karthik Sankaranarayanan, Preksha Nema, Mitesh M Khapra, and Shreyas Shetty. 2018. A mixed hierarchical attention based encoder-decoder approach for standard table summarization. arXiv preprint arXiv:1804.07790.
- Jauhar et al. (2016) Sujay Kumar Jauhar, Peter Turney, and Eduard Hovy. 2016. Tables as semi-structured knowledge for question answering. In Proceedings of the 54th Annual Meeting of the Association for Computational Linguistics (Volume 1: Long Papers), volume 1, pages 474–483.
- Kingma and Ba (2014) Diederik P Kingma and Jimmy Ba. 2014. Adam: A method for stochastic optimization. arXiv preprint arXiv:1412.6980.
- Lei Ba et al. (2016) Jimmy Lei Ba, Jamie Ryan Kiros, and Geoffrey E Hinton. 2016. Layer normalization. arXiv preprint arXiv:1607.06450.
- Li et al. (2016) Jiwei Li, Will Monroe, Alan Ritter, Michel Galley, Jianfeng Gao, and Dan Jurafsky. 2016. Deep reinforcement learning for dialogue generation. arXiv preprint arXiv:1606.01541.
- Li et al. (2019) Minghao Li, Lei Cui, Shaohan Huang, Furu Wei, Ming Zhou, and Zhoujun Li. 2019. Tablebank: Table benchmark for image-based table detection and recognition. arXiv preprint arXiv:1903.01949.
- Oro and Ruffolo (2009) Ermelinda Oro and Massimo Ruffolo. 2009. Trex: An approach for recognizing and extracting tables from pdf documents. In 2009 10th International Conference on Document Analysis and Recognition, pages 906–910. IEEE.
- Pasupat and Liang (2015) Panupong Pasupat and Percy Liang. 2015. Compositional semantic parsing on semi-structured tables. arXiv preprint arXiv:1508.00305.
- Ramel et al. (2003) J-Y Ramel, Michel Crucianu, Nicole Vincent, and Claudie Faure. 2003. Detection, extraction and representation of tables. In Seventh International Conference on Document Analysis and Recognition, 2003. Proceedings., pages 374–378. IEEE.
- Schreiber et al. (2017) Sebastian Schreiber, Stefan Agne, Ivo Wolf, Andreas Dengel, and Sheraz Ahmed. 2017. Deepdesrt: Deep learning for detection and structure recognition of tables in document images. In 2017 14th IAPR International Conference on Document Analysis and Recognition (ICDAR), volume 1, pages 1162–1167. IEEE.
- Shigarov et al. (2016) Alexey Shigarov, Andrey Mikhailov, and Andrey Altaev. 2016. Configurable table structure recognition in untagged pdf documents. In Proceedings of the 2016 ACM Symposium on Document Engineering, pages 119–122. ACM.
- Srivastava et al. (2014) Nitish Srivastava, Geoffrey Hinton, Alex Krizhevsky, Ilya Sutskever, and Ruslan Salakhutdinov. 2014. Dropout: a simple way to prevent neural networks from overfitting. The Journal of Machine Learning Research, 15(1):1929–1958.
- Vaswani et al. (2017) Ashish Vaswani, Noam Shazeer, Niki Parmar, Jakob Uszkoreit, Llion Jones, Aidan N Gomez, Łukasz Kaiser, and Illia Polosukhin. 2017. Attention is all you need. In Advances in neural information processing systems, pages 5998–6008.
- Veličković et al. (2017) Petar Veličković, Guillem Cucurull, Arantxa Casanova, Adriana Romero, Pietro Lio, and Yoshua Bengio. 2017. Graph attention networks. arXiv preprint arXiv:1710.10903.
- Yan et al. (2016) Zhao Yan, Nan Duan, Junwei Bao, Peng Chen, Ming Zhou, Zhoujun Li, and Jianshe Zhou. 2016. Docchat: An information retrieval approach for chatbot engines using unstructured documents. In Proceedings of the 54th Annual Meeting of the Association for Computational Linguistics (Volume 1: Long Papers), volume 1, pages 516–525.
- Yildiz et al. (2005) Burcu Yildiz, Katharina Kaiser, and Silvia Miksch. 2005. pdf2table: A method to extract table information from pdf files. In IICAI, pages 1773–1785.