Telescope Array 10 Year Composition
Abstract:
Estimates of the composition of ultra high energy cosmic rays (UHECRs) can be inferred by recording the depth of air shower maximum, , for many showers and comparing the distributions to those predicted by Monte Carlo simulations. Traditionally, UHECR composition has relied upon comparison of the first and second moments of the distributions to estimate the compatibility between data and simulations, but with the large UHECR datasets being built the current generation experiments better tests which compare full distributions can be employed. Such tests can be used to understand the accuracy with which UHECR composition can actually be understood at the current level of statistics and quantitatively measure the significance of agreement or disagreement with models in order to reject them. In this paper we present the most recent results of 10 years of Telescope Array hybrid measurements which is found to agree with a predominantly light composition. In previously published results we have demonstrated the agreement of Telescope Array hybrid data with single element models using systematic shifting of the data in order to ensure the shapes of the distributions are being compared. Here we present multi-component source models fit to hybrid data and report on the relative fractions of those sources that best fit the data. Below eV TA hybrid data is found to be compatible with mixtures composed of predominantly light elements such as protons and helium.
1 Introduction
Telescope Array (TA) is a large hybrid cosmic ray observatory located in Millard County, Utah ( N, W, 1400 m asl) designed to observe ultra high energy cosmic rays with energies in excess of eV. TA utilizes 507 plastic scintillation counters, also referred to as surface detectors (SDs), placed over km2 and 36 fluorescence detector (FD) telescopes, distributed among three FD stations, to measure the energy, depth of air shower maximum (), and arrival direction of UHECRs. Refer to [1, 2, 3, 4] for further details of TA’s SD and FD operations.
2 TA Ten Year data
Hybrid reconstruction is done by searching for coincident events in the SD and FD data streams that occur within 500s. The timing and geometry of the event from the SD event data is used to constrain the location of the shower core on the ground, which greatly improves the determination of the shower track in the FD shower-detector plane. Using the improved geometry fit, the light profile of the shower is fit using the FD information, providing accurate measurements of energy and that are better than monocular FD reconstruction alone. Uncertainties in angular quantities important to reconstruction of the shower track improve to less than a degree, and relative uncertainties in distances improve to less than 1% when performing hybrid reconstruction.
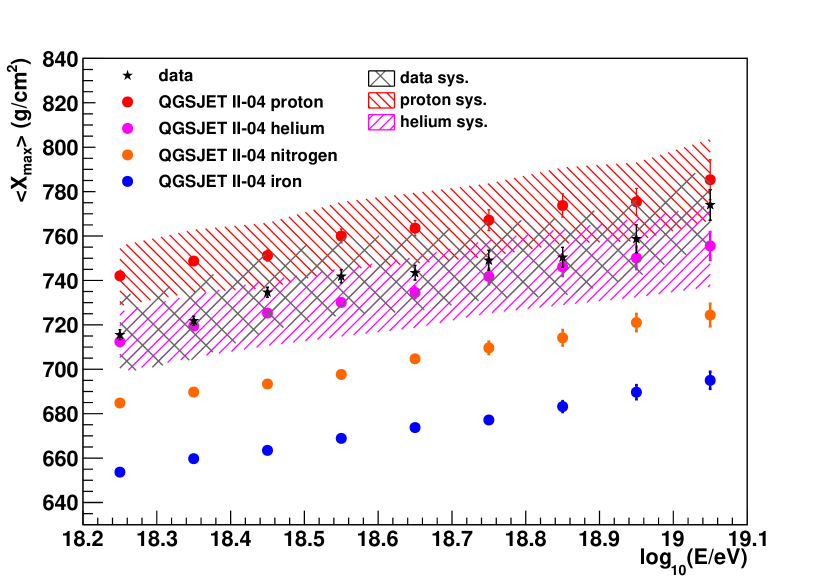
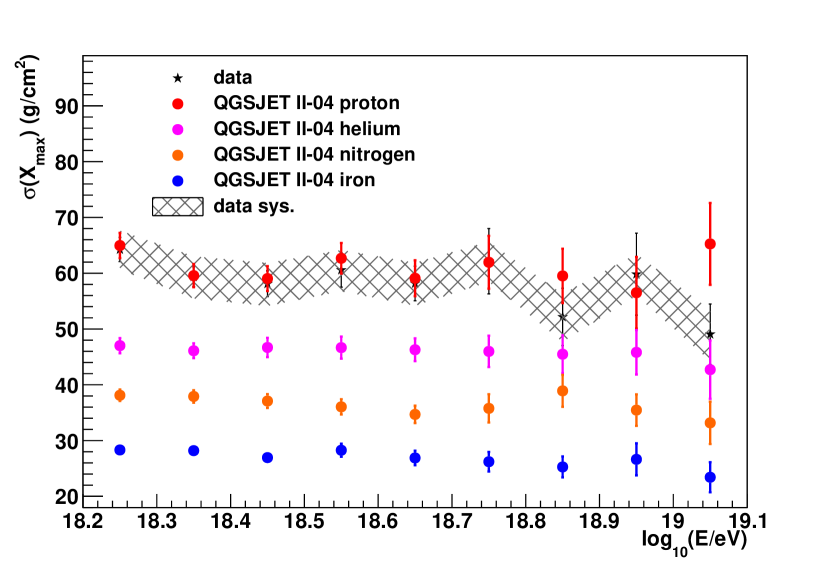
TA’s highest statistics measure of composition is done using Black Rock Mesa and Long Ridge (BR/LR) hybrid. Events that trigger the BR or LR FD stations are time matched to events that also trigger the SD array. If an event is observed by both FD stations, the shower parameters from the site with the better hybrid shower profile is chosen. Data and Monte Carlo are processed via the same analysis software and the same quality cuts are applied: the event core must be well within the SD array more than 100 m from the boundary, FD track length or greater, 11 or more good tubes recorded by FDs, shower-detector plane angle () less than , time extent of the FD track greater than 7 s, zenith angle less than , must be observed within the field of view of FDs, and weather cuts to ensure atmospheric quality is good. 3560 events, collected over the period 27 May 2008 to 28 November 2017, were selected after application of these cuts. The systematic uncertainty on the data is 17 g/cm2 (black band in the figure). bias and resolution are ¡ 1 and 17.2 g/cm2 respectively, and energy resolution is 5.7% [5]. The absolute FD energy scale energy uncertainty is 21% [6, 7]. Figure 1 shows the observed and for 10 years of data between and eV along with predictions of QGSJET II-04 proton, helium, nitrogen, and iron .
3 Single Element UHECR Composition
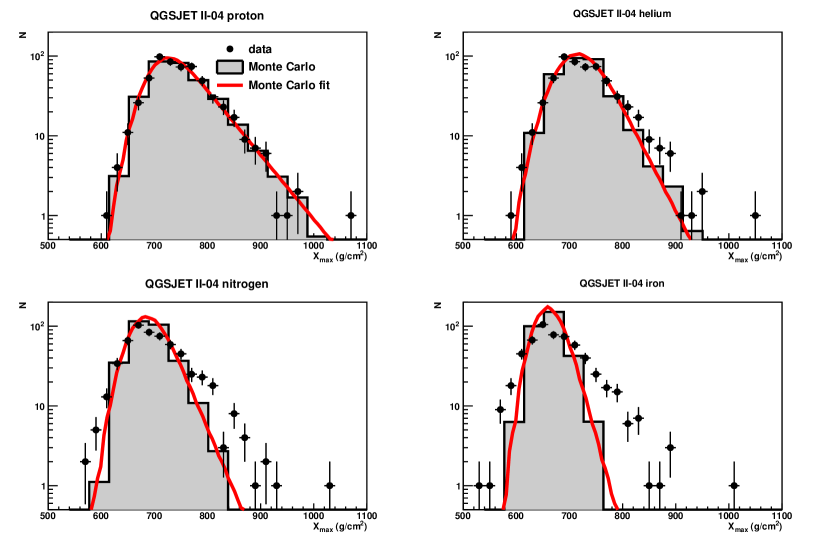
A more rigorous test of the compatibility of TA data with models is to test the entire distributions instead of and . We test the agreement of TA data and single element models in this case by computing the maximum likelihood of the data and Monte Carlo distributions and including a systematic shift of the data to account of systematic uncertainty in either in our analysis, the models being tested, or both. This tests the shapes of the distributions which contain a good deal of information because of the exponential tail of the light components. For each component and in each energy bin, the data is shifted and the shift with the largest maximum likelihood is recorded. Then the probability (-value) of observing a likelihood at least as extreme as found between the data and the model is calculated [5].
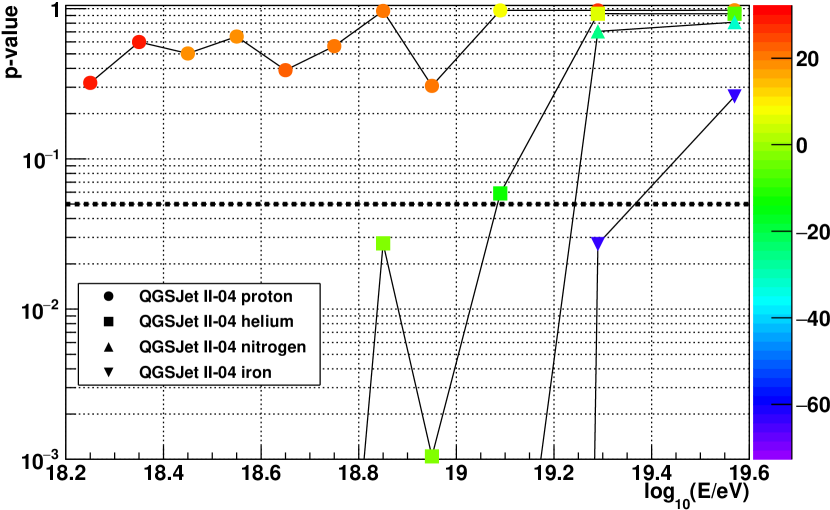
Figure 2(a) shows the data and Monte Carlo predictions of QGSJET II-04 proton, helium, nitrogen, and iron for one energy bin under this test. Notice that proton and helium appear to agree with the data well, especially in the tails of the distributions, whereas nitrogen and iron do not resemble the data. The same data is shown in each panel, but is systematically shifted as described above. Figure 2(b) summarizes these tests showing the -values obtained and the shifts required to maximize the likelihood. If the -value is less than 0.05, we say that the data is not compatible with the element in question for that energy bin. As the figure shows, TA hybrid data is compatible with QGSJET II-04 proton from to eV with systematic shifting of about 20 g/cm2 needed. Other elements are not compatible with the data until eV. In the last energy bin, all four single element tests indicate compatibility with the data. This is due to low statistics in that bin, where only 19 events are recorded. Notice also that iron requires a shift of about 50 g/cm2, which is much larger than our systematic uncertainty.
4 Multiple Element UHECR Composition
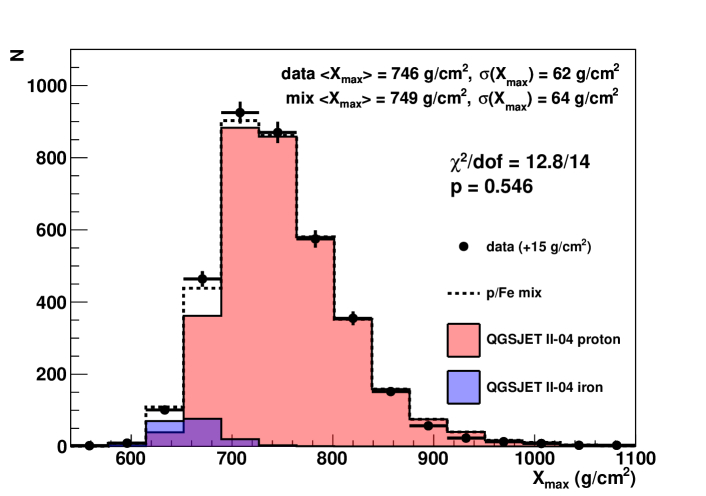
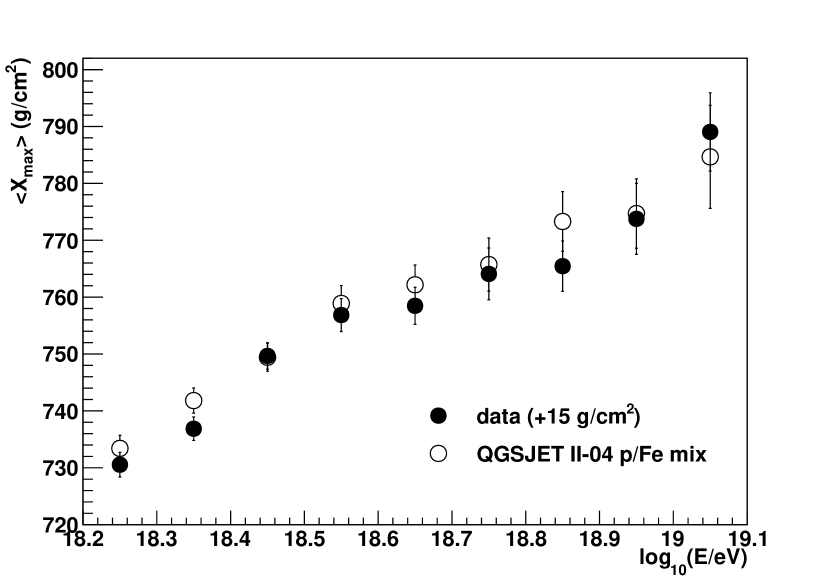
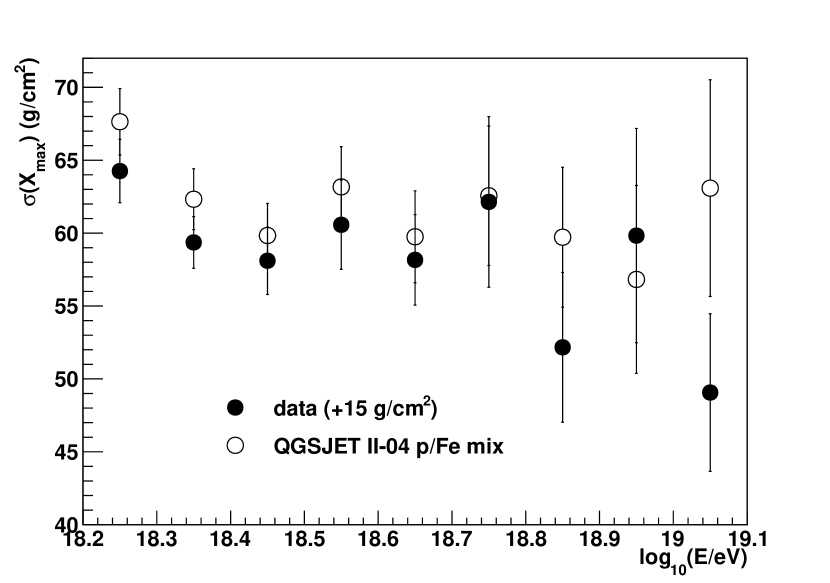
We can extend this type of test to mixtures of elements. The simplest assumption is that UHECRs are comprised of a light and heavy component, e.g., proton and iron. Using the method outlined by Barlow & Beeston [8] and implemented in ROOT [9] as the TFractionFitter class, we find the source weights (fractions) of reconstructed QGSJET II-04 proton and iron which best fit the data in energy bins between - eV. We can also scan for the minimum of these fits as we systematically shift the data within our quoted systematics. Figure 3 shows the distribution of the data, mix, and contributions of proton and iron. The minimum for this model is found by shifting up by g/cm2. The fractions of proton and iron found to best fit the data is 95% proton and 5% iron, with good agreement in the means and widths of the data and mix distributions. The of the data and proton-iron mix are 746 g/cm2 and 749 g/cm2 respectively and the are 62 g/cm2 and 64 g/cm2. The and of the data and the proton-iron mix as a function of energy are shown in figure 4.
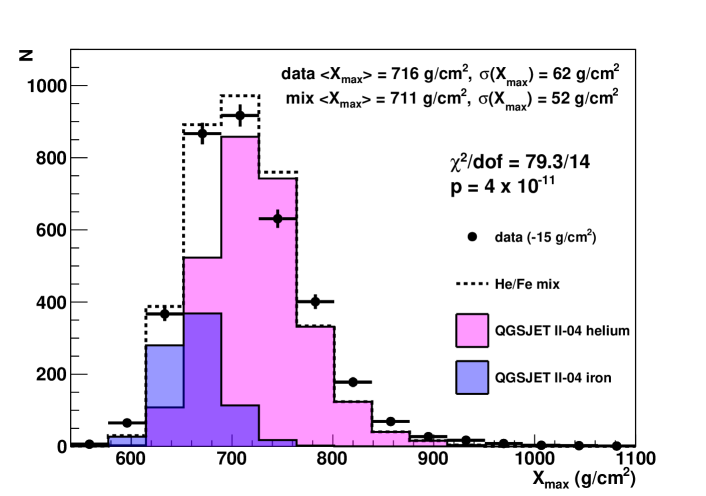
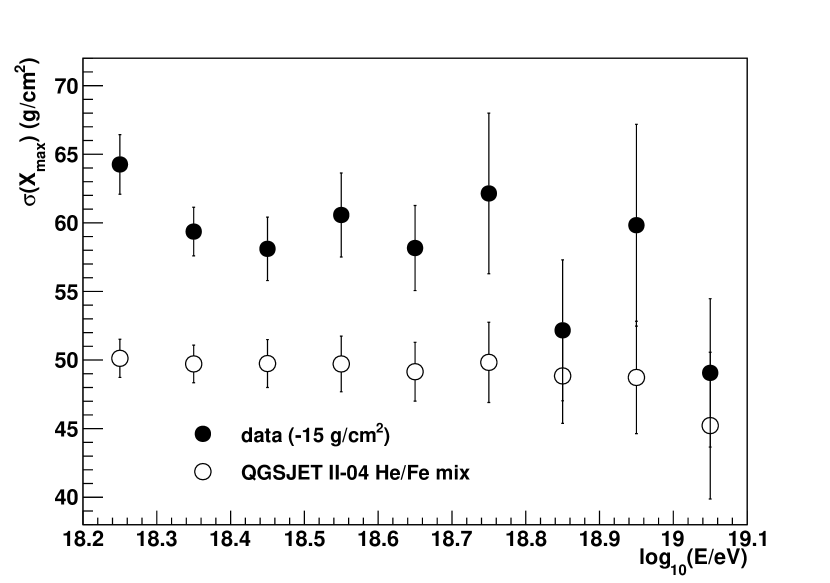
It is instructive to look at the next simplest light/heavy model: helium and iron. Figure 5 shows the distributions of this two component model and the data and figure 6 shows the and of such a mixture. This composition mix required a -15 g/cm2 shift in the data to find the minimum and results in a mixture of 77% helium and 23% iron. As figure 6 shows, while the of the mix is within statistical uncertainties of the shifted data, does not resemble the data at all. It’s important to recall that uniform systematic shifting of a distribution does not change . Because protons contribute prominently to the tail of distributions, this result indicates that some protons must be present in any mixture we create. The difference in the tails of the data and the helium-iron mixture can be clearly seen in the right part of the distributions shown in figure 5. The simple helium-iron can be used to measure a lower bound on the proton content of distributions.

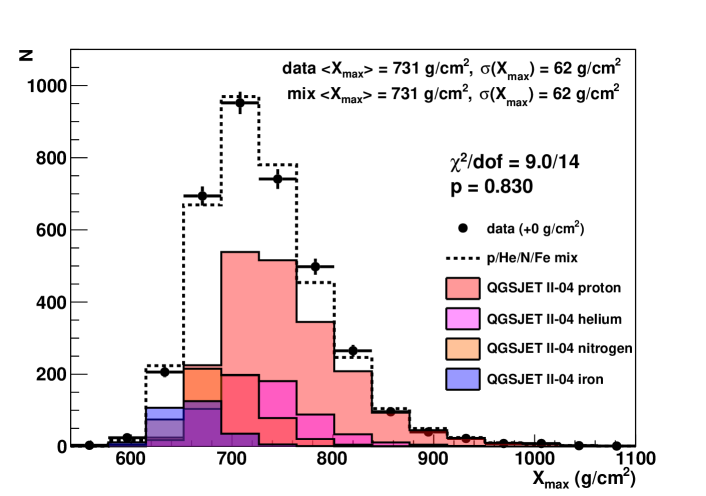
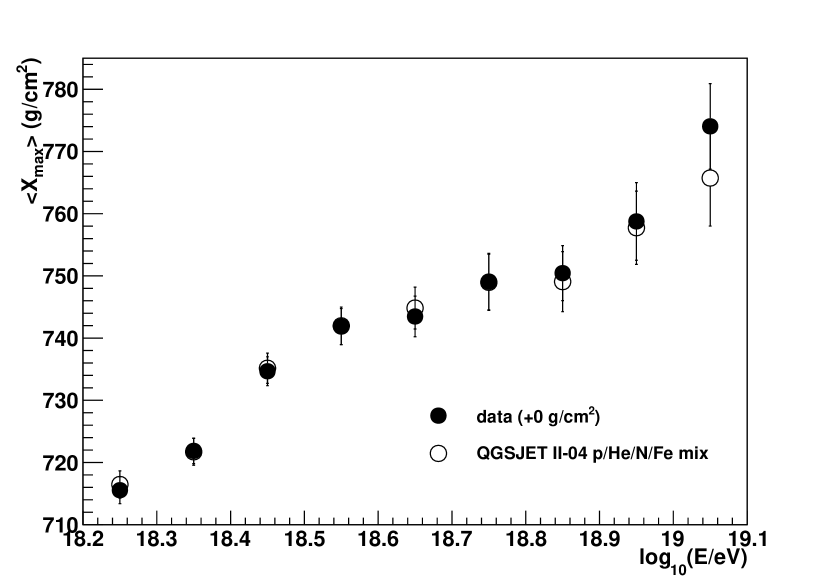
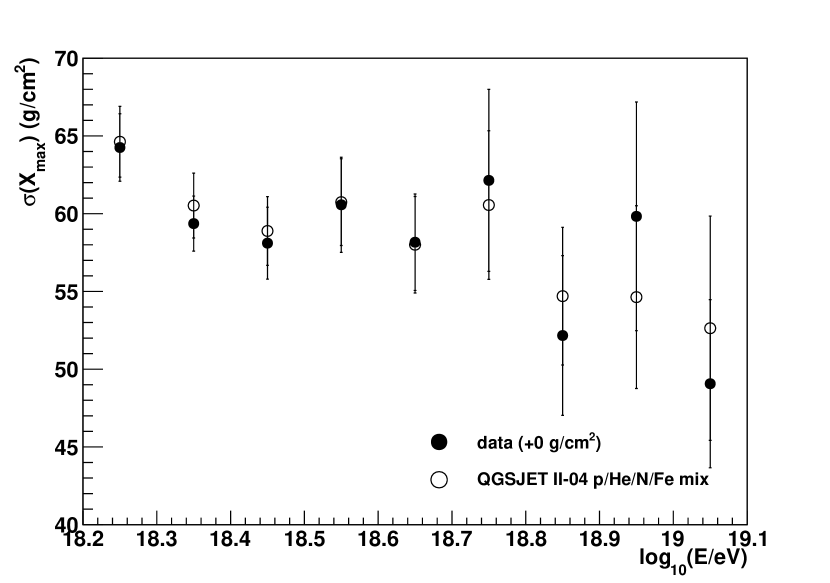
The Auger collaboration has published a similar analysis in which they fit their data to a four component model [10]. We now perform the same analysis using the QGSJET II-04 hadronic model. Figure 7 shows the distributions of the data and model for the energy range - eV under the assumption of a four component mixture. Note that no systematic shift is applied to the data. and of the data and mix, shown in energy bins in figures 8(a) and 8(b), agree well and the /dof of the distributions is 9.0/14. The mix consists of 57%, 18%, 17%, 8% proton, helium, nitrogen, and iron respectively. 75% of this mixture are the light elements proton and helium.
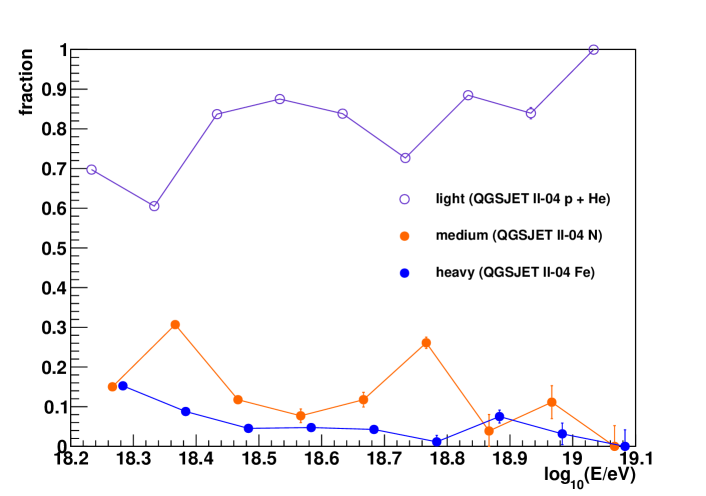
We find that in this mix model, correlations between the different element fractions extracted from the fitter exist. In particular, proton and helium are strongly correlated with for nearly the entire energy range. The least correlated elements are proton and iron. This is due to the similarity of the proton and helium distributions. of helium and proton differ by only g/cm2 and the resolution of hybrid reconstruction is about 18 g/cm2. A future Monte Carlo study will investigate the bias introduced into the fraction calculations that are caused by these correlations. For this reason it is better to classify the proton and helium contributions as “light” elements, with nitrogen as “medium”, and iron as “heavy”. Figure 9 shows the fractions of these three categories of elements as a function of energy.
5 Summary
Telescope Array has recently completed analysis of ten years of hybrid data. and of the data are consistent with predominantly light elements such as QGSJET II-04 proton and helium. Tests of our data against single elements require systematic shifting of order the reconstruction resolution, but find that the data is compatible with pure QGSJET II-04 protons over the entire energy range observed for that study ( - eV). If we extend comparisons of data to Monte Carlo predictions by fitting multiple sources, we find agreement with QGSJET II-04 proton-iron mix, again with systematic shifting of the data, resulting in a 95% proton content. If we attempt to simultaneously fit intermediate mass elements as well in a four component mixture of proton, helium, nitrogen, and iron as Auger has reported on, we can find good agreement with the data and the mix without the need of systematic shifting of the data. This results in a mixture of % proton + helium, 17% nitrogen, and 8% iron. Because we observe strong correlations in the fitting of multiple components, particularly proton and helium, we report them as a “light” component of the mixture.
References
- [1] Telescope Array collaboration, The surface detector array of the Telescope Array experiment, Nucl. Instrum. Meth. A689 (2013) 87 [1201.4964].
- [2] T. Abu-Zayyad et al., The prototype high-resolution Fly’s Eye cosmic ray detector, Nucl. Instrum. Meth. A450 (2000) 253.
- [3] Y. Tameda et al., Trigger electronics of the new fluorescence detectors of the Telescope Array experiment, Nucl. Instrum. Meth. A609 (2009) 227.
- [4] H. Tokuno et al., New air fluorescence detectors employed in the Telescope Array experiment, Nucl. Instrum. Meth. A676 (2012) 54 [1201.0002].
- [5] Telescope Array collaboration, Depth of Ultra High Energy Cosmic Ray Induced Air Shower Maxima Measured by the Telescope Array Black Rock and Long Ridge FADC Fluorescence Detectors and Surface Array in Hybrid Mode, Astrophys. J. 858 (2018) 76 [1801.09784].
- [6] Telescope Array collaboration, The Energy Spectrum of Ultra-High-Energy Cosmic Rays Measured by the Telescope Array FADC Fluorescence Detectors in Monocular Mode, Astropart. Phys. 48 (2013) 16 [1305.6079].
- [7] Telescope Array collaboration, Energy Spectrum of Ultra-High Energy Cosmic Rays Observed with the Telescope Array Using a Hybrid Technique, Astropart. Phys. 61 (2015) 93 [1305.7273].
- [8] R. J. Barlow and C. Beeston, Fitting using finite Monte Carlo samples, Comput. Phys. Commun. 77 (1993) 219.
- [9] R. Brun and F. Rademakers, ROOT: An object oriented data analysis framework, Nucl. Instrum. Meth. A389 (1997) 81.
- [10] Pierre Auger collaboration, Depth of maximum of air-shower profiles at the Pierre Auger Observatory. II. Composition implications, Phys. Rev. D90 (2014) 122006 [1409.5083].