The Filamentary Radio Lobes of the Seyfert-Starburst Composite Galaxy NGC 3079
Abstract
We present results from multi-frequency polarization-sensitive Very Large Array observations of the Seyfert-starburst composite galaxy NGC 3079. Our sensitive radio observations reveal a plethora of radio “filaments” comprising the radio lobes in this galaxy. We analyze the origin of these radio filaments in the context of existing Chandra X-ray and HST emission-line data. We do not find a one-to-one correlation of the radio filaments with the emission line filaments. The north-eastern lobe is highly polarized with polarization fractions at 5 GHz. The magnetic fields are aligned with the linear extents of the optically-thin filaments, as observed in our, as well as other observations in the literature. Our rotation measure images show evidence for rotation measure inversion in the north-eastern lobe. Our data best fit a model where the cosmic rays follow the magnetic field lines generated as a result of the dynamo mechanism. There could be additional effects like shock acceleration that might also be playing a role. We speculate that the peculiar radio lobe morphology is a result of an interplay between both the superwinds and the AGN jet that are present in the galaxy. The jet, in fact, might be playing a major role in providing the relativistic electron population that is present in the radio lobes.
1 Introduction
Radio observations reveal that most Seyfert galaxies have sub-parsec-scale radio emission in spite of their “radio-quiet” AGN status (de Bruyn & Wilson, 1976; Ulvestad & Wilson, 1984a, b; Roy et al., 1994; Thean et al., 2000; Lal et al., 2004; Kharb et al., 2010, 2014). Many of these galaxies with small-scale radio emission show elongated kiloparsec-scale radio structures (KSRs), similar to the radio jets seen in powerful radio galaxies. The kpc-scale radio structures, however, are not always found to be aligned with the small scale jets (Baum et al., 1993; Colbert et al., 1996; Gallimore et al., 2006). Furthermore, Seyfert radio jets were found to be randomly aligned with respect to the host galaxy major axes (Kinney et al., 2000; Schmitt et al., 2001; Schmitt & Kinney, 2002). Abrupt changes of jet axes were also inferred in several Seyfert galaxies, e.g., NGC 4151 (Ulvestad et al., 1998), NGC 1068 (Gallimore et al., 1996), and Mrk 6 (Kharb et al., 2006). It appears that the radio structures in Seyfert galaxies are more complex than in radio galaxies. In particular, it is unclear if KSRs are purely AGN-driven (either via a jet or an accretion-disk wind) or starburst superwind-driven. It is essential to disentangle these contributions before the truly relevant questions of how radio outflows are produced in low-luminosity AGN (LLAGN) in general, and Seyfert galaxies in particular can be answered. Also, the role played by LLAGN outflows in AGN feedback needs to be examined (Croton et al., 2006; Müller-Sánchez et al., 2011; Riffel et al., 2013).
NGC 3079 is a well known nearby () Seyfert 2 / LINER galaxy with a nuclear starburst, that is a member of an interacting galaxy pair. It is an edge-on spiral galaxy with several regions of star-formation along the disk. Its 8-shaped radio structure with a ring-like feature (“ring” hereafter) inside its north-east lobe (Duric & Seaquist, 1988; Irwin & Saikia, 2003; Wiegert et al., 2015; Irwin et al., 2019), its slow-moving () parsec-scale radio jet (Irwin & Seaquist, 1988; Baan & Irwin, 1995; Middelberg et al., 2005), copious amount of hot X-ray gas and emission-line filaments (Cecil et al., 2001, 2002), have been well documented. NGC 3079 is a Compton-thick AGN (Iyomoto et al., 2001) having a disk-like pseudo-bulge. The origin of the double-lobed morphology observed in the NGC 3079 is not yet completely understood. Duric & Seaquist (1988) argue that the lobe material is moving at supersonic velocities, though they dismiss the possibility that these are jets which may be precessing based on the difficulty in reproducing the closed loop morphology using these models. They suggest that these are probably winds originating from a nuclear starburst or accretion activity. X-ray emission and emission line imaging shows that NGC 3079 hosts a superwind (Veilleux et al., 1994; Cecil et al., 2001, 2002). Superwinds are believed to be generated when the kinetic energy from supernovae and massive stellar winds are transformed into thermal energy. The heated gas then expands into the lower pressure ambient medium. The direction of the steepest pressure gradient is along the minor axis. The hot gas is easily traced by the X-ray emission, which is a more direct tracer compared to the emission line gas, which is generated at shock fronts as a result of the interaction with the ambient medium. The emission line ratios seen in superwinds are typical of shock-ionized gas as also seen in the case of NGC 3079 (Veilleux et al., 1994). Although these authors favored a starburst-wind origin for the radio lobes, they were not able to rule out AGN-driven winds. Several authors favored the jet origin of the lobes (Irwin & Seaquist, 1988; Irwin & Saikia, 2003). Irwin et al. (2017) find that NGC 3079 is one of the few edge-on galaxies in the CHANG-ES sample (Irwin et al., 2012) which shows radio lobes that stand out in polarized intensity compared to the galactic disk emission which is not as highly polarized.
Sofue et al. (2001); Miyamoto et al. (2015); Lin et al. (2016) have studied the molecular constitution and kinematics of NGC 3079 using various molecular lines in both emission and absorption. Many of these studies present evidence for blue-shifted features or blue-wings which was readily associated with outflowing molecular gas. Shafi et al. (2015) present evidence for outflowing HI gas. These authors propose that large amounts of cold gas, both molecular and atomic, is being blown out along with the ionized gas. They find that both the AGN and starburst scenarios are powerful enough to drive such outflows. They also point out that such multi-phase gas outflows are being discovered in several AGN driven outflows. The presence of a nuclear starburst in NGC 3079 was contested by Hawarden et al. (1995). They suggest that the molecular gas outflows are driven by the AGN rather than a starburst.
Despite the abundance of literature on NGC 3079, a consensus has not yet been reached regarding the origin of the kpc sized radio emission. In this paper, we present a polarization-sensitive radio study of NGC 3079 with the historical and expanded VLA, at multiple radio frequencies and array configurations. We attempt to disentangle the contribution of the starburst, AGN winds and the jet in the formation of double-lobed structure in NGC 3079. Throughout this paper, we assume =73 km s-1Mpc-1, and . At the distance of NGC 3079, 1 corresponds to 0.084 kpc. Spectral index is defined such that flux density at frequency is .
2 Observations and Data Analysis
2.1 VLA Data from 1995
We observed NGC 3079 with the VLA at 1.5 and 4.9 GHz with the A, B and C-array configurations in (Project ID: AB740). 3C 286 and 3C 48 were used as the primary flux density as well as the polarization calibrators, while 1035+564 was used as the phase calibrator for the whole experiment. The data were processed with AIPS using standard imaging and self-calibration procedures. Table LABEL:tab1 lists the observing frequency, the corresponding bandwidth, the VLA configuration, the observation date, the FWHMs of the synthesized beams, the total flux densities of the source at the corresponding resolution and the rms noise of the final images. AIPS task PCAL was used to solve for the antenna “leakage” terms (D-terms) as well as polarization of the calibrators 3C 286 and 3C 48. The leakages were typically a few percent. Polarization calibration of the 4.9 GHz A-array data was unsuccessful. This was a consequence of not having acquired enough scans of the polarization calibrator for adequate parallactic angle coverage; there were only two scans of 3C 286.
The polarization intensity (PPOL) and polarization angle (PANG) images were created by first running the task IMAGR for Stokes ‘Q’ and ‘U’ and then combining these images using the task COMB. Pixels with intensity values below 3 and angle errors were blanked before making PPOL and PANG images, respectively. Fractional polarization images were created using the PPOL and total intensity images where pixels with errors were blanked. We created two-frequency spectral index images using the AIPS task COMB after convolving images at both frequencies with the same circular beam (). Pixels with total intensity value below 3 were blanked before making the spectral index image. Rotation measure images were created using three frequencies using AIPS tasks MCUBE, TRANS, and RM. For this, we split the two IF data at L-band (IF1 = 1.465 GHz, IF2 = 1.385 GHz) and used the C-band (frequency = 4.860 GHz) data as such. Images were made after first convolving all images with the same circular beam (). Pixels with errors were blanked while making the polarization angle images (PANG) shown in Figure 3. We created depolarization (DP) images by dividing the fractional polarization images at 1.42 GHz and 4.86 GHz using the task ’COMB’. We blanked pixels with fractional errors before making the DP image shown in Figure 7.
2.2 EVLA Data from 2018
New polarization-sensitive EVLA data at 5 GHz were acquired in 2018 (project ID: 17B074; see Table LABEL:tab1) using the BnA array configuration. 3C286 and 1035+564 were observed as the primary flux + polarization calibrator and phase calibrator respectively. OQ208, which is a strong unpolarized source was observed to calibrate the polarization leakages. Data were reduced using CASA version 5.1.2-4. Basic calibration and editing of the data were carried out using the CASA pipeline for EVLA data reduction. Polarization calibration was performed on the pre-calibrated data. The model of 3C 286 was defined using the model parameters which were fed manually to the task ‘setjy’. The model parameters required for completely defining the source model included the stokes I flux density at the reference frequency, the spectral index, the coefficients of the Taylor expansion of both the degree of linear polarization as a function of the frequency about the reference frequency and the reference frequency itself. The polarization angle of 3C 286 appears to be a constant across frequencies whereas the degree of polarization varies across frequencies. Therefore we estimated the coefficients by fitting a first-order polynomial using the data from Perley & Butler (2013). The cross-hand delays between both the polarizations were corrected. The leakage terms per channel were solved using the CASA task ‘polcal’ with the unpolarized source OQ208. The polarization angle was calibrated using the known polarization angle of 3C286.
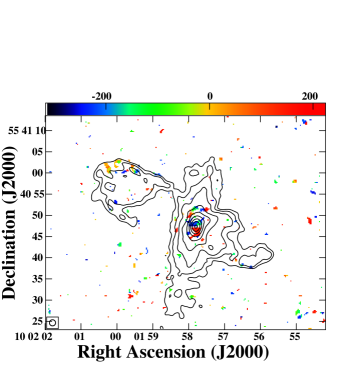
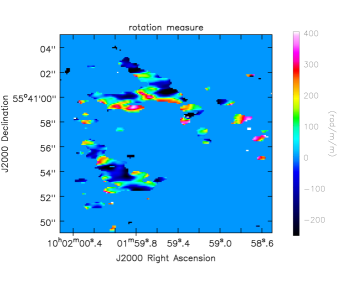
The target NGC 3079 was then SPLIT out before imaging. We made use of the MT-MFS algorithm in CASA while cleaning to take care of the wideband effects. Imaging and phase-only self-calibration were performed iteratively for three times before a final round of A&P self-calibration and imaging was performed. The stokes ‘Q’ and ’U’ images were made using the final calibrated UV-data file. The EVLA data had 16 spectral windows spanning a bandwidth of 2 GHz. The data set was then divided into four chunks each consisting of 4 spectral windows. The ‘QU’ stokes image cubes of these data sets were then created using task ‘tclean’ in CASA. We have corrected the polarized emission for Ricean bias using the AIPS task COMB. Finally, the task ‘rmfit’ was used to make an in-band rotation measure image from these cube images. The RM image obtained is shown in 6. The pixels where the errors are greater than 200 rad m-2 were blanked. The RM image is shown in the left panel of figure 6.
| Frequency | Bandwidth | VLA Array | Observation | Beam, PA | Total Flux Density | r.m.s. |
|---|---|---|---|---|---|---|
| (GHz) | (MHz) | Configuration | Date | (arcsec2, ) | (mJy) | (Jy beam-1) |
| 4.86 | 50 | A | 07/21/1995 | 0.450.31, 81.1 | 99.4 | 27 |
| 4.86 | 50 | B | 11/02/1995 | 0.580.43, 85.8 | 161.0 | 16 |
| 1.42 | 50 | A | 07/03/1995 | 1.451.19, | 509.0 | 53 |
| 1.42 | 50 | C | 02/17/1996 | 14.8213.03, 62.2 | 838.0 | 80 |
| 5.50 | 2048 | BnA | 02/16/2018 | 1.100.47, | 260.3 | 8.6 |
3 Radio Morphology: Lobes, Ring, Galaxy
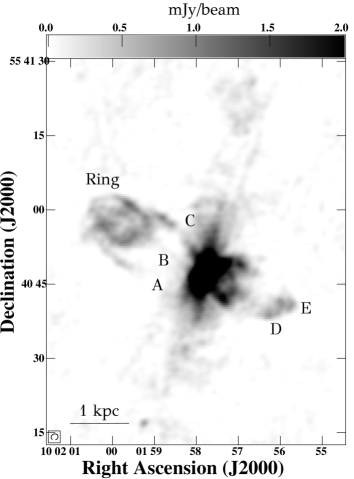
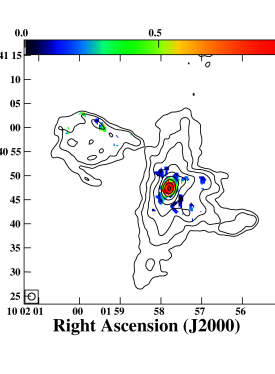
The total intensity and linearly polarized emission images for NGC 3079 are presented in Figures 1 to 3. The 1.4 GHz image in Figure 1 (right panel) shows the north-eastern lobe with an extent of 27 (=2.3 kpc) and the south-western lobe with an extent of 20 (=1.7 kpc) in exquisite detail, especially the extremely filamentary nature of the lobes. The north-eastern lobes show three distinct filaments annotated as A, B and C two of them forming the “edges” of the radio bubble/lobe. The filament at the southern edge (A) extends up to the top edge of the lobe. This filament shows increased brightness towards the top edge of the lobe. The northern filament (C) can also be traced till the lower end of the “ring-like” structure after which the trajectory is not clear. This filament also appears brighter, farther away from the core. It is probable that the “ring” is a 3D-shell-like structure seen in projection. The “ring-like” feature at the top of the north-eastern lobe appears to be comprised of additional radio filaments. They are the brightest filaments and do not appear to be connected to the center of the galaxy.
The south-western lobe, on the contrary, is not comprised of as many filamentary structures. Yet, the edges of the lobe, especially at the base, appear brighter compared to the emission from the inner parts. Further away, towards the southernmost tip, there is an increase in brightness where two filaments, namely E and D, undergo bending and point towards the nuclear core. Unlike the north-eastern lobes, there are no standalone filamentary structures apparently disconnected from the core.
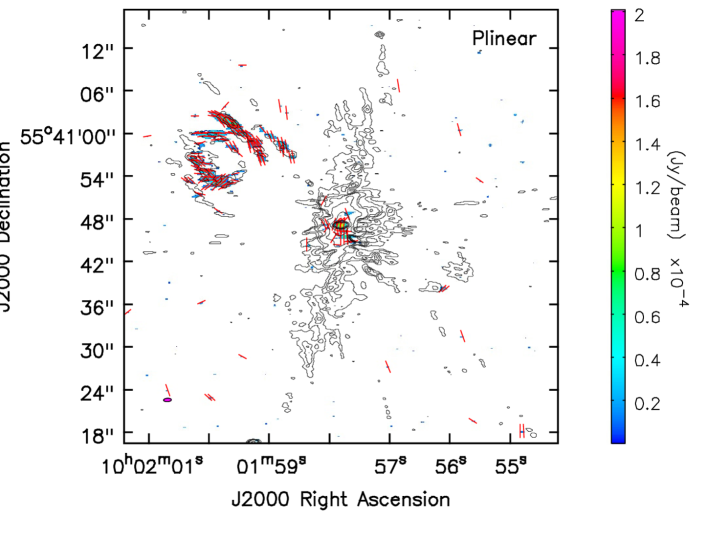
. Contour levels represent 25.5(2, 4, 6, 8, 16, 64, 256, 512, 1024) Jy beam-1. The beam shown in the bottom left corner as a filled magenta ellipse is of size and P.A. is .
3.1 Host Galaxy Emission
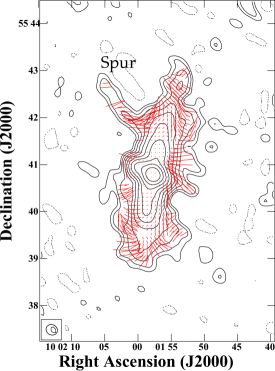
Figure 4 shows a higher resolution image (VLA A-array 5 GHz) and a lower resolution image (VLA C array 1.4 GHz). The lower resolution image reveals the large extent of host galaxy radio emission. The lobes are seen embedded slightly above the disk in the low-resolution view. Apart from the lobes, there are several features which protrude out of the disk. A prominent spur-like feature is seen rising up to 8 kpc above the disk at nearly 4 kpc in the north-east direction along the disk from the center. It is also interesting to note that most of these protrusions are highly polarized. Such spurs were previously seen in other starburst systems hosting a radio halo like NGC 253 (Carilli et al., 1992). They suggest that the material from the disk gets convected up and is driven by both cosmic ray pressure as well as thermal pressure. The protrusion can also be explained as galactic fountains (Shapiro & Field, 1976; Bregman, 1980).
The 615 MHz GMRT image by Irwin & Saikia (2003) shows an entire loop-like structure coming out of the disk plane of the galaxy. The ‘spur’ appears spatially coincident with the eastern-most edge of the loop. At the lower frequency, the halo comprises of much more extended structures than seen in our own images, whereas the ‘ring’ is seen clearly even in our higher frequency maps. The higher resolution image does not show any lobe emission whereas the emission from the disk which is aligned very well with the outer disk is very prominent.

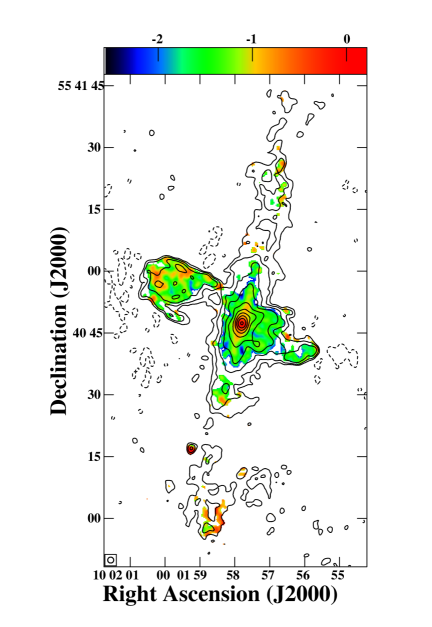
3.2 Spectral and Polarization properties
The 1.4 GHz - 5 GHz spectral index image of NGC 3079 is shown in Figure 5. The spectrum is mostly steep (mean ) except at the core. The spectral index image shows that the inner parts of the disk have a flatter spectrum compared to the rest of the source. The core possesses a flat spectrum (alpha ) pointing towards current AGN activity as is substantiated by the presence of a relativistically moving VLBI jet (Irwin & Seaquist, 1988; Trotter et al., 1998; Sawada-Satoh et al., 2000; Middelberg et al., 2007). The spectral index image also reveals regions of flat spectrum along the edges of the ring. The spectral index becomes as flat as -0.5 in certain locations along the edges.
The fractional polarization () images reveal the “ring” to have at L-band and at C-band. For the central part of the galaxy showing polarization, we find at L-band and at C-band. For the L-band C-array image with a resolution of where the KSR is not clearly resolved (Figure 4), we find that the average fractional polarization is . Interestingly, the “spur” like feature to the north-east of the host galaxy disk is very highly polarized: . Images made with fractional polarization pixels blanked for errors greater than 20% suggest that at L-band, the “ring” and the galaxy have % and %, respectively, and at C-band, the “ring” and the galaxy have % and %, respectively.
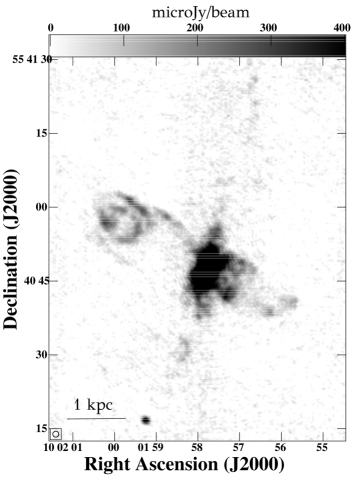
The new EVLA image at 5 GHz mostly detects the ring-like feature (Figure 3); the fractional polarization is in the “ring” and in the galaxy. The filaments comprising the “ring” are more clearly delineated in the new image in polarized light. Our in-band RM image indicates that the average RM values are in the range of rad m-2, similar to what was previously observed in the “ring” by (Cecil et al., 2001).
The three-frequency RM image (see figure 6 left panel) reveals an RM = +150 rad m-2 with an error of 30 rad m-2, for the southern part of the host galaxy emission. For the western jet region, RM = rad m-2 with an error of 15 rad m-2. We have also estimated the depolarization parameter, DP, as DP=, where and are the fractional polarization at low and high frequencies, respectively. The DP image is shown in Figure 7. A higher value of DP implies lower depolarization. We find that the average DP = 0.3 in the “ring”, and 0.4 in the galaxy; the average DP approaches 0.8 in the central regions of the galaxy. The higher depolarization around the ring could be suggestive of greater confinement.
4 Energetics of Radio lobes
NGC 3079 has a flared and clumpy accretion disk (Hu, 2008) with detections of water maser emission on milliarcsec scales (Kondratko et al., 2000). Kondratko et al. (2000) have estimated a black hole mass of 2 in NGC 3079 using a VLBA study of water masers within a radius of 0.4 pc. Iyomoto et al. (2001) find that X-ray emission is heavily obscured and the luminosity after correction for absorption turns out to ergs s-1. This luminosity would imply that the source is accreting at a rate of 0.01 to 0.1 times its Eddington luminosity. The accretion rates are consistent with that seen in Seyfert galaxies (Ho, 2008).
The parameters derived from our radio observations of NGC 3079 are listed in Table LABEL:tab3. The parameters derived were total radio luminosity (), magnetic field at minimum pressure (), minimum energy (), minimum pressure (), total energy (), energy per unit volume for a given filling factor or energy density () and electron lifetime from synchrotron and inverse Compton (over CMB) radiative losses (). The minimum pressure parameters were estimated for the north-east lobes, south-west lobes, and the galactic disk separately using equations (1)-(5) from O’Dea & Owen (1987). The lifetimes were estimated using the relation given in Pérez-Torres & Alberdi (2007).
The B-array image at 5 GHz and the A-array image at 1.4 GHz were used while estimating the flux densities as these images had matched baseline coverages. These images were then convolved with the same beam size. Rectangular regions were used for estimating the flux densities. The radio spectrum was assumed to extend from 10 MHz to 10 GHz. The proton to electron energy ratio was assumed to be unity. However, Beck & Krause (2005) have noted that protons are more dominant than electrons according to currently proposed mechanisms for the origin of cosmic rays. In this scenario, our magnetic field values will be underestimated by a factor of , where is the ratio of proton to electron number densities. Hence, for typical values of spectral indices seen in the lobes of NGC 3079 (1) and assuming =100, the magnetic fields are underestimated by a factor of 3. However, in the lobes of radio galaxies, the classical equipartition magnetic fields often match with those measured from X-rays (Brunetti et al., 1997), justifying our choice of K0. Table LABEL:tab3 lists the parameters corresponding to a volume filling factor () values of 1, 0.5 and (Blustin & Fabian, 2009).
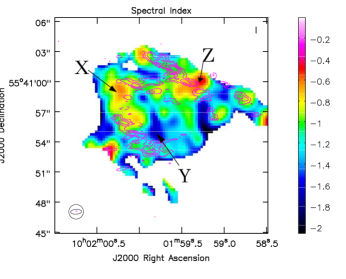
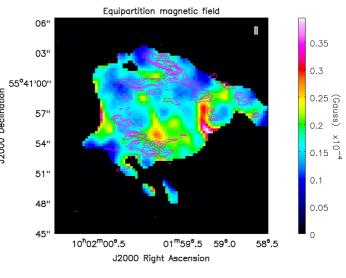
To further investigate the underlying mechanism we derive the equipartition magnetic fields for every pixel in a similar manner. A spatially resolved image of the spectral index was made instead of assuming an average spectral index value. A volume filling factor equal to unity was used. A cylindrical volume with a height equal to the width of the lobe (0.8 kpc) was assumed. The radius of the cylinder was chosen to be the same as that of the synthesized beam of the image. The pixels with flux density less than 3 were blanked. The spectral index image and the magnetic field image of the source are shown in Figure 8. The EVLA polarized intensity image at 5 GHz is shown overlaid in contours. The spectral index image shows flatter spectral indices along the ring.
The spectral index and the magnetic field structure is quite complex. Several regions along the ring-like those marked X & Z in Figure 8, shows flat spectrum, whereas region Y show steep spectrum. Region Y forms the inner part of the ring as seen at 1.4 GHz. The width of the ring is not as large at 5 GHz, where most of the emission is confined to the outer edges where the spectral indices are flatter as well. Region Y also shows high magnetic field values though polarized emission is not detected at 5 GHz probably because of the steep spectrum which reduces the total intensity and thereby polarized flux density or because of the absence of ordered magnetic fields or both.
| Component | |||||||
| (erg/s) | (Gauss) | (ergs) | (dynes/cm2) | (ergs) | (ergs/cm3) | (Myrs) | |
| filling factor = 1.0 | |||||||
| NE lobes | 3.0 | 3.88 | 1.49 | 1.40 | 1.86 | 3.0 | 2.74 |
| SW lobes | 5.0 | 4.75 | 1.63 | 2.10 | 2.03 | 4.5 | 2.03 |
| Disk | 5.0 | 3.59 | 2.52 | 1.2 | 3.15 | 2.6 | 3.07 |
| filling factor = 0.5 | |||||||
| 0 NE lobes | 3.0 | 4.73 | 1.10 | 2.08 | 1.38 | 4.5 | 2.04 |
| SW lobes | 5.0 | 5.79 | 1.21 | 3.11 | 1.51 | 6.7 | 1.51 |
| Disk | 5.0 | 4.38 | 1.87 | 1.78 | 2.34 | 3.8 | 2.29 |
| filling factor =1.0 | |||||||
| NE lobes | 3.0 | 0.00054 | 3.00 | 2.70 | 4.00 | 5.8 | 0.05 |
| SW lobes | 5.0 | 0.00066 | 3.00 | 4.05 | 4.00 | 8.7 | 0.04 |
| Disk | 5.0 | 0.0005 | 5.00 | 2.30 | 6.00 | 5.0 | 0.06 |
Column 1: Radio source components including the north-east (NE), southwest (SW) lobes and the galactic “Disk” minus the AGN. Column 2: Total radio luminosity. Columns 3, 4, 5 : “Mininum energy” magnetic field strength, energy and pressure, respectively. Column 6: Total energy. Column 7: Total energy density. Column 8: Electron radiative lifetimes via synchrotron and inverse Compton (over CMB) losses. See Section 4
5 The origin of the ring and filamentary morphology
In this section, we try to understand the origin of the peculiar morphology of the radio lobes in NGC 3079 using our radio observations in conjugation with the existing results from the X-ray and emission line data from the literature.
Cecil et al. (2002) find evidence for a large scale diffuse X-ray halo surrounding the radio superbubble which is delineated by filaments at wide angles. These filaments were explained as the contact discontinuity between the shocked wind and the galaxy halo gas. The inner four filaments of emission form the walls of the superbubble (Cecil et al., 2001). Cecil et al. (2001) infer that the radial velocities in these filaments increase with distance from the disk. They also find that the four filaments get disrupted at some height which was explained as a result of Rayleigh-Taylor instabilities that may develop in the case of wind-driven superbubbles.
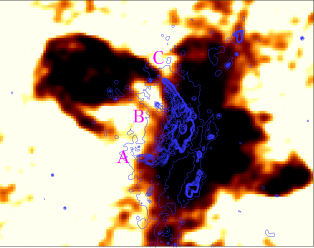
The three prominent radio filaments, (A, B and C) mentioned in Section 3, at first glance, appear to be aligned with the ionized filaments seen in the [N II] H line emission image (Cecil et al., 2001).
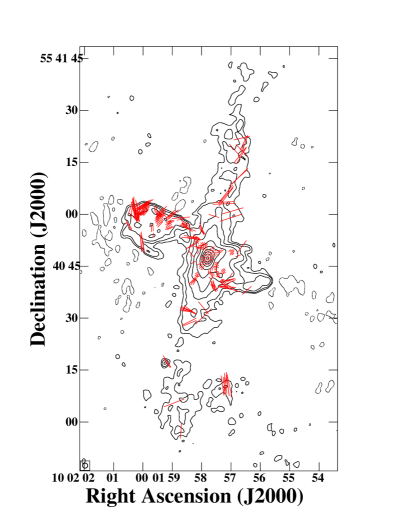
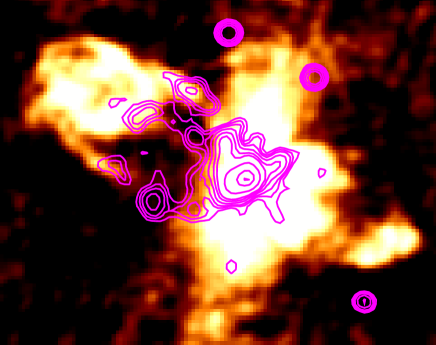
Figure 9 shows the overlay of the Hubble Space Telescope WFPC2 emission line contours and Chandra ACIS-S X-ray emission contours over the radio continuum VLA A-array image at 1.4 GHz. There is no one-to-one correspondence between the radio and the thermal emission filaments (see Figure 9).
The [N II] H line emission image shows no counterpart for the south-western lobes due to extinction, although there is soft-X-ray emission (Cecil et al., 2002). Among the three radio filaments that seemingly arise from the radio core, the filament marked C is aligned with the filaments. Such a correlation was previously seen in M82 by Adebahr et al. (2013). They suggested that this could be a proof for magnetic fields that are frozen into the ionized medium and get transported along with the superwind.
However, there are several other observational signatures in NGC 3079 that cannot be explained using a simple frozen-in magnetic field. Although partially aligned, it has to be noted that the weakest radio filament (A) corresponds to the brightest filament, which is also aligned almost along the same direction as that of the parsec-scale VLBA jet. This trend goes against the frozen-in magnetic field picture, where one would expect a correlation in the brightness of the radio and filaments. The brightest radio filament being offset from the direction of the VLBI jet also poses a problem for these filaments being powered by jets, unless the jet is changing its direction or undergoing precession. Moreover, the middle radio filament annotated B in Figure 9 does not appear to be associated with the central filament. Cecil et al. (2002) have shown that X-ray and filaments were spatially well correlated using their high-resolution images from Chandra and HST respectively. However, radio emission which is also mostly filamentary in nature does not seem to be well correlated with the thermal filaments. In the northern lobe, the closed loop like structure appears displaced northwards compared to the emission line filaments. The dearth of emission lines and X-ray emission at the topmost loop is intriguing. The radio emission also extends farther beyond the point where the emission line gas reaches a blowout phase as a result of the growth of Rayleigh-Taylor instabilities (Cecil et al., 2001).
The radio plasma and thermal emission are not completely intermixed, which would imply different sources of origin. Such lack of intermixing despite the disruption of the jet at early stages is also witnessed in X-ray cavities in clusters of galaxies, where the ambient hot gas is simply pushed aside by the expanding radio source (Bîrzan et al., 2004). Similar to NGC 3079, NGC 253, a starburst galaxy hosting superwinds possesses magnetic fields which are aligned along the filaments. Heesen et al. (2011) model the walls of the outflow cones of the galaxy to be threaded by helical magnetic fields as indicated by RM inversion. They appear as filaments in projection. But unlike NGC 3079, there are only two filaments each at the edge of the outflow cone. If the inner or radio filaments actually trace the wall of a superbubble in the case of NGC 3079, the expectations would be to see edge-brightened structures in projection or a completely filled volume rather than discrete filaments at intermediate angles.
The presence of separate filaments in between the edge filaments in NGC 3079 casts doubts over the simple picture of these being the edge of the walls seen in projection. Cecil et al. (2001) have studied the rotation measure of the northern ring of NGC 3079. They have found that the RM changes its sign from the on the inside of the ring to on the outside. We note that our EVLA in-band RM image exhibits average RM values in the same range and also shows the RM inversion. In our RM image of the northern lobe (see Figure 6) we see the RM inversion in individual filaments on the right hand side although the polarized emission with positive RM has not yet been recovered.
Below we consider plausible physical mechanisms that might be a playing a role in the formation of the “ring” in NGC 3079.
5.1 Shock compression at the boundaries of an expanding superbubble
Duric & Seaquist (1988) propose that shocks at the interface between ambient medium and the outflow would be a natural consequence of the supersonic velocities derived for the winds present in NGC 3079. Several features seen in the ring of NGC 3079 are suggestive of the presence of a shock. With our better resolution images, it can be seen that the ring-like structure is also comprised of several filaments. The entire structure is reminiscent of a supernova remnant shell. Shocks can produce synchrotron emission via diffusive shock acceleration (DSA) or Fermi first order acceleration (Blandford & Eichler, 1987). The power-law index of the energy distribution of the particles is determined by the strength of the shock, which can be described using the Mach number.
The flattening in the spectral index along the ridges of the ring at various locations might point towards the reacceleration of charged particles (see Section 3.2). The spectral index image shows that the spectrum is as flat as -0.5 at several locations which match with the mean spectral index values typically seen in galactic supernova remnants (Klein et al., 2018).
By using the spectral age of 2.8 Myr (see Table LABEL:tab3) and an outflow length of 2.3 kpc, we obtain a wind velocity of 800 km s-1. Since the velocity of the wind increases with the distance from the disk (Cecil et al., 2001), our wind velocity represents an average value of the projected wind velocities at various distances above the disk. The thermal gas traced by emission lines exhibits radial velocity that increases with distance from the disk to attain velocities as high as 1000 km s-1 (Veilleux & Osterbrock, 1987; Cecil et al., 2001). Since most of the radio emission is from above the emission-line complex and assuming that the radio emission is coexisting with the superwind we can assume a radial velocity of 1000 km s-1 for the radio outflow as well. Hence, the total velocity of the radio outflow is km s-1.
The sound speed in the hot wind regions present in typical starbursts is about 100 km s-1 (Romero et al., 2018). Hence the sonic Mach number turns out to be 12. The spectral index, depends on the Mach number of the shock (Blandford & Eichler, 1987; van Weeren et al., 2016) as the following
| (1) |
For a sonic Mach number of 12, we obtain . Hence the shock present in NGC 3079 is strong enough to produce the spectral index values as flat as that seen in NGC 3079 from an underlying thermal distribution of electrons.
It is also possible that an already existing relativistic population of electrons gets reaccelerated at the shock front. Detailed DSA simulations would be required to understand the contribution of the reacceleration of an already existing relativistic electron population.
Shock compression often leads to the ordering of the tangled or turbulent magnetic fields that permeate the ambient medium. The magnetic fields parallel to the shock front get amplified leading to high degrees of polarized emission aligned perpendicular to the shock fronts (Laing, 1980; Ensslin et al., 1998). The northern ring shows high fractional polarization compared to the rest of the galaxy. The polarization vectors are also aligned perpendicular to the individual filaments as expected in the case of shock amplification. The “ring” also shows higher depolarization (see Section 3.2) which might be due to a higher Faraday depth within or in front of it (Cioffi & Jones, 1980). So either the magnetic field or electron density (or both) is higher here. It might be that the expansion of the shell (that we see projected as a ring) is sweeping up gas, so there is a denser shell of gas along the shell. It could also be that the magnetic fields are being compressed along the edges although compressing magnetic fields can lead to higher absolute polarization (Laing, 1980).
Although the conditions in NGC 3079 are favorable for the presence of shocks powerful enough to reproduce the observed spectrum, all the observed properties of NGC 3079 cannot be explained using shock acceleration. The lack of correlation between the thermal and non-thermal emission suggests different mechanisms. More importantly, the RM inversion in filaments cannot be explained solely using shock acceleration, and requires organized magnetic fields. In the next section, we consider if the draping of magnetic fields at the leading edge of the outflow can address these shortcomings.
5.2 Magnetic Draping
Bernikov & Semenov (1979); Lyutikov (2006) have pointed out that as an object moves through a weakly magnetized medium with a velocity greater than its Alfvén speed, it necessarily drags up a layer of magnetic field lines along with it. For magnetic draping to be playing a role it is required that the velocity of the wind is higher than the Alfvén velocity. Adebahr et al. (2019) show that the radio lobes of B2 0258+35 are probably being affected by magnetic draping using their polarization and HI study. We test this idea to explain the polarization structures observed in the lobes of NGC 3079.
We estimate the Alfvén velocity of the wind using the following equation.
| (2) |
where B is the magnetic field in and is the electron number density in cm-3. For the northern lobes we have estimated an equipartition magnetic field of G (see Table LABEL:tab3). Our RM images show an average RM value of 50 rad m-2. If we assume a Faraday screen path length of 100 parsecs, which is equal to the widths of the filaments as seen in our EVLA images, the electron number density turns out to be 0.015 cm-3 by using the relation RM = rad m-2. We obtain an Alfvén velocity of km s-1. Therefore, the wind is super Alfvénic with an Alfvénic Mach number, of 1.8. Pfrommer & Jonathan Dursi (2010) suggest that the following criteria have to be met for magnetic draping to occur,
| (3) |
.0where is the magnetic coherence length. The thickness of the polarized filaments in our image which is about 100 pc can be regarded as a lower limit of the magnetic coherence length. Assuming a radius of curvature, R 0.4 kpc, we obtain a value for the ratio of which is greater than the magnetic coherence length. Therefore, magnetic draping might not be a viable mechanism in the case of NGC 3079.
Guidetti et al. (2011) have suggested that RM inversion could be produced by magnetic field draping. However, it is not clear how any supersonic outflow which forms a draped magnetic field layer at its edge, can lead to a dome-like structure as observed in the northern lobe of NGC 3079, rather than a conical structure. Hence, we suggest that magnetic field draping does not play a significant role in the formation of the lobes in NGC 3079.
5.3 Filaments as magnetic flux tubes
Cecil et al. (2001) put forth three explanations for the observed RM inversion. In their first model, they consider that the wind entrains material from the cold disk with a frozen in magnetic field which is transported upstream and gives rise to the positive RM values. Once the disk material cools down the material starts falling back resulting in the reverse fields.
Secondly, they consider a globally ordered magnetic field of the halo, which surrounds the wind. The negative RM results from the compressed halo gas whereas the outflowing wind contributes to the positive RM. In both these models, the outer shells lead to a positive RM while material inside leads to negative RM. However, as they had pointed out in Section 3.5 of their paper, Faraday rotation closely follows a dependence which rules out a Faraday rotating medium within the synchrotron source. Therefore it is unlikely that the outflowing wind enclosed within either the host galaxy halo or the wind material that is falling back to the disk is giving rise to the positive RM.
They propose a third scenario which is similar to the solar prominence. Here, we consider the possibility of these being actual standalone filaments, in which case the RM inversion seen in the individual filaments can be easily explained using a helical magnetic field structure. The Faraday rotation is probably introduced by a sheath around the filaments with increased particle density and width about 10 % of the filament size itself. The sheath which is threaded by a helical magnetic fields can introduce such an inversion. A helical magnetic field morphology is often invoked to explain the RM inversion seen in VLBI scale jets (Kharb et al., 2009; Clausen-Brown et al., 2011; Pudritz et al., 2012).
Henriksen (2019) suggested that galaxies possess force-free magnetic fields that are generated by the dynamo action; cosmic rays are transported in a direction parallel to the magnetic field lines under force-free conditions. Dome-like structures, as seen in NGC 3079, and the active regions in the Sun, can be reproduced by some of the solutions.
The morphology of radio filaments that are anchored to the core is especially reminiscent of the non-thermal radio filaments found in the Galactic center (Morris et al., 2014). The Galactic center filaments also possess organized magnetic fields often aligned along the filament, similar to that seen in NGC 3079. It is in principle possible that these filaments are magnetic flux tubes through which the relativistic material is transported from the core to the top.
Interestingly, it can also be inferred from Figure 1 that the middle filament, B is steeper compared to the edge filaments. The edge filaments might be tracing the shocked walls whereas the filament B might have a different source of origin and is completely unrelated to the other two filaments. This seems unlikely given the similarity in morphology. It is however possible that all the filaments are directed by the same dynamo mechanisms whereas the edge filaments are also being acted upon by shocks leading to a flatter spectrum. Hence, we conclude that this model successfully explains the structures and the RM inversion observed in NGC 3079.
6 Role of the jet in inflating the radio bubble
Irwin & Seaquist (1988) argue that the large scale radio lobes and the VLBI scale jet are unusual in spiral galaxies and are therefore probably related. In this section, we investigate the role of the jet in actually inflating the radio bubbles.
Radio halos were discovered in several starburst galaxies (Ekers & Sancisi, 1977; Allen et al., 1978; Carilli et al., 1992; Duric et al., 1998). These were believed to be composed of the material that was convected up from the central starburst regions, where it was created by supernovae (Lerche & Schlickeiser, 1980). However, these radio halos which are purely powered by starbursts have a very different morphology compared to NGC 3079 (Colbert et al., 1996). These radio halos are more spherical and diffuse whereas NGC 3079 shows two distinctly directional lobes. The low-resolution images of NGC 3079 show more extended and diffuse structures at lower frequencies (see Section 3.1) indicating a steep spectrum in the halo compared to the central ‘ring’. Hence, the nuclear lobes are distinct from the rest of the halo emission arising from the star-formation activity in NGC 3079.
Star formation rates (SFR) from the radio flux density of north-east lobes, south-west lobes and the disk are 2.58, 2.14 and 17.87 M☉ yr-1 respectively (using the relations in Condon et al., 2002) for stars more massive than 0.1 M☉. Yamagishi et al. (2010) have estimated SFR using AKARI far-infrared data. They find that the SFR is 5.6 M☉ yr-1 in total and 2.6 M☉ yr-1 in the central 4 kpc region. The SFR estimated in the east and west lobes together exceed that estimated from IR emission in the central regions by about a factor of 2. Therefore, it is unlikely that the lobes are composed of plasma that is accelerated solely by supernovae and stellar winds. A certain contribution from the jet is inevitable unless the radio emission is generated as a result of in-situ particle acceleration in the lobes due to shocks (see Section 5.1).
Energy and pressure requirements of the radio lobe can provide constraints on the origin of the bubble. Duric & Seaquist (1988) invoke accretion along with a nuclear starburst due to the very high rates of star formation required to meet the energy budget. Although the AGN at the core is weak, the radio jet on VLBI scales, as was pointed out by Irwin & Seaquist (1988), is capable of powering the superbubble.
Irwin & Seaquist (1988) compare the momentum flux that is required to feed the kpc-scale radio lobes to the pc-scale jets. They find that the momentum flux of the pc-scale jets is while that of the north-eastern radio lobe is . However, these values are three orders in magnitude lower compared to the wind model parameters of Duric & Seaquist (1988). Following Irwin & Seaquist (1988) we assume a slab volume with size 1.1 kpc. We find a momentum flux value of for the north-eastern lobe for a filling factor value of 1.0. Irwin & Seaquist (1988) pointed out that the momentum flux of the lobes derived is a lower limit owing to the underlying minimum energy assumption. When we use a filling factor value of (Blustin & Fabian, 2009) we find a momentum flux value of , which is comparable to the momentum flux derived from wind model parameters (Duric & Seaquist, 1988). Interestingly, for the volume filling factor of , the radio lobes are overpressured with respect to the surrounding hot gas (e.g., see Heckman et al., 1990).
Shafi et al. (2015) estimate the jet power of NGC 3079 using various relations that connect radio luminosities to jet power. Their estimated value of 1041 ergs s-1 is two orders of magnitude lower than that required by the wind model in Duric & Seaquist (1988). However the uncertainties in the relations used for conversion is often high that this difference is consistent with the wind model within error bars.
The radio continuum emission in NGC 3079 is very different from the typical jet lobe morphology seen in powerful radio galaxies. Several VLBI studies had revealed that the jet in NGC 3079 is expanding with mildly relativistic speeds in the range 0.1c to 0.18c (Trotter et al., 1998; Sawada-Satoh et al., 2000; Kondratko et al., 2005). It is also known that Seyfert galaxies often host very low power jets which often get disrupted or show S-shaped or twisted morphology (Ulvestad et al., 1981; Booler et al., 1982; Wilson & Ulvestad, 1982, 1983; Wehrle & Morris, 1988; Kharb et al., 2006). Precession jet model can connect the VLBI jet to the large scale lobes with a jet precession period of yrs using the precession model of Hjellming & Johnston (1981). For instance, fixing the jet speed to be the one observed on VLBI scales () yields a precession period of yrs for a precessing cone half opening angle of and jet inclination of , for the north-eastern lobe. However, one episode of precession is insufficient to explain the entire complex morphology of the jet lobe structure.
Henriksen et al. (1981) and Fiedler & Henriksen (1984) have invoked galactic pressure gradients and buoyancy to explain jet bending that produce S-shaped jets for certain viewing angles. Smith & Norman (1981) and Wilson & Ulvestad (1982) have suggested that ram pressure bending due to a rotating ISM can produce S-shaped jets. However, this idea is difficult to test in the edge-on disk of NGC 3079, where the galaxy spiral arms are not clearly seen, making it difficult to ascertain the sense of the galactic ISM rotation. It is possible that the jet in NGC 3079 got disrupted due to its interaction with the ambient medium or an accretion disk wind.
This disrupted jet material probably gets transported out along with the superwind or along the force-free magnetic field lines generated via the dynamo mechanism, or both. As discussed in Section 5, the lack of correlation of radio plasma with the superwind also suggests that the jet might be playing an important role. We conclude that the jet, the active nuclei, and the superwind together give rise to the peculiar lobe morphology in NGC 3079 which is neither similar to a typical AGN jet or a starburst radio halo.
7 Summary and Conclusions
We have carried out a multi-frequency multi-scale radio study of NGC 3079, a Seyfert 2 galaxy which also hosts a nuclear starburst. The origin of the radio continuum emission in this galaxy is widely debated. With our high resolution and high sensitivity data, we favor a scenario which involves an interplay of various processes and outflows. Our findings can be summarized as follows.
-
1.
There is no one-to-one correlation between the thermal emission (traced by X-ray and emission line) and non-thermal emission (traced by radio), which is inconsistent with magnetic fields frozen-in within the superwind hot material and being transported out.
-
2.
We propose that the filamentary structures are not merely edges of the superbubble seen in projection, but actual individual filaments (see Section 5.3). The RM inversion observed in the individual filaments can also be easily explained using such a scenario. Each filament is like a jet segment threaded by helical magnetic fields. Structures similar to those seen in NGC 3079 have been reproduced using dynamo models in the literature.
-
3.
We find that the conditions in NGC 3079 are favorable for shock acceleration to occur. However, it is insufficient to explain all the observed signatures, like RM inversion. Detailed simulations would be required to disentangle the role played by shock acceleration in the resulting morphology.
-
4.
The SFR estimated from the lobes suggest that supernovae and stellar outflows cannot feed the lobe material entirely and a contribution from the AGN jet is required. As discussed in section 5.1, shock acceleration of the thermal pool of electrons in the wind has not been ruled out. It is not entirely clear if all the emission can be accounted for by this mechanism. An observational test would be to check whether such a radio excess is seen in other starburst galaxies hosting superwinds in which an AGN core is absent.
We conclude that the AGN jet contributes to the relativistic plasma that is observed in the lobes of NGC 3079. We, therefore, propose that the radio lobes in NGC 3079 are AGN jet-related. However, the presence of starburst superwind is also indicated, and it is hard to discriminate the effects of each mechanism.
8 Acknowledgements
We thank the anonymous referee for the insightful suggestions, which led to the improvement of the manuscript. The National Radio Astronomy Observatory is a facility of the National Science Foundation operated under cooperative agreement by Associated Universities, Inc. This research has made use of the NASA/IPAC Extragalactic Database (NED) which is operated by the Jet Propulsion Laboratory, California Institute of Technology, under contract with the National Aeronautics and Space Administration. S. Baum and C. O’Dea are grateful to the Natural Sciences and Engineering Research Council of Canada (NSERC) for support.
References
- Adebahr et al. (2019) Adebahr, B., Brienza, M., & Morganti, R. 2019, A&A, 622, A209
- Adebahr et al. (2013) Adebahr, B., Krause, M., Klein, U., et al. 2013, A&A, 555, A23
- Allen et al. (1978) Allen, R. J., Baldwin, J. E., & Sancisi, R. 1978, A&A, 62, 397
- Baan & Irwin (1995) Baan, W. A., & Irwin, J. A. 1995, ApJ, 446, 602
- Baum et al. (1993) Baum, S. A., O’Dea, C. P., Dallacassa, D., de Bruyn, A. G., & Pedlar, A. 1993, ApJ, 419, 553
- Beck & Krause (2005) Beck, R., & Krause, M. 2005, Astronomische Nachrichten, 326, 414
- Bernikov & Semenov (1979) Bernikov, L. V., & Semenov, V. S. 1979, Geomagnetism and Aeronomy, 19, 671
- Bîrzan et al. (2004) Bîrzan, L., Rafferty, D. A., McNamara, B. R., Wise, M. W., & Nulsen, P. E. J. 2004, ApJ, 607, 800
- Blandford & Eichler (1987) Blandford, R., & Eichler, D. 1987, Phys. Rep., 154, 1
- Blustin & Fabian (2009) Blustin, A. J., & Fabian, A. C. 2009, MNRAS, 396, 1732
- Booler et al. (1982) Booler, R. V., Pedlar, A., & Davies, R. D. 1982, MNRAS, 199, 229
- Bregman (1980) Bregman, J. N. 1980, ApJ, 236, 577
- Brunetti et al. (1997) Brunetti, G., Setti, G., & Comastri, A. 1997, A&A, 325, 898
- Carilli et al. (1992) Carilli, C. L., Holdaway, M. A., Ho, P. T. P., & de Pree, C. G. 1992, ApJ, 399, L59
- Cecil et al. (2002) Cecil, G., Bland-Hawthorn, J., & Veilleux, S. 2002, ApJ, 576, 745
- Cecil et al. (2001) Cecil, G., Bland-Hawthorn, J., Veilleux, S., & Filippenko, A. V. 2001, ApJ, 555, 338
- Cioffi & Jones (1980) Cioffi, D. F., & Jones, T. W. 1980, AJ, 85, 368
- Clausen-Brown et al. (2011) Clausen-Brown, E., Lyutikov, M., & Kharb, P. 2011, MNRAS, 415, 2081
- Colbert et al. (1996) Colbert, E. J. M., Baum, S. A., Gallimore, J. F., O’Dea, C. P., & Christensen, J. A. 1996, ApJ, 467, 551
- Condon et al. (2002) Condon, J. J., Cotton, W. D., & Broderick, J. J. 2002, AJ, 124, 675
- Croton et al. (2006) Croton, D. J., Springel, V., White, S. D. M., et al. 2006, MNRAS, 365, 11
- de Bruyn & Wilson (1976) de Bruyn, A. G., & Wilson, A. S. 1976, A&A, 53, 93
- Duric et al. (1998) Duric, N., Irwin, J., & Bloemen, H. 1998, A&A, 331, 428
- Duric & Seaquist (1988) Duric, N., & Seaquist, E. R. 1988, ApJ, 326, 574
- Ekers & Sancisi (1977) Ekers, R. D., & Sancisi, R. 1977, A&A, 54, 973
- Ensslin et al. (1998) Ensslin, T. A., Biermann, P. L., Klein, U., & Kohle, S. 1998, A&A, 332, 395
- Fiedler & Henriksen (1984) Fiedler, R., & Henriksen, R. N. 1984, ApJ, 281, 554
- Gallimore et al. (2006) Gallimore, J. F., Axon, D. J., O’Dea, C. P., Baum, S. A., & Pedlar, A. 2006, AJ, 132, 546
- Gallimore et al. (1996) Gallimore, J. F., Baum, S. A., O’Dea, C. P., & Pedlar, A. 1996, ApJ, 458, 136
- Guidetti et al. (2011) Guidetti, D., Laing, R. A., Bridle, A. H., Parma, P., & Gregorini, L. 2011, MNRAS, 413, 2525
- Hawarden et al. (1995) Hawarden, T. G., Israel, F. P., Geballe, T. R., & Wade, R. 1995, MNRAS, 276, 1197
- Heckman et al. (1990) Heckman, T. M., Armus, L., & Miley, G. K. 1990, ApJS, 74, 833
- Heesen et al. (2011) Heesen, V., Beck, R., Krause, M., & Dettmar, R.-J. 2011, A&A, 535, A79
- Henriksen (2019) Henriksen, R. 2019, Galaxies, 7, 53
- Henriksen et al. (1981) Henriksen, R. N., Vallee, J. P., & Bridle, A. H. 1981, ApJ, 249, 40
- Hjellming & Johnston (1981) Hjellming, R. M., & Johnston, K. J. 1981, ApJ, 246, L141
- Ho (2008) Ho, L. C. 2008, ARA&A, 46, 475
- Hu (2008) Hu, J. 2008, MNRAS, 386, 2242
- Irwin et al. (2012) Irwin, J., Beck, R., Benjamin, R. A., et al. 2012, AJ, 144, 43
- Irwin et al. (2019) Irwin, J., Wiegert, T., Merritt, A., et al. 2019, arXiv e-prints, arXiv:1905.05160
- Irwin & Saikia (2003) Irwin, J. A., & Saikia, D. J. 2003, MNRAS, 346, 977
- Irwin & Seaquist (1988) Irwin, J. A., & Seaquist, E. R. 1988, ApJ, 335, 658
- Irwin et al. (2017) Irwin, J. A., Schmidt, P., Damas-Segovia, A., et al. 2017, MNRAS, 464, 1333
- Iyomoto et al. (2001) Iyomoto, N., Fukazawa, Y., Nakai, N., & Ishihara, Y. 2001, ApJ, 561, L69
- Kharb et al. (2009) Kharb, P., Gabuzda, D. C., O’Dea, C. P., Shastri, P., & Baum, S. A. 2009, ApJ, 694, 1485
- Kharb et al. (2010) Kharb, P., Hota, A., Croston, J. H., et al. 2010, ApJ, 723, 580
- Kharb et al. (2006) Kharb, P., O’Dea, C. P., Baum, S. A., Colbert, E. J. M., & Xu, C. 2006, ApJ, 652, 177
- Kharb et al. (2014) Kharb, P., O’Dea, C. P., Baum, S. A., et al. 2014, MNRAS, 440, 2976
- Kinney et al. (2000) Kinney, A. L., Schmitt, H. R., Clarke, C. J., et al. 2000, ApJ, 537, 152
- Klein et al. (2018) Klein, U., Lisenfeld, U., & Verley, S. 2018, A&A, 611, A55
- Kondratko et al. (2000) Kondratko, P. K., Greenhill, L. J., & Moran, J. M. 2000, in Bulletin of the American Astronomical Society, Vol. 32, American Astronomical Society Meeting Abstracts, 1586
- Kondratko et al. (2005) Kondratko, P. T., Greenhill, L. J., & Moran, J. M. 2005, ApJ, 618, 618
- Laing (1980) Laing, R. A. 1980, MNRAS, 193, 439
- Lal et al. (2004) Lal, D. V., Shastri, P., & Gabuzda, D. C. 2004, A&A, 425, 99
- Lerche & Schlickeiser (1980) Lerche, I., & Schlickeiser, R. 1980, ApJ, 239, 1089
- Lin et al. (2016) Lin, M.-Y., Davies, R. I., Burtscher, L., et al. 2016, MNRAS, 458, 1375
- Lyutikov (2006) Lyutikov, M. 2006, MNRAS, 373, 73
- Middelberg et al. (2007) Middelberg, E., Agudo, I., Roy, A. L., & Krichbaum, T. P. 2007, MNRAS, 377, 731
- Middelberg et al. (2005) Middelberg, E., Krichbaum, T. P., Roy, A. L., Witzel, A., & Zensus, J. A. 2005, in Astronomical Society of the Pacific Conference Series, Vol. 340, Future Directions in High Resolution Astronomy, ed. J. Romney & M. Reid, 140
- Miyamoto et al. (2015) Miyamoto, Y., Nakai, N., Seta, M., et al. 2015, PASJ, 67, 5
- Morris et al. (2014) Morris, M. R., Zhao, J. H., & Goss, W. M. 2014, in IAU Symposium, Vol. 303, The Galactic Center: Feeding and Feedback in a Normal Galactic Nucleus, ed. L. O. Sjouwerman, C. C. Lang, & J. Ott, 369–373
- Müller-Sánchez et al. (2011) Müller-Sánchez, F., Prieto, M. A., Hicks, E. K. S., et al. 2011, ApJ, 739, 69
- O’Dea & Owen (1987) O’Dea, C. P., & Owen, F. N. 1987, ApJ, 316, 95
- Pérez-Torres & Alberdi (2007) Pérez-Torres, M. A., & Alberdi, A. 2007, MNRAS, 379, 275
- Perley & Butler (2013) Perley, R. A., & Butler, B. J. 2013, ApJS, 206, 16
- Pfrommer & Jonathan Dursi (2010) Pfrommer, C., & Jonathan Dursi, L. 2010, Nature Physics, 6, 520
- Pudritz et al. (2012) Pudritz, R. E., Hardcastle, M. J., & Gabuzda, D. C. 2012, Space Sci. Rev., 169, 27
- Riffel et al. (2013) Riffel, R. A., Storchi-Bergmann, T., & Winge, C. 2013, MNRAS, 430, 2249
- Romero et al. (2018) Romero, G. E., Müller, A. L., & Roth, M. 2018, A&A, 616, A57
- Roy et al. (1994) Roy, A. L., Norris, R. P., Kesteven, M. J., Troup, E. R., & Reynolds, J. E. 1994, ApJ, 432, 496
- Sawada-Satoh et al. (2000) Sawada-Satoh, S., Inoue, M., Shibata, K. M., et al. 2000, PASJ, 52, 421
- Schmitt et al. (2001) Schmitt, H. R., Antonucci, R. R. J., Ulvestad, J. S., et al. 2001, ApJ, 555, 663
- Schmitt & Kinney (2002) Schmitt, H. R., & Kinney, A. L. 2002, New Astronomy Review, 46, 231
- Shafi et al. (2015) Shafi, N., Oosterloo, T. A., Morganti, R., Colafrancesco, S., & Booth, R. 2015, MNRAS, 454, 1404
- Shapiro & Field (1976) Shapiro, P. R., & Field, G. B. 1976, ApJ, 205, 762
- Smith & Norman (1981) Smith, M. D., & Norman, C. A. 1981, MNRAS, 194, 771
- Sofue et al. (2001) Sofue, Y., Koda, J., Kohno, K., et al. 2001, ApJ, 547, L115
- Thean et al. (2000) Thean, A., Pedlar, A., Kukula, M. J., Baum, S. A., & O’Dea, C. P. 2000, MNRAS, 314, 573
- Trotter et al. (1998) Trotter, A. S., Greenhill, L. J., Moran, J. M., et al. 1998, ApJ, 495, 740
- Ulvestad et al. (1998) Ulvestad, J. S., Roy, A. L., Colbert, E. J. M., & Wilson, A. S. 1998, ApJ, 496, 196
- Ulvestad & Wilson (1984a) Ulvestad, J. S., & Wilson, A. S. 1984a, ApJ, 278, 544
- Ulvestad & Wilson (1984b) —. 1984b, ApJ, 285, 439
- Ulvestad et al. (1981) Ulvestad, J. S., Wilson, A. S., & Sramek, R. A. 1981, ApJ, 247, 419
- van Weeren et al. (2016) van Weeren, R. J., Brunetti, G., Brüggen, M., et al. 2016, ApJ, 818, 204
- Veilleux et al. (1994) Veilleux, S., Cecil, G., Bland-Hawthorn, J., et al. 1994, ApJ, 433, 48
- Veilleux & Osterbrock (1987) Veilleux, S., & Osterbrock, D. E. 1987, ApJS, 63, 295
- Wehrle & Morris (1988) Wehrle, A. E., & Morris, M. 1988, AJ, 95, 1689
- Wiegert et al. (2015) Wiegert, T., Irwin, J., Miskolczi, A., et al. 2015, AJ, 150, 81
- Wilson & Ulvestad (1982) Wilson, A. S., & Ulvestad, J. S. 1982, ApJ, 263, 576
- Wilson & Ulvestad (1983) —. 1983, ApJ, 275, 8
- Yamagishi et al. (2010) Yamagishi, M., Kaneda, H., Ishihara, D., et al. 2010, Publications of the Astronomical Society of Japan, 62, 1085. http://dx.doi.org/10.1093/pasj/62.4.1085