MIDLMedical Imaging with Deep Learning
\jmlrpages
\jmlryear2019
\jmlrworkshopMIDL 2019 – Extended Abstract Track
\midlauthor\NamePedro M. Gordaliza\nametag1 \Emailpmacias@ing.uc3m.es
\addr\NameJuan José Vaquero\nametag1 \Emailjuanjose.vaquero@uc3m.es
\NameSally Sharpe\nametag2 \Emailsally.sharpe@hpa.org.uk
\addr\NameFergus Gleeson\nametag3 \Emailfergus.gleeson@oncology.ox.ac.uk
\addr\NameArrate Muñoz-Barrutia\nametag1 \Emailmamunozb@ing.uc3m.es
1 Dpto.Bioingenieria e Ing. Aeroespacial, Universidad Carlos III de Madrid, Leganés, Spain
\addr2 Microbiology Services Division, Public Health England, Porton Down, England
\addr3 Oncology Department, The Churchill Hospital, Headington, Oxford, UK
A Multi-Task Self-Normalizing 3D-CNN to Infer Tuberculosis Radiological Manifestations
Abstract
We propose a learning method well-suited to infer the presence of Tuberculosis (TB) manifestations on Computer Tomography (CT) scans mimicking the radiologist reports. Latent features are extracted from the CT volumes employing the V-Net encoder and those are the input to a Feed-Forward Neural Network (FNN) for multi-class classification. To overtake the issues (e.g., exploding/vanishing gradients, lack of sensibility) that normally appear when training deep 3D models with datasets of limited size and composed of large volumes, our proposal employs: 1) At the network architecture level, the scaled exponential linear unit (SELU) activation which allows the network self-normalization, and 2) at the learning phase, multi-task learning with a loss function weighted by the task homoscedastic uncertainty. The results achieve -scores close to or above for the detection of TB lesions and a Root Mean Square Error of for the number of nodules.
keywords:
Self-Normalizing Neural Networks, multi-task, homoscedastic uncertainty1 Introduction
Tuberculosis (TB) is an infectious disease which generally affects the lungs and has a high incidence and mortality [World Health Organization and others(2018)]. Due to the severity of the pandemic, the World Health Organization (WHO) has launched an ambitious plan to eradicate TB by 2030, for which, the extraction of sensitive radiological biomarkers [Nachiappan et al.(2017)Nachiappan, Rahbar, Shi, Guy, Mortani Barbosa Jr, Shroff, Ocazionez, Schlesinger, Katz, and Hammer] is a clear need. Traditionally, radiologists through visual inspection of x-ray Computed Tomography (CT) volumes generate reports summarizing the presence of TB-related manifestations. However, using this approach for the extraction of robust TB radiological biomarkers, it is unfeasible and automation required. In recent years, the introduction of deep learning techniques has drastically contributed to this task [Wang et al.(2017)Wang, Peng, Lu, Lu, Bagheri, and Summers, Litjens et al.(2017)Litjens, Kooi, Bejnordi, Setio, Ciompi, Ghafoorian, van der Laak, van Ginneken, and Sánchez, Hinton(2018)]. For deep learning, knowledge is usually injected into the model in the form of manually segmented masks of the lung lesions. Instead, our proposal directly employs the expertise acquired by the radiologist through years of clinical practice as synthesized in tabular reports.
2 Material and Methods
Chest CT scans () acquired from male Cynomolgus macaques at , , and weeks after TB aerosol exposure were employed. First, the CT volumes were cropped [Gordaliza et al.(2018)Gordaliza, Muñoz-Barrutia, Abella, Desco, Sharpe, and Vaquero] and resampled to . During the training, data augmentation is performed (elastic transformation, addition of Gaussian noise). As labelled data, we employ the tabular reports elaborated by a radiologist ( years experienced) that contain the number of detected nodules () and binary annotations indicating the presence per lung lobe of the most common TB manifestations (e.g., cavitations, conglomerations, consolidations and trees in bud) [Nachiappan et al.(2017)Nachiappan, Rahbar, Shi, Guy, Mortani Barbosa Jr, Shroff, Ocazionez, Schlesinger, Katz, and Hammer].
2.1 Model Architecture
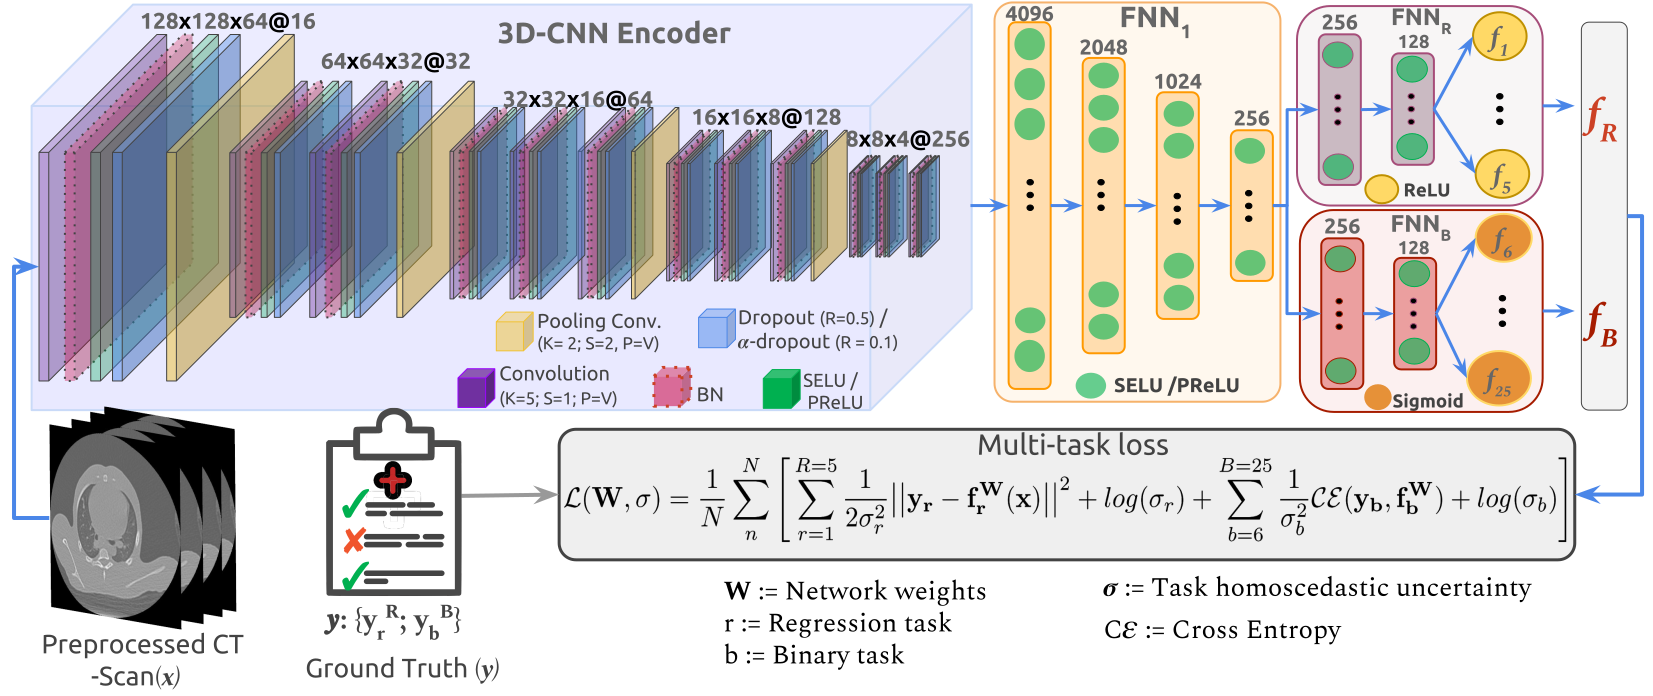
Our implementation (\figurereffig:architecture) extracts latent features from the volumes employing the V-Net [Milletari et al.(2016)Milletari, Navab, and Ahmadi] encoder. The extracted features are used as input of the Feed-Forward Neural Networks (FNNs) for multi-class classification. The encoder generates features, which feed FNN1 (task-shared). The outputs of FNN1 are employed as the input of two independent FNNs, FNNR and FNNB, corresponding with regression (nodule counting) and binary tasks. Dropout or Batch Normalization (BN) [Ioffe and Szegedy(2015)] layers are included where is needed. When employing SNN, BN is unnecessary.
fig:architecture
2.2 Self-Normalizing Neural Networks
For regularization and normalization purposes, we apply the Self-Normalizing Neural Networks (SNNs) strategy to our model [Klambauer et al.(2017)Klambauer, Unterthiner, Mayr, and Hochreiter] that preserves the activation magnitude close to zero mean and unit variance. As activation function, we use the Scaled Exponential Linear Unit (SELU) and as dropout, the -dropout [Klambauer et al.(2017)Klambauer, Unterthiner, Mayr, and Hochreiter].
2.3 Learning Principle: Uncertainty Weighted Multi-task Loss
When working in multi-task classification, the decision on the influence of each task in the final loss is non-trivial. Traditionally, the loss is computed as , where the weights are selected either manually or after an exhaustive grid search. This approach is highly influenced by the units and the scale of each task and extremely time-consuming. Recently, [Kendall et al.(2018)Kendall, Gal, and Cipolla] et al. proposed a method to compute the weights guiding each specific task loss by homoscedastic uncertainty of the predictions. In this work, we adapt this approach to our multi-label classification problem and derive a loss function for our model (\figurereffig:architecture).
3 Experiments and Results
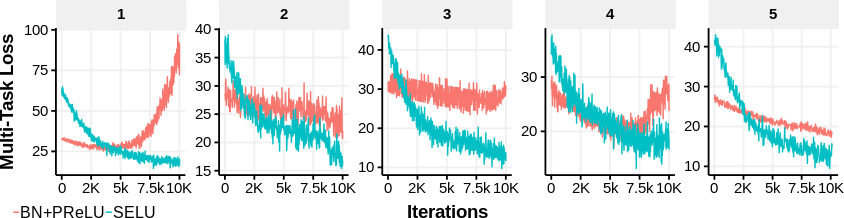
For the evaluation, we employed -fold Cross-Validation (CV): Validation set ( CT volumes of one subject); training set (remaining subjects). We compared the proposed model (SELU) and a modified version which employs a Parametric Rectified Linear Unit (PReLU), Batch Normalization and standard dropout (BN+PReLU). The models are trained with iterations of the ADAM optimizer [Kingma and Ba(2014)] (learning rate, mini-batch size). For BN+PReLU, standard parameters were employed for the ADAM optimizer and a dropout rate of . For SELU: , and alpha-dropout [Klambauer et al.(2017)Klambauer, Unterthiner, Mayr, and Hochreiter]. \figurereffig:loss_chart shows for the validation data, the loss at each fold for the BN+PReLU (in red) and the proposed model (in blue). It can be observed that SELU presents improved convergence. The inference error is estimated by the Root Mean Square Error (RMSE) for the nodules count tasks and the -score for the twenty binary tasks. \tablereftab:Fold_results presents the results per fold. No significant statistical differences were found for paired t-test (). Nevertheless, the proposed model presents better RMSE and -score results.
2gray!6white \floatcontstab:Fold_results
| \rowcolor[HTML]9B9B9B \cellcolor[HTML]343434\color[HTML]FFFFFF Manifestation/ | \cellcolor[HTML]9B9B9BNodules [RMSE] | \cellcolor[HTML]9B9B9B\color[HTML]343434 Cavitations [] | \cellcolor[HTML]9B9B9B\color[HTML]343434 Conglomeration [] | \cellcolor[HTML]9B9B9B\color[HTML]343434 Consolidation [] | \cellcolor[HTML]9B9B9BTree in bud [] | ||||||
| \cellcolor[HTML]343434\color[HTML]FFFFFF Fold | \cellcolor[HTML]C0C0C0BN+PReLU | \cellcolor[HTML]EFEFEFSELU | \cellcolor[HTML]C0C0C0BN+PReLU | \cellcolor[HTML]EFEFEFSELU | \cellcolor[HTML]C0C0C0BN+PReLU | \cellcolor[HTML]EFEFEFSELU | \cellcolor[HTML]C0C0C0BN+PReLU | \cellcolor[HTML]EFEFEFSELU | \cellcolor[HTML]C0C0C0BN+PReLU | \cellcolor[HTML]EFEFEFSELU | |
| \cellcolor[HTML]9B9B9B\color[HTML]343434 1 | |||||||||||
| \rowcolor[HTML]EFEFEF \cellcolor[HTML]9B9B9B\color[HTML]343434 2 | \cellcolor[HTML]EFEFEF | \cellcolor[HTML]EFEFEF | \cellcolor[HTML]EFEFEF | \cellcolor[HTML]EFEFEF | |||||||
| \cellcolor[HTML]9B9B9B\color[HTML]343434 3 | |||||||||||
| \rowcolor[HTML]EFEFEF \cellcolor[HTML]9B9B9B\color[HTML]343434 4 | \cellcolor[HTML]EFEFEF | \cellcolor[HTML]EFEFEF | \cellcolor[HTML]EFEFEF | \cellcolor[HTML]EFEFEF | |||||||
| \cellcolor[HTML]9B9B9B\color[HTML]343434 5 | |||||||||||
| \rowcolor[HTML]EFEFEF \cellcolor[HTML]9B9B9B\color[HTML]343434 Total | \cellcolor[HTML]EFEFEF | \cellcolor[HTML]EFEFEF | \cellcolor[HTML]EFEFEF | \cellcolor[HTML]EFEFEF | |||||||
fig:loss_chart
4 Conclusions
Although further validation on large datasets is needed, the work presents a promising inference of the radiologist reports. This is achieved with a reduced computational complexity by avoiding normalization layers and hyperparameter tuning of the loss weights.
The research leading to these results received funding from the Innovative Medicines Initiative (www.imi.europa.eu) Joint Undertaking under grant agreement no. 115337, whose resources comprise funding from EU FP7/2007-2013 and EFPIA companies in kind contribution. This work was partially funded by projects RTC-2015-3772-1, TEC2015-73064-EXP and TEC2016-78052-R from the Spanish Ministry of Economy, Industry and Competitiveness (MEIC), TOPUS S2013/MIT-3024 project from the regional government of Madrid and by the Department of Health, UK. This material is based upon work supported by Google Cloud Platform.
References
- [Gordaliza et al.(2018)Gordaliza, Muñoz-Barrutia, Abella, Desco, Sharpe, and Vaquero] Pedro M. Gordaliza, Arrate Muñoz-Barrutia, Mónica Abella, Manuel Desco, Sally Sharpe, and Juan José Vaquero. Unsupervised CT Lung Image Segmentation of a Mycobacterium Tuberculosis Infection Model. Scientific Reports, 8(1):9802, 12 2018. ISSN 2045-2322. 10.1038/s41598-018-28100-x. URL http://www.nature.com/articles/s41598-018-28100-x.
- [Hinton(2018)] Geoffrey Hinton. Deep Learning—A Technology With the Potential to Transform Health Care. JAMA, 320(11):1101, 9 2018. ISSN 0098-7484. 10.1001/jama.2018.11100. URL http://jama.jamanetwork.com/article.aspx?doi=10.1001/jama.2018.11100.
- [Ioffe and Szegedy(2015)] Sergey Ioffe and Christian Szegedy. Batch Normalization: Accelerating Deep Network Training by Reducing Internal Covariate Shift. 2 2015. URL http://arxiv.org/abs/1502.03167.
- [Kendall et al.(2018)Kendall, Gal, and Cipolla] Alex Kendall, Yarin Gal, and Roberto Cipolla. Multi-Task Learning Using Uncertainty to Weigh Losses for Scene Geometry and Semantics. In Proceedings of the IEEE Conference on Computer Vision and Pattern Recognition (CVPR), pages 1–10, 2018. URL https://arxiv.org/pdf/1705.07115.pdf.
- [Kingma and Ba(2014)] Diederik P. Kingma and Jimmy Ba. Adam: A Method for Stochastic Optimization. 12 2014. URL http://arxiv.org/abs/1412.6980.
- [Klambauer et al.(2017)Klambauer, Unterthiner, Mayr, and Hochreiter] Günter Klambauer, Thomas Unterthiner, Andreas Mayr, and Sepp Hochreiter. Self-Normalizing Neural Networks. In Advances in Neural Information Processing Systems 30, pages 971–980, 2017. URL https://papers.nips.cc/paper/6698-self-normalizing-neural-networks.pdf.
- [Litjens et al.(2017)Litjens, Kooi, Bejnordi, Setio, Ciompi, Ghafoorian, van der Laak, van Ginneken, and Sánchez] Geert Litjens, Thijs Kooi, Babak Ehteshami Bejnordi, Arnaud Arindra Adiyoso Setio, Francesco Ciompi, Mohsen Ghafoorian, Jeroen A.W.M. van der Laak, Bram van Ginneken, and Clara I. Sánchez. A survey on deep learning in medical image analysis. Medical Image Analysis, 42:60–88, 12 2017. ISSN 1361-8415. 10.1016/J.MEDIA.2017.07.005. URL https://www.sciencedirect.com/science/article/pii/S1361841517301135.
- [Milletari et al.(2016)Milletari, Navab, and Ahmadi] Fausto Milletari, Nassir Navab, and Seyed Ahmad Ahmadi. V-Net: Fully Convolutional Neural Networks for Volumetric Medical Image Segmentation. 2016 Fourth International Conference on 3D Vision (3DV), 565 - 571:565–571, 2016. 10.1109/3DV.2016.79. URL http://ieeexplore.ieee.org/document/7785132/.
- [Nachiappan et al.(2017)Nachiappan, Rahbar, Shi, Guy, Mortani Barbosa Jr, Shroff, Ocazionez, Schlesinger, Katz, and Hammer] Arun C Nachiappan, Kasra Rahbar, Xiao Shi, Elizabeth S Guy, Eduardo Mortani Barbosa Jr, Girish S Shroff, Daniel Ocazionez, Alan E Schlesinger, Sharyn I Katz, and Mark M Hammer. Pulmonary Tuberculosis: Role of Radiology in Diagnosis and Management. RadioGraphics, 37(1):52–72, 2017. 10.1148/rg.2017160032. URL https://doi.org/10.1148/rg.2017160032.
- [Wang et al.(2017)Wang, Peng, Lu, Lu, Bagheri, and Summers] Xiaosong Wang, Yifan Peng, Le Lu, Zhiyong Lu, Mohammadhadi Bagheri, and Ronald M Summers. ChestX-ray8: Hospital-scale Chest X-ray Database and Benchmarks on Weakly-Supervised Classification and Localization of Common Thorax Diseases. In Computer Vision and Pattern Recognition (CVPR), pages 3462–3471, 2017. URL https://uts.nlm.nih.gov/metathesaurus.html.
- [World Health Organization and others(2018)] World Health Organization and others. Global tuberculosis report 2018. Technical report, 2018. URL http://apps.who.int/bookorders.