2 Research Centre for Astronomy, Astrophysics, and Astrophotonics, Macquarie University, NSW 2109, Australia
3 Max-Planck-Institut für Radioastronomie, Auf dem Hügel 69, 53121 Bonn, Germany
4 Universität Heidelberg, Zentrum für Astronomie, Institut für Theoretische Astrophysik, Albert-Ueberle-Str. 2, D-69120 Heidelberg, Germany
5 Department of Physics and Astronomy, West Virginia University, Morgantown, WV 26506, USA
6 School of Physical Sciences, University of Kent, Ingram Building, Canterbury, Kent CT2 7NH, UK
7 Chalmers University of Technology, Department of Space, Earth and Environment, SE-412 93 Gothenburg, Sweden
8 Department of Physics, Indian Institute of Science, Bangalore 560012, India
9 Astrophysics Research Institute, Liverpool John Moores University, 146 Brownlow Hill, Liverpool L3 5RF, UK
10 Center for Gravitational Waves and Cosmology, West Virginia University, Chestnut Ridge Research Building, Morgantown, WV 26505, USA
11 Adjunct Astronomer at the Green Bank Observatory, P.O. Box 2, Green Bank, WV 24944, USA
12 Argelander-Institute for Astronomy, University of Bonn, Auf dem Hügel 71, 53121 Bonn, Germany
OH maser emission in the THOR survey of the northern Milky Way††thanks: The maser Table 1 is available in electronic form at the CDS via anonymous ftp to cdsarc.u-strasbg.fr (130.79.128.5) or via http://cdsweb.u-strasbg.fr/cgi-bin/qcat?J/A+A/.
Abstract
Context. OH masers trace diverse physical processes, from the expanding envelopes around evolved stars to star-forming regions or supernovae remnants. Providing a survey of the ground-state OH maser transitions in the northern hemisphere inner Milky Way facilitates the study of a broad range of scientific topics.
Aims. We want to identify the ground-state OH masers at 18 cm wavelength in the area covered by “The HI/OH/Recombination line survey of the Milky Way (THOR)”. We will present a catalogue of all OH maser features and their possible associated environments.
Methods. The THOR survey covers longitude and latitude ranges of . . and .. All OH ground state lines (J=3/2) at 1612 (F=1-2), 1665 (F=1-1), 1667 (F=2-2) and 1720 MHz (F=2-1) have been observed, employing the Very Large Array (VLA) in its C configuration. The spatial resolution of the data varies between and , the spectral resolution is 1.5 km s-1, and the rms sensitivity of the data is 10 mJy beam-1 per channel.
Results. We identify 1585 individual maser spots (corresponding to single spectral features) distributed over 807 maser sites (regions of size AU). Based on different criteria from spectral profiles to literature comparison, we try to associate the maser sites with astrophysical source types. Approximately 51% of the sites exhibit the double-horned 1612 MHz spectra typically emitted from the expanding shells of evolved stars. The separations of the two main velocity features of the expanding shells typically vary between 22 and 38 km s-1. In addition to this, at least 20% of the maser sites are associated with star-forming regions. While the largest fraction of 1720 MHz maser spots (21 out of 53) is associated with supernova remnants, a significant fraction of the 1720 MHz maser spots (17) are also associated with star-forming regions. We present comparisons to the thermal 13CO(1–0) emission as well as to other surveys of class II CH3OH and H2O maser emission. The catalogue attempts to present associations to astrophysical sources where available, and the full catalogue is available in electronic form.
Conclusions. This OH maser catalogue presents a unique resource of stellar and interstellar masers in the northern hemisphere. It provides the basis for a diverse range of follow-up studies from envelopes around evolved stars to star-forming regions and Supernova remnants.
Key Words.:
Stars: formation – ISM: clouds – ISM: kinematics and dynamic – stars: evolution – catalogs – Masers1 Introduction
Studying the Milky Way in various tracers over large spatial scales allows us to investigate the structure and physical processes in our home Galaxy in great depth. The previous decades have seen a multitude of Galactic plane surveys from long centimeter wavelengths (e.g., Becker et al. 1995; Stil et al. 2006; Hoare et al. 2012) via surveys at (sub)mm wavelengths (e.g., Dame et al. 2001; Jackson et al. 2006; Schuller et al. 2009, 2017; Rigby et al. 2016) and far-/mid-/near-infrared wavelengths (e.g., Egan et al. 2003; Skrutskie et al. 2006; Churchwell et al. 2009; Carey et al. 2009; Molinari et al. 2016) to high-energy gamma ray surveys (e.g., H. E. S. S. Collaboration et al. 2018) with almost all accessible continuum bands and many spectral lines covered. Most previous surveys at mm to (sub)mm wavelengths sample largely thermal emission from gas and dust. However, recently more and more surveys of the non-thermal maser emission of our Milky Way were conducted. For example, CH3OH class I masers were studied by the Millimeter Astronomer’s Legacy Team-45 GHz survey, MALT-45 (Jordan et al., 2013, 2015, 2017), water masers by the H2O southern Galactic plane survey (HOPS) (Walsh et al., 2011, 2012, 2014; Longmore et al., 2017) or CH3OH class II masers by the Methanol Multi-Beam (MMB) survey (Green et al., 2009, 2017; Breen et al., 2015, 2018).
One other important maser species are the OH masers found in this molecule’s ground state transitions at 18 cm wavelength in the radio band (e.g., Weaver et al. 1965; Elitzur 1992a). OH masers have been surveyed in the past decades in various ways, mostly via pointed follow-up observations toward IRAS sources (a summary of most of the surveys can be found in Mu et al. (2010) and Qiao et al. 2014). Unbiased surveys of the most abundant of these OH masers, the 1612 MHz transition, have been conducted in the southern and northern hemisphere with the Australia Telescope Compact Array (ATCA) and the Very Large Array (VLA) by Sevenster et al. (1997a, b, 2001). Furthermore, Dawson et al. (2014) and Qiao et al. (2016) used the Parkes single-dish telescope to survey all four OH maser transitions in the southern hemisphere. While the VLA and ATCA studies only covered a single maser transition at moderate sensitivity, the Parkes survey covers only parts of the southern hemisphere. Therefore, covering the northern hemisphere in all four OH maser transitions at good sensitivity and spatial resolution is an important step to get an unbiased picture of the OH maser distribution and the associated physical processes. Here, we present the results of the OH maser detections within “The HI/OH/Recombination line survey of the inner Milky Way (THOR)” conducted with the VLA. The OH maser results of the pilot region around W43 have been presented in Walsh et al. (2016). An overview of the entire survey can be found in Beuther et al. (2016).
A survey covering all four OH transitions is pertinent for interstellar medium (ISM), star formation and evolved star studies because they trace very different physical processes. While the most abundant 1612 MHz OH maser transition is typically known to favorably trace the expanding shells of evolved stars (e.g., Wilson & Barrett 1968; Hyland et al. 1972; Elitzur et al. 1976; Elitzur 1992a), the two main line masers at 1665 and 1667 MHz are more often found toward star-forming regions (e.g., Reid & Moran 1981; Argon et al. 2000; Fish et al. 2003; Qiao et al. 2014, 2016), but can also be found toward OH/IR stars (e.g., Lewis 1997). The least frequent 1720 MHz maser is typically excited by shocks and found toward either star-forming regions or supernovae remnants (e.g., Gray et al. 1992; Pavlakis & Kylafis 1996b; Lockett et al. 1999; Caswell 1999, 2004; Claussen et al. 1999; Wardle & Yusef-Zadeh 2002). However, these maser associations are not exclusive, and there are also several cases where different OH maser lines exist toward the same source (e.g., Caswell et al. 2013; Walsh et al. 2016). Furthermore, detecting a maser line does not allow a priori to unambiguously indicate the nature of the region it arises from, and in most cases complementary data are needed to elucidate this issue. Mu et al. (2010) compiled from the literature 3249 OH maser sources, and they attributed 7.4, 78.9 and 13.7% to interstellar, stellar or unknown origin category, respectively. In summary, studying OH masers is a unique tool to sample important evolutionary stages of stellar evolution, i.e., star formation, evolved stars and supernova remnants.
2 The THOR survey and its data
The THOR survey covers Galactic longitudes from 14 .∘35 to 67 .∘25 within Galactic latitudes of 1 .∘25 with the VLA in the C-array configuration at the radio L-band between 1 and 2 GHz frequencies. With the flexible WIDAR correlator, we simultaneously observe the entire band in the continuum emission as well as the spectral lines of HI, the four OH transitions as well as several hydrogen recombination lines (e.g., Bihr et al. 2015; Walsh et al. 2016; Wang et al. 2018; Rugel et al. 2018, 2019). A description of the survey, its design and specification is given in Beuther et al. (2016). A link to the first data release and additional publications about various aspects of the survey can be found on the project website111http://www.mpia.de/thor.
The OH data were observed in right-hand-circular and left-hand-circular polarization, but not in any of the cross-products. We produced the Stokes I total intensity maps of the OH data, and we focus on the final data products of the four OH transitions at 1612, 1665, 1667 and 1720 MHz (see also Walsh et al. 2016; Rugel et al. 2018). The whole survey was conducted in three steps: a pilot study around the high-mass star-forming region W43 (Bihr et al., 2015; Walsh et al., 2016), then the first and second half of the survey separately (see Beuther et al. 2016 for details). While the pilot study as well as the second half of the survey cover all four OH transitions, due to a problem in the setup, the first half of the survey unfortunately did not cover the 1667 MHz transition (longitude ranges roughly . ., . . and . .). For the data calibration and imaging strategy and procedures, we refer to Walsh et al. (2016), Beuther et al. (2016) and Rugel et al. (2018). Continuum subtraction was conducted prior to the imaging.
Using a Briggs weighting scheme with a robust factor of 0, the spatial resolution of the OH data cubes varies between roughly and (see Table 2 in Beuther et al. (2016), and the spectral resolution of the final data cubes is 1.5 km s-1. The typical rms noise level of the data is 10 mJy beam-1, but it can increase close to strong maser features because the interferometric THOR data have a dynamic range limit of 900 (Walsh et al., 2016), and peak flux densities greater 10 Jy are found toward several sources (Table 1).
3 Results
The main product of this paper is the catalogue of OH masers in the THOR survey. We follow the nomenclature given by Walsh et al. (2016) for the THOR pilot region W43. The term “maser spot” refers to a single peak in the spectrum which typically originates from parcels of gas with sizes around cm or 10 AU (e.g., Elitzur 1992a). Such maser spots may be grouped in regions with sizes around cm ( AU) which we call “maser sites”. Given our spatial resolution and typical distances, maser spots and maser sites are typically unresolved in our observations. Our definition of maser spot is called in some other works also “maser feature” or “maser component”.

| Name | R.A. | Dec. | rms | ass. | |||||||
|---|---|---|---|---|---|---|---|---|---|---|---|
| J2000.0 | J2000.0 | Jy | mJy | ′′ | ′′ | ||||||
| G14.389-0.020-1665A | 18:16:43.732 | -16:27:03.33 | 0.073 | 3 | 0.111 | 24.0 | 23.25 | 24.75 | 0.3 | 0.3 | SF-Sim,MMB,rc |
| G14.431-0.033-1612A | 18:16:51.510 | -16:25:12.01 | 0.366 | 8 | 1.977 | 33.0 | 27.75 | 35.25 | 0.2 | 0.2 | ES-D,BS |
| G14.431-0.033-1612B | 18:16:51.518 | -16:25:11.63 | 0.660 | 8 | 2.042 | 39.0 | 38.25 | 44.25 | 0.1 | 0.1 | |
| G14.455+0.014-1612A | 18:16:44.091 | -16:22:36.96 | 0.104 | 5 | 0.139 | 82.5 | 80.25 | 83.25 | 0.2 | 0.2 | ES-D,BS |
| G14.455+0.014-1612B | 18:16:44.077 | -16:22:37.79 | 0.067 | 5 | 0.099 | 115.5 | 114.75 | 116.25 | 0.5 | 0.4 | |
| G14.471+0.799-1612A | 18:13:53.604 | -15:59:15.76 | 0.055 | 4 | 0.175 | 54.0 | 51.75 | 56.25 | 0.3 | 0.3 | Star-Sim |
| G14.504+0.976-1612A | 18:13:18.550 | -15:52:27.07 | 0.803 | 6 | 2.691 | 19.5 | 17.25 | 26.25 | 0.1 | 0.0 | U |
| G14.530+0.160-1612A | 18:16:20.858 | -16:14:24.47 | 0.390 | 5 | 0.965 | 84.0 | 81.75 | 84.75 | 0.1 | 0.1 | Star-Sim |
| G14.530+0.160-1665A | 18:16:20.835 | -16:14:25.50 | 0.080 | 4 | 0.210 | 73.5 | 72.75 | 75.75 | 0.3 | 0.2 | |
| … |
Notes: Given are the name (including the maser frequency and spot label A.B, etc.), Right Ascension and Declination, peak flux density rms and integrated flux density, peak velocity and minimum/maximum velocity of maser spot, and the positional uncertainties. Empty lines separate maser sites.
Associations (ass.) ES: evolved star, D: double peaked, D?: potentially double peaked with 2nd component either two weak to be firmly identified or outside the imaged velocity range, BS, RS or wkS: in the GLIMPSE images a bright, red or weak star is seen co-spatial with the maser site, SF: star formation, SNR: supernova remnant, PN: planetary nebula, Star: star, nPL: near a pulsar, Sim: according to Simbad database, rc: cm continuum emission from (Wang et al., 2018). Previous literature entries are referenced as: Bel13 - Beltrán et al. 2013; Blo94 - Blommaert et al. (1994); Cas95 - Caswell et al. (1995); Cod10 - Codella et al. (2010); Dea07 - Deacon et al. (2007); Deg04 - Deguchi et al. (2004); DiF08 - Di Francesco et al. (2008); Fel02 - Felli et al. (2002); He05 - He et al. (2005); Hil05 - Hill et al. (2005); Ima13 - Imai et al. (2013); Kwo97 - Kwok et al. (1997); Kur94 - Kurtz et al. (1994); Lou93 - Loup et al. (1993); Mot03 - Motte et al. (2003); MMB - Methanol Multibeam Survey Caswell et al. (2010); Green et al. (2010); Breen et al. (2015); Per09 - Peretto & Fuller (2009); Pes05 - Pestalozzi et al. (2005); Ros10 - Rosolowsky et al. (2010); Sev01 - Sevenster et al. (2001); Tho06 - Thompson et al. (2006); Urq09 - Urquhart et al. (2009); Wal98 - Walsh et al. (1998); Win75 - Winnberg et al. (1975).
3.1 Maser identification and completeness
For the maser identification, we also follow the approach conducted for the THOR pilot region in Walsh et al. (2016). As a starting point, the package DUCHAMP (Whiting, 2012) was used to identify maser candidates. The data cubes have pixel sizes of to sample the beam linearly at least 4 times, mostly even 5-6 times (see Sect. 2). With the given rms and spectral resolution, DUCHAMP searched for emission above twice the rms (typically 20 mJy beam-1) with additional criteria of at least 12 pixels in a single channel, and at minimum 2 consecutive channels with emission above the 2 level.
As outlined in Walsh et al. (2016), the DUCHAMP maser identification is furthermore limited by the varying noise with respect to spatial position and spectral channel. Toward strong maser sources, the channels including strong emission are not dominated by thermal noise but rather by systematic errors caused by artifacts due to the emission’s side-lobes. To account for the noise variations, a noise map was created, the emission map divided by the noise map, and the DUCHAMP algorithm was then run on the resulting signal-to-noise maps. Example images of this procedure are presented in Figure 1 of Walsh et al. (2016).
As a next step to confirm the DUCHAMP maser detections, each one of them was visually inspected. Almost all false detection could then be associated with side-lobes from nearby strong masers.
In addition to the DUCHAMP approach, we visually searched the data cubes and moment maps using the HOPS method outlined in more detail in Walsh et al. (2012). This was particularly useful for the 1612 MHz masers associated with evolved stars because their typical double-horn profile is easy to visually identify, even in low signal-to-noise data.
To extract the parameters for each maser spot, the task imfit in MIRIAD is used (Sault et al., 1995). Derived parameters are the peak and integrated flux densities, as well as the positions and their associated uncertainties. The velocity minima and maxima for each spot are derived via visually inspecting the data cubes over which channels emission is observed.
The completeness of the maser detections depends on the noise level and therefore varies spatially as well as spectrally. In spectral channels and at positions where a strong maser spot is found nearby, the noise level is higher, and therefore the degree of completeness lower. Based on this, one cannot derive a single completeness level, but that has to be inferred as a function of the changing noise level. Walsh et al. (2016) have conducted a detailed completeness analysis for the pilot region, and we refer to their analysis. The main conclusion is that the THOR maser data are complete at around the level of 0.25 Jy beam-1, and that the data are still 50% complete at approximately 0.17 Jy beam-1.
3.2 Maser catalogue and properties
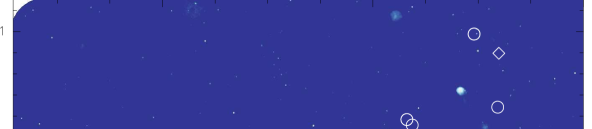
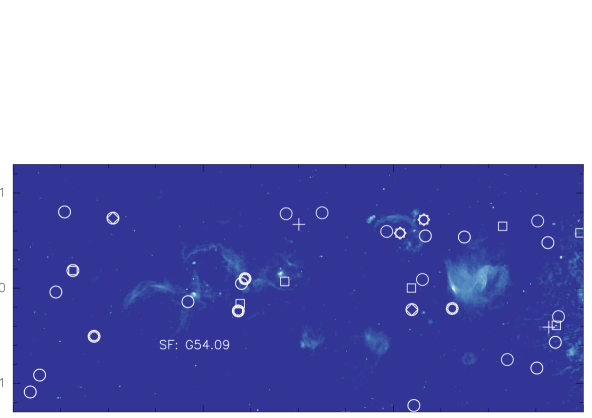
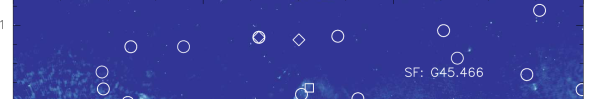
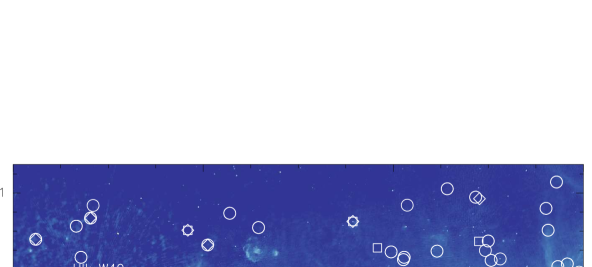
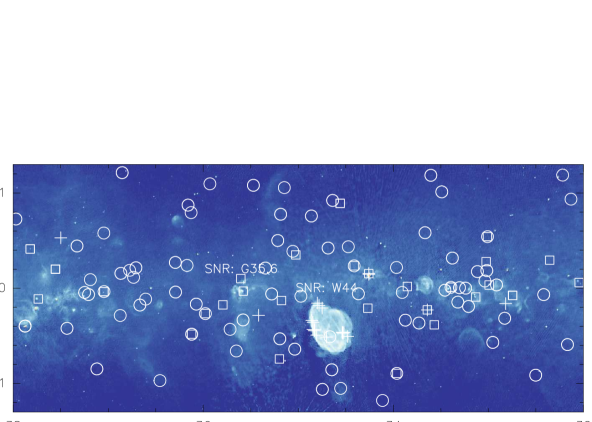
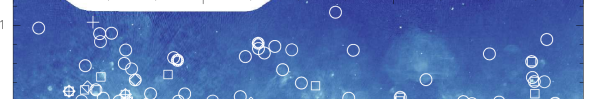
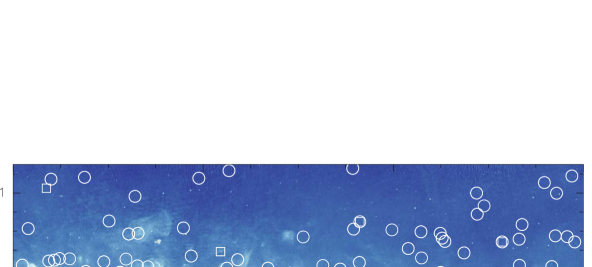
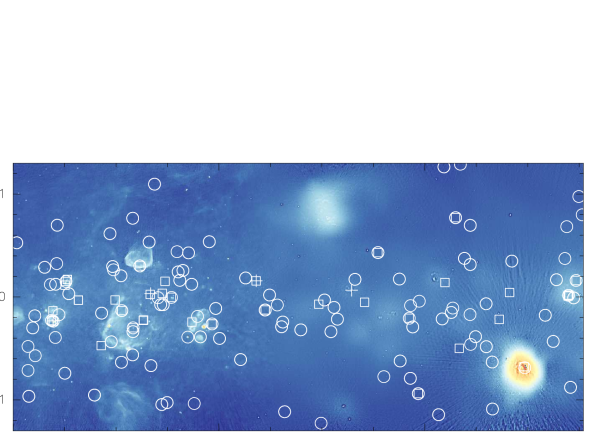
The full THOR OH maser catalogue consists of 1585 individual maser spots, including the 276 spots detected in the pilot region by Walsh et al. (2016). The catalogue contains 1080 maser spots at 1612 MHz, 307 at 1665 MHz, 145 at 1667 MHz and 53 at 1720 MHz, respectively. Figure 1 presents an overlay of all maser spots on the 1.4 GHz THOR continuum image (Wang et al., 2018).
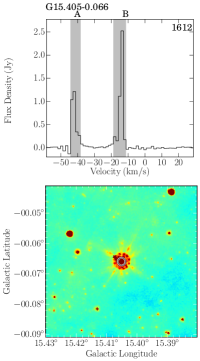
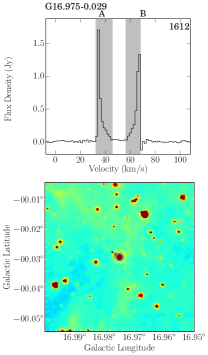
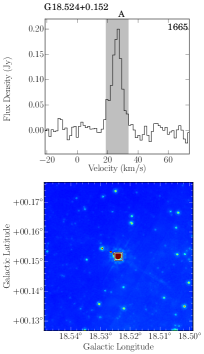
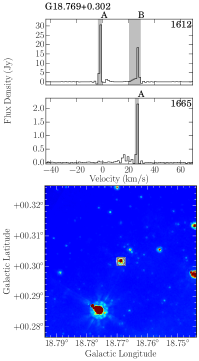
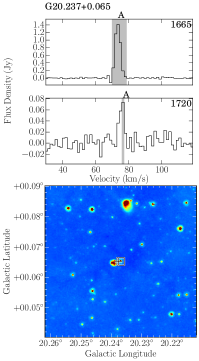
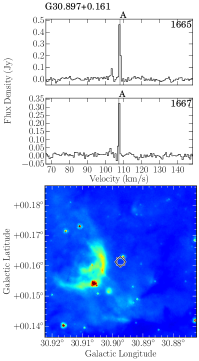
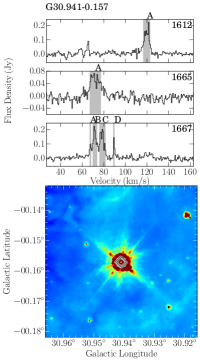
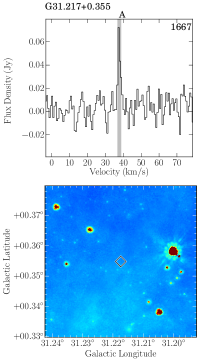
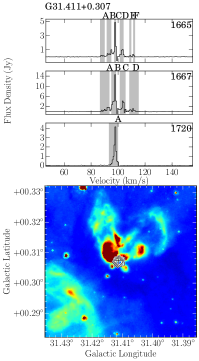
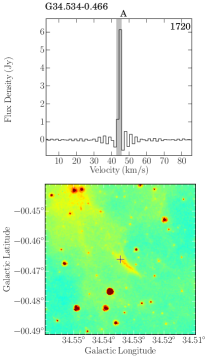
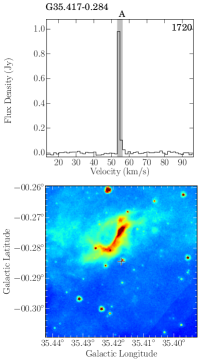
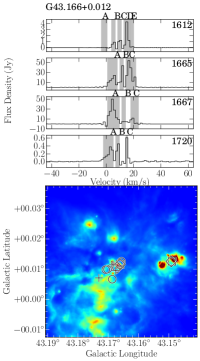
The maser spots are grouped into maser sites that occur at well-defined positions on the sky, typically smaller than (e.g., Elitzur 1992a) and are always much smaller compared to the THOR beam size between and (Sect. 2). These maser sites can harbor of maser spots of the same line but they can also contain maser spots from multiple transitions. Altogether the 1585 maser spots are distributed in 807 maser sites. For all maser sites we show an 8 m image – mainly from the GLIMPSE survey (Benjamin et al., 2003; Churchwell et al., 2009) and for the 33 sites, where no GLIMPSE data are available, from WISE (Wright et al., 2010) – accompanied by the corresponding spectra. The grey-shaded areas in each spectrum mark the velocity regimes of each identified maser spot also listed in Table 1. Fig. 2 shows a few examples, data for all sites are presented in the appendix.
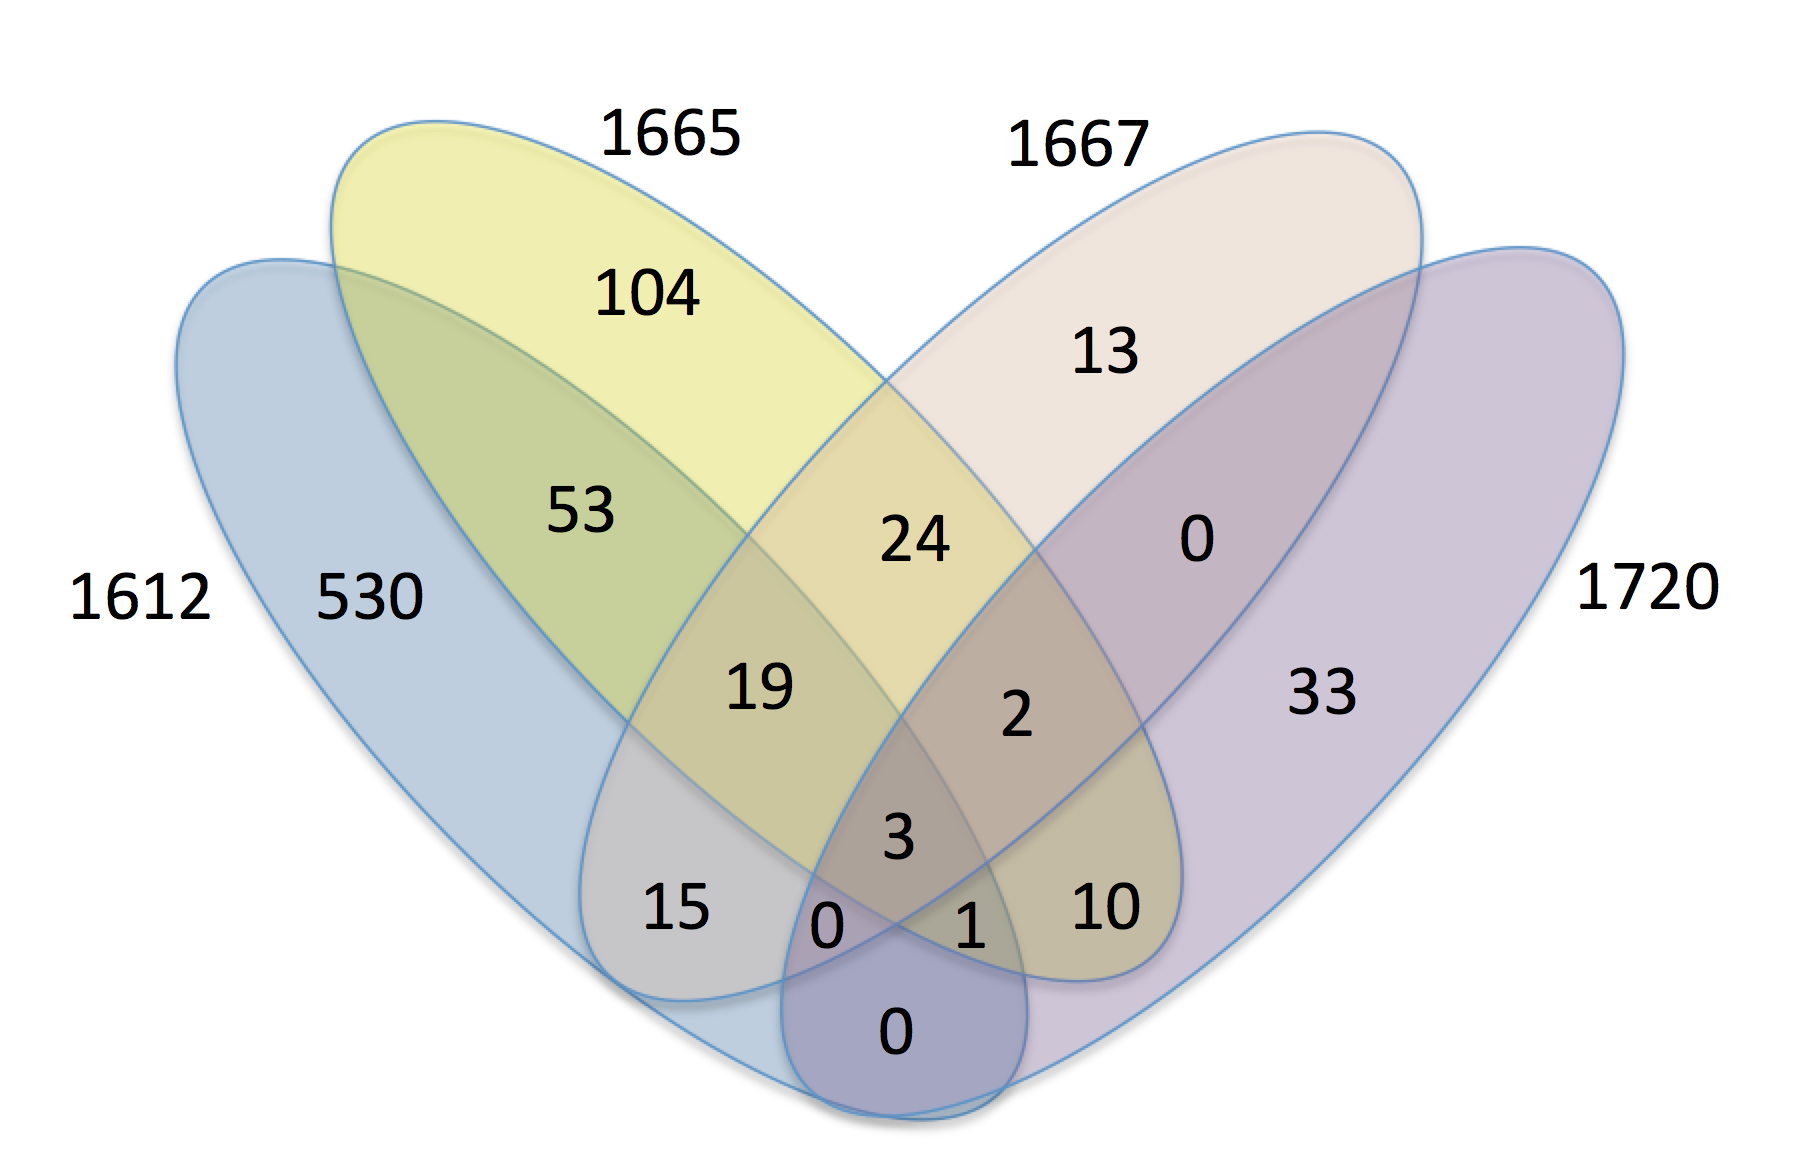
To evaluate the occurrence of maser spots of different OH transitions within a single maser site, Figure 3 presents a Venn-diagram outlining the common occurrence of maser sites for the four transitions. The largest fraction of maser sites (66%) are 1612 MHz masers without associated masers in other ground-state OH transitions. However, in contrast to the pilot study where several of the transition overlap areas in this diagram were not populated at all, in the full THOR survey we find maser sites for which most permutations of transition overlaps. Even maser sites with all four maser types together are identified, although only three in total, corresponding to the three sites G43.165-0.028, G43.166+0.012 (both part of very the luminous Hii region complex W49A), and G45.466+0.045 which is part of the Hii region G45.47+0.05. Therefore, although each maser type still has a preferred physical environment, the sole detection of an OH maser does not allow an unambiguous identification of the underlying source type, whether it is a star-forming region, an AGB star or a supernova remnant.
4 Discussion
4.1 Maser associations
With 807 maser sites, it is important to know the physical nature of the underlying sources. Therefore, where possible, we have associated the maser sites with astrophysical source types. As outlined in the Introduction, previous studies indicate that 1612 MHz masers are often associated with evolved stars, 1665 and 1667 MHz masers tend to be associated with star-forming regions, and 1720 MHz masers are often associated with shocks, potentially from supernova remnants. However, shocks could also be produced in protostellar jets and hence maybe the 1720 MHz masers as well. As already visualized in the Venn diagram (Fig. 3), these associations are not unique, and there are several regions where different maser types are associated with the same astrophysical region. The overlay of the maser sites with the cm continuum emission in Fig. 1 already shows that only a comparatively small fraction of maser sites is associated with radio continuum emission that traces either free-free or synchrotron emission. At the sensitivity limits of the THOR continuum data (Wang et al., 2018), only 2.3, 19.4, 11.8 and 18.4% of the 1612, 1665, 1667, and 1720 MHz OH maser sites are associated with radio continuum emission, respectively. The corresponding 54 OH maser sites are labeled in Table 1.
The source association process was done in several steps. First, we went through all maser spectra and mid-infrared images (Figures in appendix), and identified those sources as evolved stars that showed the typical double-peaked profiles in the 1612 MHz line (ES-D in Table 1). In addition to the clear detection associations, there are also a few 1612 MHz masers where the single component is close to the edge of our bandpass, and the second component may be at velocities outside of our velocity range. Furthermore, a few 1612 MHz masers show a weak second component that is below our detection threshold but may still be real. Those sources we tentatively associated with evolved stars (ES-D? in Table 1). Furthermore, a few classical maser sources were identified straight away, e.g., the supernova remnant W44 or the luminous star-forming region W49. As a next step, we employed the SIMBAD database (Wenger et al., 2000) to search for associations within a matching radius. This allowed for an additional large fraction of source-type associations, all those are marked as “Sim” in Table 1. In addition to this, all sources associated with class II methanol masers (MMB, Green et al. 2010; Breen et al. 2015) were catalogued as star-forming regions.
Based on these approaches, 716 of the 807 maser sites were identified. Of these, 415 maser sites exhibit double-horned 1612 MHz profiles associated with the expanding shells around evolved stars, 57 sites may be double-horned and associated with evolved stars (classified as ES-D?), 56 sites are co-spatial with stars according to the SIMBAD database, 164 sites should be associated with star-forming regions, 21 regions are potentially associated with supernova remnants (SNR), 3 sites are identified as planetary nebulae (PN), and 1 is a possible pulsar association. 90 sites remain as unidentified.
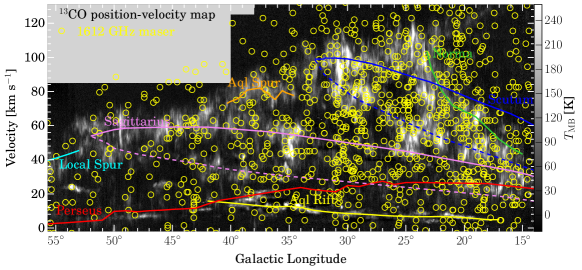
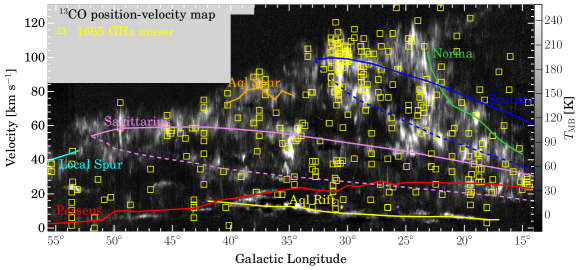
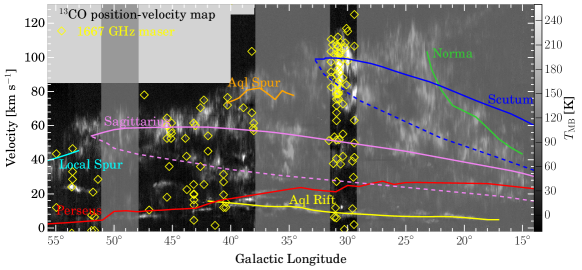
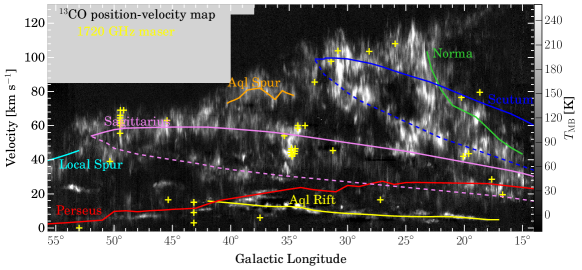
An interesting comparison is how the different OH masers compare to the gas distribution within the Milky Way. Figure 4 shows a position-velocity plot of the 13CO(1–0) emission along Galactic latitudes based in the Galactic Ring Survey (Jackson et al., 2006). Over-plotted on the four panels are the different maser types at 1612, 1665, 1667 and 1720 MHz, respectively. One sees clear differences between the OH 1612 MHz masers, that are distributed almost randomly across the figure, whereas the three other types at 1665, 1667, and 1720 MHz are correlated well with the 13CO(1–0) emission in the Milky Way plane. Although the 1665/1667 and 1720 MHz masers trace largely different physical environments – star formation sites versus shock excitation in supernovae or jets (see Introduction) – they are all closely associated with the dense gas associated with star formation or feedback processes. In contrast to this, the 1612 MHz masers, that typically trace the shells around evolved stars, do not have much in common anymore with the original gas distributions of the birth sites.
4.2 Double-horned OH 1612 MHz separation
More than 50% of the maser sites (415) can be identified as double-horned OH 1612 MHz masers associated with evolved stars. The pumping mechanism by far-infrared photons (35 m) in the expanding shells around evolved stars, that is responsible for this spectral feature, is described in detail in Elitzur (1992b). Using the peak velocities of each maser spot (Table 1), we can derive the typical velocity differences between the main double-horned profiles. Figure 5 presents the derived distribution. While there are a few exceptions at high and low velocity differences, it is clear that the distribution has most velocity separations between roughly 22 and 38 km s-1, consistent with previous findings by Baud et al. (1981) or Sevenster et al. (2001). Fig. 5 exhibits two bins around 29 and 32 km s-1 with slightly higher separation population. However, since this is a small effect at a velocity separation of only two times our velocity resolution, we do not consider this further.

4.3 1720 MHz maser association
Following the identification of maser sites in Table 1, the rarest of the masers, those that emit in the 1720 MHz line, are mostly associated with supernova remnants (21 times), but a non-negligible fraction of 17 maser sites is also associated with star-forming regions. The remaining ones are either unidentified (6) and 1 is associated with a planetary nebula.
The main differences between 1720 MHz masers from supernovae remnants and star-forming regions appears to lie in the density of the gas. While SNR associated 1720 MHz masers typically require relatively low densities ( cm-3) and may trace C-shocks (e.g., Pavlakis & Kylafis 1996a, b; Lockett et al. 1999; Caswell 1999), 1720 MHz masers in star-forming regions likely need higher densities ( cm), intense far-infrared radiation and large velocity gradients to be effectively pumped (e.g., Gray et al. 1992; Pavlakis & Kylafis 1996b; Caswell 1999). These different regimes reflect that our survey reveals significant numbers of 1720 MHz masers toward SNRs as well as star-forming regions.
4.4 Literature comparison
4.4.1 Previous VLA 1612 MHz survey
As mentioned in the Introduction, Sevenster et al. (2001) conducted a VLA survey of the 1612 MHz maser at Galactic longitudes below 45 deg. That survey had been conducted heterogeneously, employing all VLA configurations, and the reported median rms noise was 25 mJy beam-1 (Sevenster et al., 2001). From the 1080 maser spots identified at 1612 MHz, the Sevenster et al. (2001) survey had previously identified 166 sources in the THOR survey area with a matching radius of . Hence, most of the THOR-identified masers are new detections. Fig. 6 presents a comparison between the peak flux densities measured by the earlier Sevenster et al. (2001) study and our new THOR data. Although there is a large scatter, in the log-log plot both surveys correlate relatively well with each other. However, if one measures the ratio of the mean THOR flux densities over the mean flux densities from Sevenster et al. (2001), one finds systematically higher THOR values with a mean ratio of 1.9. Similarly, previous studies by Dawson et al. (2014) comparing the SPLASH survey with the Sevenster et al. (2001) study, and the THOR pilot study (Walsh et al., 2016) found lower flux densities in the Sevenster et al. (2001) study. Following their arguments, the most likely explanation for this systematic difference is the broader channel width of 2.27 km s-1 used by Sevenster et al. (2001) that can smear out the intrinsically higher peak flux densities.

4.4.2 Parkes 1665 and 1667 MHz survey
Caswell et al. (2013) presented main-line (1665 and 1667 MHz) Parkes single-dish maser observations toward 104 sources below Galactic longitudes of 41 deg. Comparing the 1665 MHz detections with the THOR survey (again within a positional matching radius of ), both have 38 1665 MHz maser spots in common. Fig. 7 shows a comparison between the peak flux densities of the Caswell et al. (2013) and the THOR data, and interestingly the Parkes-measured flux densities are consistently much higher than what we observed with the VLA. Following the arguments above for the 1612 MHz maser comparison, also here the spectral resolution is likely to be the explanation. Compared to the THOR velocity resolution of 1.5 km s-1, the Parkes data were observed with a much better spectral resolution of 0.1 km s-1. Hence, for the 1665 MHz comparison, the argument is similar, i.e., the higher-spectral-resolution Parkes data can measure higher peak flux densities that are smeared out in our lower-spectral-resolution THOR data. In addition to this, the Parkes observations with a beam size of 12′ may add several maser sites into a single spectrum that we can resolve with our higher spatial resolution, hence finding lower flux densities in individually resolved sites.

4.4.3 Class II CH3OH masers
Other maser associations interesting for comparison are the class II CH3OH masers typically associated with young high-mass star-forming regions (e.g., Walsh et al. 1998). Comparisons between OH and class II CH3OH maser sites with ultracompact Hii regions indicated that OH masers are more often associated with the ionized gas and hence most likely trace a later evolutionary stage (Caswell, 1997). Similar relative evolutionary stages were more recently reported for OH and 6.7 GHz class II masers by Breen et al. (2010, 2018). The Methanol Multibeam survey (MMB) searched with the Parkes telescope for these CH3OH masers, and they provide a catalogue between Galactic longitudes of 345 and 60 degrees (Caswell et al., 2010; Green et al., 2010; Breen et al., 2015). In the overlap region with a matching radius of , 108 maser sites coincide between our THOR and the MMB surveys. Since class II CH3OH masers should be associated with high-mass star-forming regions, indeed most MMB sites are associated with the 1665 MHz OH masers (101 sites). Because the real coverage of the 1667 MHz masers is smaller (Section 2), only 23 are associated with the MMB sources. From the rarer 1720 MHz masers, 13 have a MMB counterpart and hence should be associated with star formation. Furthermore, as expected the 1612 MHz masers are only rarely associated with CH3OH class II masers, and we find only 15 sites in common. Nevertheless, these should be star-forming regions as well. Most of the 1612, 1667 and 1720 masers have also a counterpart in the 1665 MHz line, more details about the maser associations are given in Table 2.
Considering relative time-scales when these masers occur during high-mass star formation, one can compare the occurrence of class II CH3OH masers to that of the 1665 MHz OH masers. In the common area up to Galactic longitudes of 60 deg, there are 319 MMB maser sites and 215 OH 1665 MHz maser sites. Of these, 101 sites are in common. Hence, one finds a similar number of 114 OH 1665 MHz masers without MMB counterpart, and 218 MMB sites without 1665 MHz counterpart. Therefore, relatively speaking, the time-scale to find 6.7 GHz class II CH3OH maser may be approximately 50% longer than that for the 1665 MHz OH maser. Breen et al. (2018) compared the occurrence of the 6.7 GHz class II CH3OH masers with the excited OH masers at 6035 MHz, and they also find that around 54% of these excited OH masers are associated with class II CH3OH masers. They report that their results are consistent with previous findings that the OH masers tracing a slightly more evolved evolutionary stage than the class II CH3OH masers (e.g., Caswell 1997; Breen et al. 2010, 2018).
| CH3OH | H2O | |
| 1612 | 15 (2) | 20 (9) |
| 1665 | 101 | 33 |
| 1667 | 23 (1) | 2 (2) |
| 1720 | 13 (3) | 4 (0) |
Notes: The numbers in brackets state how many of the maser sites have no 1665 MHz counterpart.
4.4.4 H2O masers
Although the spatial overlap is smaller, we also compared our OH maser catalogue to the H2O maser catalogue HOPS presented in Walsh et al. (2011). In the overlap region up to 30 deg in longitude, the HOPS catalogue lists 571 H2O maser sites. In total, the THOR and HOPS catalogues do have only 44 maser sites in common (more details in Table 2). The most common association (33) is again that with the 1665 MHz maser. Most of these (25) are associated with star-forming regions (20 with MMB counterpart and 5 classified as SF from SIMBAD). The remaining source associations for these masers are 2 evolved stars (ES), 3 SIMBAD-identified Stars, and 3 unidentified sources.
With the narrow spatial overlap of the 1667 MHz masers, only 2 of them have a HOPS counterpart, both are unidentified sources and none have a 1665 MHz counterpart.
Interestingly, also the 1720 MHz masers have 4 associated HOPS sources, all related to star formation (3 MMB sources and 1 SIMBAD-identified star-forming region).
Finally, 20 regions with 1612 MHz maser emission are also associated with HOPS H2O masers. Of these 20 regions, 13 are associated with (evolved) stars (10 ES and 1 SIMBAD-identified star in our catalogue). A further 6 regions are associated with star formation (MMB sources) and 1 remains an unidentified source.
5 Conclusions and Summary
Based on the HI/OH/Recombination line survey of the Milky Way (THOR), we present an OH maser catalogue in the longitude/latitude ranges and degrees. All ground state OH lines at 1612, 1665, 1667 and 1720 MHz are covered. In total, we identify 1585 individual maser spots distributed over 807 maser sites. Where possible, associations with astrophysical source types are conveyed (evolved stars, star-forming regions, supernovae remnants). More than 50% of the maser sites are associated with the double-horned 1612 MHz profiles typically stemming from the expanding shells of evolved stars. A comparison with the Galactic 13CO(1–0) emission as well as other maser surveys (OH as well as class II CH3OH and H2O masers) is presented. The full catalogue is available in electronic form.
Acknowledgements.
We thank an anonymous referee for careful comments improving this paper. The National Radio Astronomy Observatory is a facility of the National Science Foundation operated under cooperative agreement by Associated Universities, Inc. HB, YW, JS and MR acknowledge support from the European Research Council under the Horizon 2020 Framework Program via the ERC Consolidator Grant CSF-648505. HB, MR, SCOG and RSK acknowledge support from the Deutsche Forschungsgemeinschaft via SFB 881, “The Milky Way System” (sub-projects B1, B2 and B8). JK received funding from the European Union’s Horizon 2020 research and innovation program under grant agreement No 639459 (PROMISE). NR acknowledges support from the Infosys Foundation through the Infosys Young Investigator grant. F.B. acknowledges funding from the European Union’s Horizon 2020 research and innovation programme (grant agreement No 726384). This research has made use of the SIMBAD database, operated at CDS, Strasbourg, France.References
- Argon et al. (2000) Argon, A. L., Reid, M. J., & Menten, K. M. 2000, ApJS, 129, 159
- Baud et al. (1981) Baud, B., Habing, H. J., Matthews, H. E., & Winnberg, A. 1981, A&A, 95, 171
- Becker et al. (1995) Becker, R. H., White, R. L., & Helfand, D. J. 1995, ApJ, 450, 559
- Beltrán et al. (2013) Beltrán, M. T., Olmi, L., Cesaroni, R., et al. 2013, A&A, 552, A123
- Benjamin et al. (2003) Benjamin, R. A., Churchwell, E., Babler, B. L., et al. 2003, PASP, 115, 953
- Beuther et al. (2016) Beuther, H., Bihr, S., Rugel, M., et al. 2016, A&A, 595, A32
- Bihr et al. (2015) Bihr, S., Beuther, H., Ott, J., et al. 2015, A&A, 580, A112
- Blommaert et al. (1994) Blommaert, J. A. D. L., van Langevelde, H. J., & Michiels, W. F. P. 1994, A&A, 287, 479
- Breen et al. (2018) Breen, S. L., Contreras, Y., Ellingsen, S. P., et al. 2018, MNRAS, 474, 3898
- Breen et al. (2010) Breen, S. L., Ellingsen, S. P., Caswell, J. L., & Lewis, B. E. 2010, MNRAS, 401, 2219
- Breen et al. (2015) Breen, S. L., Fuller, G. A., Caswell, J. L., et al. 2015, MNRAS, 450, 4109
- Carey et al. (2009) Carey, S. J., Noriega-Crespo, A., Mizuno, D. R., et al. 2009, PASP, 121, 76
- Caswell (1997) Caswell, J. L. 1997, MNRAS, 289, 203
- Caswell (1999) Caswell, J. L. 1999, MNRAS, 308, 683
- Caswell (2004) Caswell, J. L. 2004, MNRAS, 349, 99
- Caswell et al. (2010) Caswell, J. L., Fuller, G. A., Green, J. A., et al. 2010, MNRAS, 404, 1029
- Caswell et al. (2013) Caswell, J. L., Green, J. A., & Phillips, C. J. 2013, MNRAS, 431, 1180
- Caswell et al. (1995) Caswell, J. L., Vaile, R. A., Ellingsen, S. P., Whiteoak, J. B., & Norris, R. P. 1995, MNRAS, 272, 96
- Churchwell et al. (2009) Churchwell, E., Babler, B. L., Meade, M. R., et al. 2009, PASP, 121, 213
- Claussen et al. (1999) Claussen, M. J., Goss, W. M., Frail, D. A., & Desai, K. 1999, ApJ, 522, 349
- Codella et al. (2010) Codella, C., Cesaroni, R., López-Sepulcre, A., et al. 2010, A&A, 510, A86
- Dame et al. (2001) Dame, T. M., Hartmann, D., & Thaddeus, P. 2001, ApJ, 547, 792
- Dawson et al. (2014) Dawson, J. R., Walsh, A. J., Jones, P. A., et al. 2014, MNRAS, 439, 1596
- Deacon et al. (2007) Deacon, R. M., Chapman, J. M., Green, A. J., & Sevenster, M. N. 2007, ApJ, 658, 1096
- Deguchi et al. (2004) Deguchi, S., Fujii, T., Glass, I. S., et al. 2004, PASJ, 56, 765
- Di Francesco et al. (2008) Di Francesco, J., Johnstone, D., Kirk, H., MacKenzie, T., & Ledwosinska, E. 2008, ApJS, 175, 277
- Egan et al. (2003) Egan, M. P., Price, S. D., Kraemer, K. E., et al. 2003, VizieR Online Data Catalog, 5114, 0
- Elitzur (1992a) Elitzur, M. 1992a, ARA&A, 30, 75
- Elitzur (1992b) Elitzur, M. 1992b, Astronomical masers (Astronomical masers Kluwer Academic Publishers (Astrophysics and Space Science Library. Vol. 170), 365 p.)
- Elitzur et al. (1976) Elitzur, M., Goldreich, P., & Scoville, N. 1976, ApJ, 205, 384
- Felli et al. (2002) Felli, M., Testi, L., Schuller, F., & Omont, A. 2002, A&A, 392, 971
- Fish et al. (2003) Fish, V. L., Reid, M. J., Argon, A. L., & Menten, K. M. 2003, ApJ, 596, 328
- Gray et al. (1992) Gray, M. D., Field, D., & Doel, R. C. 1992, A&A, 262, 555
- Green et al. (2017) Green, J. A., Breen, S. L., Fuller, G. A., et al. 2017, MNRAS, 469, 1383
- Green et al. (2009) Green, J. A., Caswell, J. L., Fuller, G. A., et al. 2009, MNRAS, 392, 783
- Green et al. (2010) Green, J. A., Caswell, J. L., Fuller, G. A., et al. 2010, MNRAS, 409, 913
- H. E. S. S. Collaboration et al. (2018) H. E. S. S. Collaboration, Abdalla, H., Abramowski, A., et al. 2018, A&A, 612, A1
- He et al. (2005) He, J. H., Szczerba, R., Chen, P. S., & Sobolev, A. M. 2005, A&A, 434, 201
- Hill et al. (2005) Hill, T., Burton, M. G., Minier, V., et al. 2005, MNRAS, 363, 405
- Hoare et al. (2012) Hoare, M. G., Purcell, C. R., Churchwell, E. B., et al. 2012, PASP, 124, 939
- Hyland et al. (1972) Hyland, A. R., Becklin, E. E., Frogel, J. A., & Neugebauer, G. 1972, A&A, 16, 204
- Imai et al. (2013) Imai, H., Deguchi, S., Nakashima, J.-i., Kwok, S., & Diamond, P. J. 2013, ApJ, 773, 182
- Jackson et al. (2006) Jackson, J. M., Rathborne, J. M., Shah, R. Y., et al. 2006, ApJS, 163, 145
- Jordan et al. (2017) Jordan, C. H., Walsh, A. J., Breen, S. L., et al. 2017, MNRAS, 471, 3915
- Jordan et al. (2013) Jordan, C. H., Walsh, A. J., Lowe, V., et al. 2013, MNRAS, 429, 469
- Jordan et al. (2015) Jordan, C. H., Walsh, A. J., Lowe, V., et al. 2015, MNRAS, 448, 2344
- Kurtz et al. (1994) Kurtz, S., Churchwell, E., & Wood, D. O. S. 1994, ApJS, 91, 659
- Kwok et al. (1997) Kwok, S., Volk, K., & Bidelman, W. P. 1997, ApJS, 112, 557
- Lewis (1997) Lewis, B. M. 1997, ApJS, 109, 489
- Lockett et al. (1999) Lockett, P., Gauthier, E., & Elitzur, M. 1999, ApJ, 511, 235
- Longmore et al. (2017) Longmore, S. N., Walsh, A. J., Purcell, C. R., et al. 2017, MNRAS, 470, 1462
- Loup et al. (1993) Loup, C., Forveille, T., Omont, A., & Paul, J. F. 1993, A&AS, 99, 291
- Molinari et al. (2016) Molinari, S., Schisano, E., Elia, D., et al. 2016, A&A, 591, A149
- Motte et al. (2003) Motte, F., Schilke, P., & Lis, D. C. 2003, ApJ, 582, 277
- Mu et al. (2010) Mu, J.-M., Esimbek, J., Zhou, J.-J., & Zhang, H.-J. 2010, Research in Astronomy and Astrophysics, 10, 166
- Pavlakis & Kylafis (1996a) Pavlakis, K. G. & Kylafis, N. D. 1996a, ApJ, 467, 300
- Pavlakis & Kylafis (1996b) Pavlakis, K. G. & Kylafis, N. D. 1996b, ApJ, 467, 309
- Peretto & Fuller (2009) Peretto, N. & Fuller, G. A. 2009, A&A, 505, 405
- Pestalozzi et al. (2005) Pestalozzi, M. R., Minier, V., & Booth, R. S. 2005, A&A, 432, 737
- Qiao et al. (2014) Qiao, H., Li, J., Shen, Z., Chen, X., & Zheng, X. 2014, MNRAS, 441, 3137
- Qiao et al. (2016) Qiao, H.-H., Walsh, A. J., Green, J. A., et al. 2016, ApJS, 227, 26
- Reid et al. (2016) Reid, M. J., Dame, T. M., Menten, K. M., & Brunthaler, A. 2016, ApJ, 823, 77
- Reid & Moran (1981) Reid, M. J. & Moran, J. M. 1981, ARA&A, 19, 231
- Rigby et al. (2016) Rigby, A. J., Moore, T. J. T., Plume, R., et al. 2016, MNRAS, 456, 2885
- Rosolowsky et al. (2010) Rosolowsky, E., Dunham, M. K., Ginsburg, A., et al. 2010, ApJS, 188, 123
- Rugel et al. (2018) Rugel, M. R., Beuther, H., Bihr, S., et al. 2018, A&A, 618, A159
- Rugel et al. (2019) Rugel, M. R., Rahner, D., Beuther, H., et al. 2019, A&A, 622, A48
- Sault et al. (1995) Sault, R. J., Teuben, P. J., & Wright, M. C. H. 1995, in ASP Conf. Ser. 77, 433
- Schuller et al. (2017) Schuller, F., Csengeri, T., Urquhart, J. S., et al. 2017, A&A, 601, A124
- Schuller et al. (2009) Schuller, F., Menten, K. M., Contreras, Y., et al. 2009, A&A, 504, 415
- Sevenster et al. (1997a) Sevenster, M. N., Chapman, J. M., Habing, H. J., Killeen, N. E. B., & Lindqvist, M. 1997a, A&AS, 122, 79
- Sevenster et al. (1997b) Sevenster, M. N., Chapman, J. M., Habing, H. J., Killeen, N. E. B., & Lindqvist, M. 1997b, A&AS, 124, 509
- Sevenster et al. (2001) Sevenster, M. N., van Langevelde, H. J., Moody, R. A., et al. 2001, A&A, 366, 481
- Skrutskie et al. (2006) Skrutskie, M. F., Cutri, R. M., Stiening, R., et al. 2006, AJ, 131, 1163
- Stil et al. (2006) Stil, J. M., Taylor, A. R., Dickey, J. M., et al. 2006, AJ, 132, 1158
- Thompson et al. (2006) Thompson, M. A., Hatchell, J., Walsh, A. J., MacDonald, G. H., & Millar, T. J. 2006, A&A, 453, 1003
- Urquhart et al. (2009) Urquhart, J. S., Hoare, M. G., Purcell, C. R., et al. 2009, A&A, 501, 539
- Walsh et al. (2016) Walsh, A. J., Beuther, H., Bihr, S., et al. 2016, MNRAS, 455, 3494
- Walsh et al. (2011) Walsh, A. J., Breen, S. L., Britton, T., et al. 2011, MNRAS, 416, 1764
- Walsh et al. (1998) Walsh, A. J., Burton, M. G., Hyland, A. R., & Robinson, G. 1998, MNRAS, 301, 640
- Walsh et al. (2012) Walsh, A. J., Purcell, C., Longmore, S., Jordan, C. H., & Lowe, V. 2012, PASA, 29, 262
- Walsh et al. (2014) Walsh, A. J., Purcell, C. R., Longmore, S. N., et al. 2014, MNRAS, 442, 2240
- Wang et al. (2018) Wang, Y., Bihr, S., Rugel, M., et al. 2018, A&A, 619, A124
- Wardle & Yusef-Zadeh (2002) Wardle, M. & Yusef-Zadeh, F. 2002, Science, 296, 2350
- Weaver et al. (1965) Weaver, H., Williams, D. R. W., Dieter, N. H., & Lum, W. T. 1965, Nature, 208, 29
- Wenger et al. (2000) Wenger, M., Ochsenbein, F., Egret, D., et al. 2000, A&AS, 143, 9
- Whiting (2012) Whiting, M. T. 2012, MNRAS, 421, 3242
- Wilson & Barrett (1968) Wilson, W. J. & Barrett, A. H. 1968, Science, 161, 778
- Winnberg et al. (1975) Winnberg, A., Nguyen-Quang-Rieu, Johansson, L. E. B., & Goss, W. M. 1975, A&A, 38, 145
- Wright et al. (2010) Wright, E. L., Eisenhardt, P. R. M., Mainzer, A. K., et al. 2010, AJ, 140, 1868