Quasicrystal vs Glass Transition: comparison structural and dynamical properties.
Abstract
Quasicrystals are solid structures with symmetry forbidden by crystallographic rules. Because of this some structural characteristics of quasicrystals, for instance, radial distribution function, can look similar to the ones of amorphous phases. This is of principal importance since radial distribution function is the main property to characterize the structure in molecular simulation. In the present paper we compare the radial distribution functions and dynamical properties of three systems in the vicinity of glass transition, quasicrystal formation and crystallization. We show that in spite of similarity of radial distribution functions the dynamical properties of a system in the vicinity of quasicrystal are qualitatively equivalent to the ones of crystal. Because of this combination the radial distribution functions with investigation of dynamics of the liquid allows unambiguously distinguish glass and quasicrystal.
pacs:
61.20.Gy, 61.20.Ne, 64.60.KwAll substances except helium crystallize upon cooling. The crystalline phases are characterized by strict long-range order both translational and orientational. However, if the cooling proceeds very fast the crystallization can be avoided and the system transforms into glassy state. Glass transition is among the most complex problems of condensed matter physics. Until now it is not clear whether it is a thermodynamic transition or purely kinetic effect. Usually the glass transition temperature is defined as the temperature at which the viscosity of the substance becomes as high as kobbinder . Glassy state demonstrates some features of solids and some features of liquids. Among the solid-like features the most important is shear rigidity. At the same time the diffraction pattern of glasses does not demonstrate any peaks, i.e. it looks liquid-like.
The wealth of solid structures is not restricted by crystals and glasses only. Another type of solids is quasicrystals (QC). QCs are ordered structures with symmetry restricted by crystallographic rules. Although initially QCs were discovered in metallic alloys qc-discovery , later on it was found that they can be formed in other systems too, for instance, in water solution of micelles qc-micelles , graphene bilayers qc-graphene , etc. Moreover, it was found that even one component systems demonstrate quasicrystalline phase in computer simulation in theree (see, for instance, qc1 ; qc2 ; qc3 ; qc4 ) and two dimensional (see, for instance, qc2d1 ; qc2d2 ; qc2d3 ; qc2d4 ) spaces.
Several studies report formation of QCs in so-called core-softened systems, i.e. the systems with softening of repulsive core of the interaction potential. QCs were observed in such models as Dzugutov potential qc1 , Lennard-Jones plus Gauss model qc3 , repulsive shoulder system (RSS) ryltsev ; ryltsev1 and some other models. Interestingly, in Ref. ryltsev it was found that the ability of a liquid to transform into quasicrystal can be predicted basing on its radial distribution function (rdf) . This assumption was validated by simulation of three different systems which form quasicrystalline phase. In the later works the same group of authors found more different quasicrystalline phases in RSS with different parameters of the interaction potentials were discovered ryltsev2 .
The phase diagram of RSS was widely investigated in a set of papers we1 ; we2 ; we3 ; we4 . This system is defined by the interaction potential of the form:
| (1) |
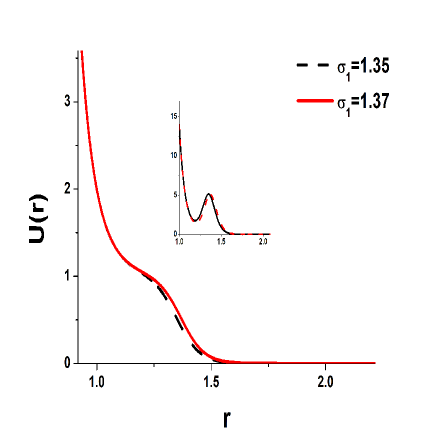
In our previous studies the parameter was set to . The potential for and and is shown in Fig. 1. The parameter determines the width of the repulsive shoulder. It is convenient to express all quantities in the units of the potential, i.e. the parameter serves as a unit of energy and as a unit of length. All other quantities can be expressed from these parameter. Below all quantities are given in these reduced units.
The phase diagram of RSS demonstrates extremely strong dependence on the parameters of the potential. Moreover, it demonstrates many anomalous features similar to the anomalies of water we2 ; we3 ; we5 ; we6 ; we7 ; we8 ; we9 ; we10 ; we11 . Already in the first paper on RSS we1 existence of glass transition in the system with was found. Later on more elaborate study of this glass transition was performed in ryltsev-glass . It was shown that in the range of densities from about up to about the system demonstrates the glass transition. Interestingly, if the width of repulsive shoulder is slightly changed to then a QC phase is formed instead of glass transition ryltsev which once again shows the extreme sensitivity of the phase diagram of RSS to the parameters of the potential.
Having established such interplay between the glass transition and QC formation it becomes of great importance to distinguish between these two phases. In computer simulation the structure of the system is typically characterised by rdfs. Interestingly, the rdfs of QC do not demonstrate any strict ordering (see, for instance, Fig. 1b of Ref. ryltsev ) and look very similar to the ones of glass. Because of this the quasicrystalline structure can be erroneously classified as glass. Correct identification of glass or quasicrystall requires more elaborate study of structural properties of the system, such as Steinhard-Nelson order parameters sn ; sn1 or diffraction patterns.
In the present paper we show that the dynamical properties of the system are very different in the case of QC formation and glass transition. It means that they can be used to distinguish between them even without calculation of bond-order parameter or diffraction patterns. Importantly, the dynamical properties such as means square displacement (MSD) and intermediate scattering function are typically calculated in simulations of glass transition. Therefore, no additional calculations such as diffraction pattern or order parameters is required.
In the present study we simulate by means of molecular dynamics method a system of 4000 particles interacting with RSS potential with for glass-forming system and with for the system forming QC. Cubic box with periodic boundaries is used in both cases. The time step is set to for and for . In both cases steps are made for equilibration of the system. NVT ensemble (constant number of particles N, volume V and temperature T) is used at this stage. After that microcanonical simulation (constant number of particles N, volume V and internal energy E) for more steps is performed. We calculate the internal energy and pressure of the system. To characterise the structure we compute the radial distribution functions and the structure factors of the system. The dynamical properties are characterized by mean square displacement, the intermediate scattering function and stress-stress autocorrelation function.
The intermediate scattering function if defined as , where the wave vector is selected as the first maximum of the structure factor. The stress tensor is defined as , where is x component of velocity of th particle, the x component of the vector connecting i-th and j-th particles and is y component of the force between these particles. The off-diagonal components of the stress tensor can be used to calculate the shear viscosity via Green-Kubo relation .
In the case of RSS with the density is where the system demonstrates glass transition at low temperature we1 ; ryltsev-glass . Additional calculations are made for the density where the system crystallizes upon cooling.
RSS with is simulated at where appearance of QC phase is found ryltsev .
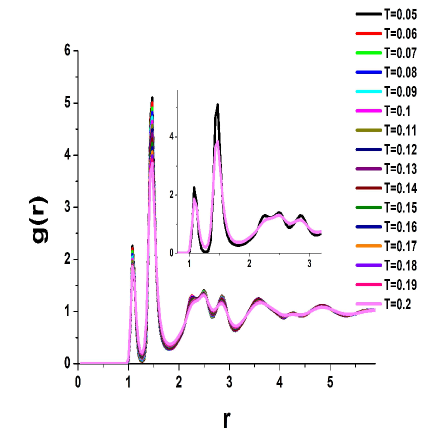
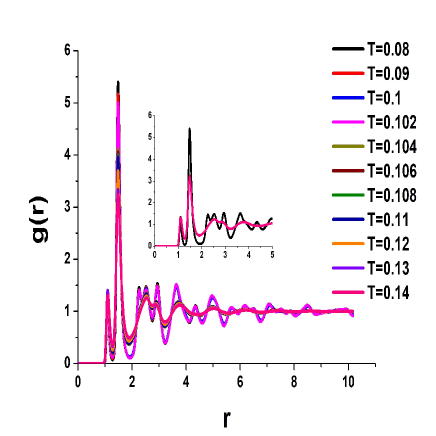
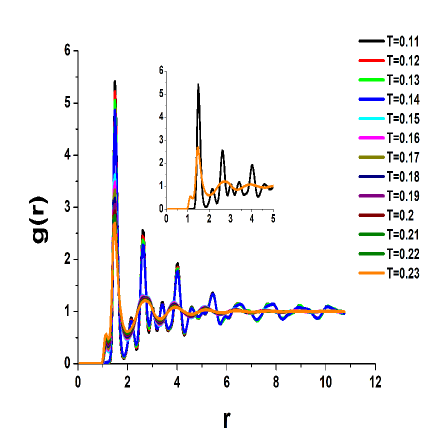
Fig. 2 shows rdfs of RSS with at , i.e. in the glass forming region. The temperature is from and to . One can see that the first peak of rdf splits into two subpeaks which is an intrinsic property of systems with two length scales. More peaks appear at low temperatures, however, these peaks are not characteristic to any crystalline structure and they signalize that the structure is frozen in some glassy state.
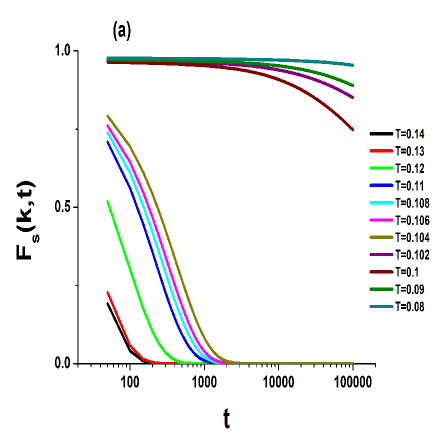
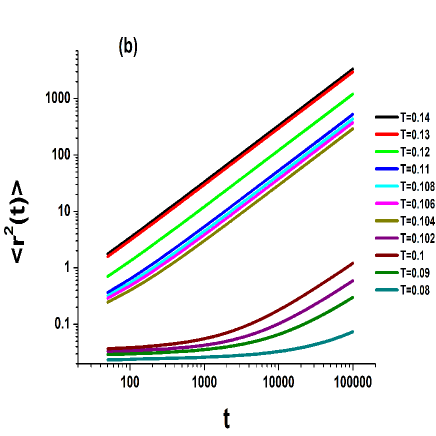
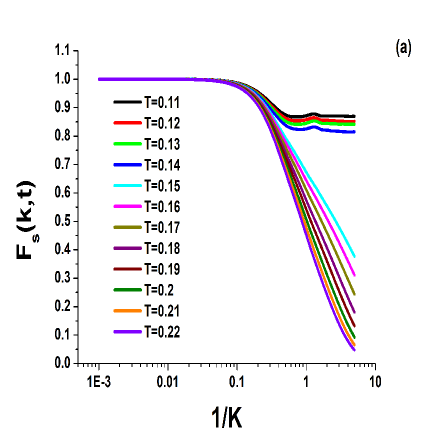
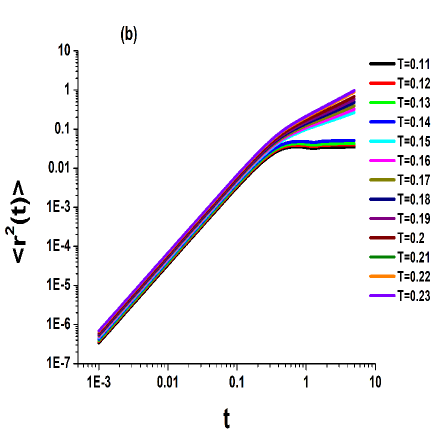
The appearance of the glassy state is confirmed by the calculations of MSD and intermediate scattering function (Fig. 3 (a) and (b)). One can see rapid decay of at high temperatures. As the temperature is lowered the decay becomes much slower and finally the intermediate scattering function does not decay noticeably within the simulation time. Analogously, MSD rapidly increases at high temperature, whilst at low temperatures the particles do not leave their cages: the MSD does not exceed 0.05 particle diameters within the simulation time.
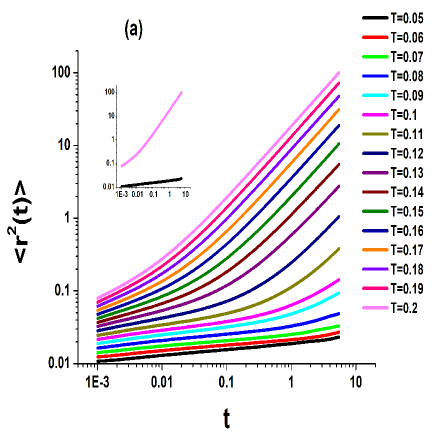
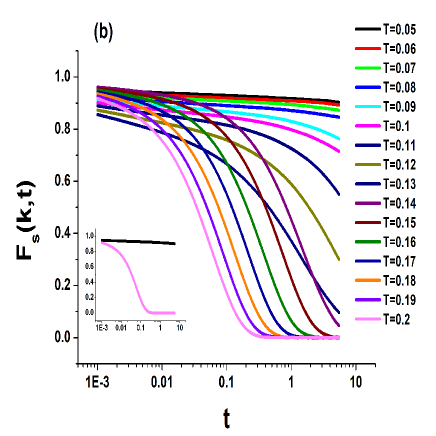
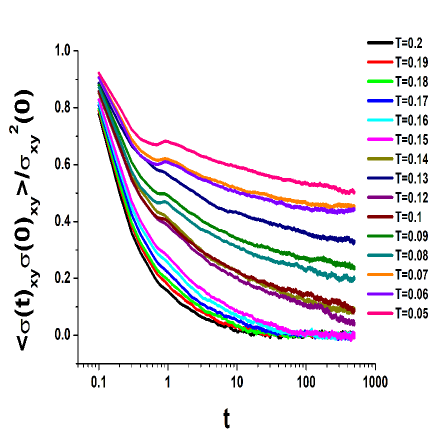
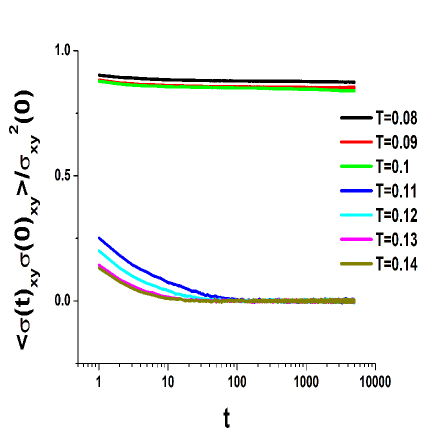
Fig. 4 shows the stress autocorrelation function of the same system. At high temperature the stress autocorrelation decays to zero. However, at it does not reach zero within the simulation time, and therefore the shear viscosity cannot be obtained by our calculations for the temperatures . Moreover, the time of decay of stress autocorrelation functions becomes larger with lowering of the temperature, which means that the system becomes more viscous. This conclusion can be made without precise calculation of the viscosity which becomes impossible in frames of the present work.
The situation becomes different in the case of the formation of QC. Fig. 5 shows the rdf of the RSS with at at temperature from up to . The formation of QC takes place at . The rdfs of the system demonstrate some peaks and looks relatively ordered. However, they are not much different from the ones of glass and indeed may be considered as very low temperature glass. However, the behavior of intermediate scattering function and MSD is extremely different from the one of glass forming system. Fig. 6 (a) and (b) show the intermediate scattering functions and the MSD of the RSS with . One can see that at high temperature they looks like the ones of a normal liquid. However, when the temperature is slightly change from to the curves of both and MSD experience sharp qualitative change: below stops to decay and MSD stops to increase. Importantly, the in the case of QC formation one observes a sharp change of the behavior, while in the case of glass formation all quantities change smoothly.
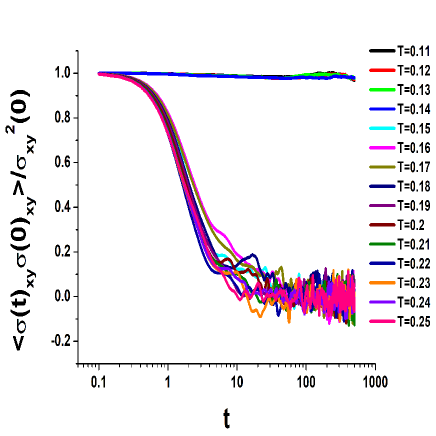
The jump-like nature of the dynamical properties becomes even more evident from the behavior of stress autocorrelation function (Fig. 7). One can see that the stress autocorrelation functions do not demonstrate any decay below the point of QC formation, i.e. formally the viscosity becomes infinite, which corresponds to the solid state of matter.
We compare the behavior of QC forming system with the one of the system which forms a crystal. For this comparison we choose the RSS with at the density where the system transforms into face centered cubic (FCC) lattice under cooling. Fig. 8 shows the rdfs of the system. One can see that at high temperature the system is liquid, while at low temperature numerous ordered peaks are observed, which means that the system crystallizes. Fig. 9 (a) and (b) demonstrate the intermediate scattering function and MSD of the system at different temperatures. The qualitative behavior of these quantities is the same that in the case of QC formation: upon a tiny change of the temperature (from to ) the intermediate scattering function stops to decay, while the MSD stops to increase. The same conclusion is valid for the stress autocorrelation function: it rapidly decays if and does not decay at all if . Therefore, the behavior of the dynamical characteristics of the system is similar in the case of crystallization and QC formation, but qualitatively different in the case of glass transition.
In conclusion, in the present paper we study the behavior of rdfs and several dynamical characteristics of matter upong crossing the line of crystallization, QC formation and glass transition. We find that the rdfs of QC can be very similar to the ones of glass and therefore it is not enough to characterize the structure of the system by rdfs only. One needs more elaborate methods of the structure description. Alternatively, one may compare the dynamical characteristics, like intermediate scattering function, MSD and stress autocorrelation function. In the case of glass transition all these functions change smoothly upon cooling. In the case of crystallization and QC formation they experience a jump, which signalize the formation of a solid phase (crystal or QC). The effect is the most pronounced in the stress autocorrelation functions. Since the integral of these functions is related to the shear viscosity via Green-Kubo relation, one can say that in the case of glass transition the viscosity continuously increases with temperature, while in the case of crystallization of QC formation it remains finite in the liquid phase down to the transition point, while below it the shear viscosity becomes infinite as it should be in the case of solid.
This work was carried out using computing resources of the federal collective usage center ”Complex for simulation and data processing for mega-science facilities” at NRC ”Kurchatov Institute”, http://ckp.nrcki.ru, and supercomputers at Joint Supercomputer Center of the Russian Academy of Sciences (JSCC RAS). The work was supported by the Russian Foundation of Basic Research (Grant No 18-02-00981).
References
- (1) K. Binder and W. Kob, Glassy Materials and Disordered Solids, World Scientific Publishing, Singapour (2005).
- (2) D. Shechtman, I. Blech, D. Gratias, J.W. Cahn, Phys. Rev. Lett. 53(20), 1951-1954 (1984).
- (3) St. Fischer, et. al., PNAS 108(5), 1810 1814 (2011).
- (4) W. Yao, et. al., PNAS 115 (27), 6928-6933 (2018).
- (5) M. Dzugutov, Phys. Rev. Lett. 70, 2924 (1993).
- (6) M. Engel, P. F. Damasceno, C. L. Phillips and S. C. Glotzer, Nat. Mater. 14, 109 116 (2015).
- (7) M. Engel and H.-R. Trebin, Phys. Rev. Lett. 98, 225505 (2007).
- (8) A. S. Keys and Sh. C. Glotzer, Phys. Rev. Lett. 99, 235503 (2007).
- (9) A. J. Archer, A. M. Rucklidge, and E. Knobloch, Phys. Rev. Lett. 111, 165501 (2013).
- (10) N. P. Kryuchkov, S. O. Yurchenko, Yu. D. Fomin, E. N. Tsiok, and V. N. Ryzhov, Soft Matter, 14, 2152-2162 (2018).
- (11) Yu. D. Fomin, E. A. Gaiduk, E. N. Tsiok, and V. N. Ryzhov, Molecular Physics 116, 3258-3270 (2018).
- (12) M. Zu, P. Tan, and N. Xu, Nat. Comm. 8, 2089 (2017).
- (13) R. Ryltsev, B. Klumov, and N. Chtchelkatchev, Soft Matter 11, 6991 (2015).
- (14) R. E. Ryltsev, N. M. Chtchelkatchev, Soft Matter 13, 5076-5082 (2017).
- (15) R. E. Ryltsev, Doctoral thesis (in Russian) (2019).
- (16) Yu. D. Fomin, N. V. Gribova, V. N. Ryzhov, S. M. Stishov, and D. Frenkel, J. Chem. Phys. 129, 064512 (2008).
- (17) N. V. Gribova, Yu. D. Fomin, D. Frenkel, and V. N. Ryzhov, Phys. Rev. E 79, 051202 (2009).
- (18) Yu. D. Fomin, N.V. Gribova and V.N. Ryzhov, DDF 277, 155 (2008).
- (19) Yu. D. Fomin, E. N. Tsiok, and V. N. Ryzhov, J. Chem. Phys. 135, 234502 (2011).
- (20) Yu. D. Fomin and V. N. Ryzhov, N. V. Gribova, Phys. Rev. E 81, 061201 (2010).
- (21) Yu.D. Fomin, V.N. Ryzhov, Physics Letters A 375, 2181 2184 (2011).
- (22) Yu.D. Fomin, V.N. Ryzhov, Physics Letters A 377, 1469 1473 (2013).
- (23) Yu. D. Fomin, V. N. Ryzhov, B. A. Klumov, and E. N. Tsiok, J. Chem. Phys. 141, 034508 (2014).
- (24) Yu. D. Fomin. E. N. Tsiok, V. N. Ryzhov, Phys. Rev. E 87, 042122 (2013).
- (25) Yu.D. Fomin, E.N. Tsiok, and V.N. Ryzhov, Eur. Phys. J. Special Topics 216, 165 173 (2013).
- (26) Yu. D. Fomin, E. N. Tsiok, and V. N. Ryzhov, J. Chem. Phys. 135, 124512 (2011).
- (27) R. E. Ryltsev, N. M. Chtchelkatchev, and V. N. Ryzhov, Phys. Rev. Lett. 110, 025701 (2013).
- (28) P. J. Steinhardt, D. R. Nelson and M. Ronchetti, Phys. Rev. Lett., 47, 1297 1300 (1981).
- (29) P. J. Steinhardt, D. R. Nelson and M. Ronchetti, Phys. Rev. B, 28, 784 805 (1983).
- (30) http://lammps.sandia.gov/