J-PLUS: the impact of bars on quenching time-scales in nearby green valley disc galaxies
Abstract
Context. Between the blue cloud and the red sequence peaks on the galaxy colour-magnitude diagram there is a region sparsely populated by galaxies, called the green valley. In a framework where galaxies mostly migrate on the colour-magnitude diagram from star-forming to quiescent, the green valley is considered a transitional galaxy stage. The details of the processes that drive galaxies from star-forming to passive systems still remain unknown.
Aims. We aim to measure the transitional time-scales of nearby galaxies across the green valley (quenching time-scales) through the analysis of Galaxy Evolution Explorer and Javalambre Photometric of Local Universe Survey photometric data. Specifically, we seek to study the impact of bars on the quenching time-scales.
Methods. We develop a method that estimates empirically the star formation quenching times-scales of green valley galaxies, assuming an exponential decay model of the star formation histories and through a combination of narrow and broad bands from Javalambre Photometric of Local Universe Survey and Galaxy Evolution Explorer. We correlate these quenching time-scales with the presence of bars.
Results. We find that the Javalambre Photometric of Local Universe Survey colours F0395 and F0410 are sensitive to different star formation histories, showing, consequently, a clear correlation with the Dn(4000) and Hδ,A spectral indices. We measure quenching time-scales based on these colours and we find that quenching time-scales obtained with our new approach are in agreement with those determined using spectral indices. We also compare the quenching time-scales of green valley disc galaxies as a function of the probability of hosting a bar. We find that galaxies with high bar probability tend to quench their star formation slowly.
Conclusions. We conclude that: 1) Javalambre Photometric of Local Universe Survey filters can be used to measure quenching time-scales in nearby green valley galaxies; and 2) the resulting star formation quenching time-scales are longer for barred green valley galaxies. Considering that the presence of a bar indicates that more violent processes (e.g., major mergers) are absent in host galaxies, we conclude that the presence of a bar can be used as a morphological signature for slow star formation quenching.
Key Words.:
galaxies: evolution galaxies: spiral galaxies: star formation galaxies: stellar content galaxies: structure1 Introduction
It is now well known that galaxies in the local Universe can generally be separated into two broad classifications with respect to their star formation activity: blue star-forming (blue cloud) galaxies, composed mostly by disc galaxies, and red passive systems (red sequence) typically composed by elliptical and lenticular galaxies with little or no recent star formation (e.g., Strateva et al., 2001; Kauffmann et al., 2003; Shen et al., 2003; Baldry et al., 2004; Balogh et al., 2004; Menci et al., 2005). The star formation rate (SFR) of blue galaxies is well correlated with their stellar mass (M∗), defining the main-sequence of star-forming galaxies in the SFR-M∗ plane (Brinchmann et al., 2004; Salim et al., 2007; Gilbank et al., 2010; McGee et al., 2011). This correlation was already in place at (Willmer et al., 2006; Noeske et al., 2007) and possibly at (e.g., Brammer et al., 2009; Taylor et al., 2009; Whitaker et al., 2012; Speagle et al., 2014). Most tellingly, the number density of red passive galaxies has roughly doubled since , while the number of blue galaxies has remained nearly constant (Bell et al., 2004; Brown et al., 2007; Faber et al., 2007; Ilbert et al., 2013; Muzzin et al., 2013; Sobral et al., 2014). This motivates the search for processes that cause blue, star-forming galaxies to transition to red, non-star-forming ones. This transition has become known as quenching.
Between the blue cloud and the red sequence peaks on galaxy colour-magnitude diagram (CMD) there is a narrow region, sparsely populated by galaxies, known as the green valley (Martin et al., 2007; Salim et al., 2007; Wyder et al., 2007; Schawinski et al., 2014; Renzini & Peng, 2015; Smethurst et al., 2015; Díaz-García et al., 2017; Nogueira-Cavalcante et al., 2018). The physical properties of galaxies in the green valley region are different from those in either the blue cloud or the red sequence, exhibiting intermediate characteristics, for instance the age of stellar population and local environment (Pan et al., 2013), the specific star formation rate (Salim, 2014) and galaxy structures parametrized by Sérsic indices (Bremer et al., 2018). The intermediate nature of green valley suggests that green valley galaxies are quenching their star formation, starting in the blue cloud phase, reaching the red sequence afterwards. The typical quenching time-scales, i.e., the duration of the green valley phase, is a function of cosmic time; the galaxy transition across the green valley in the local Universe () takes, on average, Gyrs (Martin et al., 2007; Bremer et al., 2018), whereas at intermediate redshifts () the average of green valley quenching phase lasts less than 500 Myrs (Gonçalves et al., 2012). External events can trigger new episodes of star formation in quiescent red galaxies, the galaxy bluewards through the CMD. Pan et al. (2014) found that more than 50% of green valley early-type galaxies at have blue central cores, supporting a scenario of recent gas-rich mergers. This result is in agreement with simulations that predict that up to of green valley galaxies at are passive galaxies increasing their star formation activity (Trayford et al., 2016). These galaxies could be early-type galaxies which live in the centres of galaxy clusters and occasionally capture a lower-mass gas-rich galaxy (e.g., Martin et al., 2017; Darvish et al., 2018). However, it is observed that the red sequence region has grown, at least, since (Bell et al., 2004; Brown et al., 2007; Faber et al., 2007; Ilbert et al., 2013; Muzzin et al., 2013) and, therefore, it is reasonable to consider that, for the majority of galaxies, the galaxy transition on CMD is from the blue cloud to the red sequence, passing through the green valley.
Many possible quenching mechanisms that lead galaxies to the green valley have been proposed, for both low and high redshifts. Overall, these mechanisms can be classified as rapid processes, i.e., those able to quench star formation on a scale of hundreds of Myrs, and slow processes, taking more than 1 Gyr to completely quench star formation. Rapid processes can encompass, for instance, negative feedback from active galactic nuclei AGN (e.g., Di Matteo et al., 2005; Springel et al., 2005a; Ciotti & Ostriker, 2007; Cattaneo et al., 2009; Martin et al., 2007; Schawinski et al., 2009; Dubois et al., 2013; Bongiorno et al., 2016; Smethurst et al., 2016; Kocevski et al., 2017), major mergers (e.g., Toomre, 1977; Springel et al., 2005b; Conselice, 2006) and violent disc instability (e.g., Dekel & Burkert, 2014; Zolotov et al., 2015; Nogueira-Cavalcante et al., 2019). These mechanisms are claimed to explain the formation of most passive dead galaxies. Stellar feedback (e.g., Menci et al., 2005; Lagos et al., 2013) is another example of a rapid process and is generally claimed to explain quenching in low-mass galaxies. Slow processes can involve interactions in clusters and groups (e.g., Gunn & Gott, 1972; White, 1976; Hausman & Ostriker, 1978; Moore et al., 1998; Abadi et al., 1999; Balogh et al., 1999, 2004; Boselli et al., 2006; Capak et al., 2007; Moran et al., 2007; van den Bosch et al., 2008; Wetzel et al., 2013; Peng et al., 2015; Darvish et al., 2016; Hatfield & Jarvis, 2017; Smethurst et al., 2017; van de Voort et al., 2017; Darvish et al., 2018) and secular evolution through internal galaxy structures like spiral arms and, specially, stellar bars (e.g., Kormendy & Kennicutt, 2004; Sheth et al., 2005; Masters et al., 2010, 2011; Mendez et al., 2011; Cheung et al., 2013). Although different galaxy mechanisms can act simultaneously, observations suggest that quenching processes that correlate with stellar mass are independent from those that correlate with galaxy environment (Peng et al., 2010; Sobral et al., 2014).
Even though the details concerning the physical processes responsible for the galaxy transition across the green valley are not known, recent works have given clues on how quenching processes act in galaxies. Rowlands et al. (2018) found that, at , the red sequence has grown faster for intermediate- mass galaxies (M M⊙) than for those with high stellar masses (M M⊙). Furthermore, evidence for multiple evolutionary quenching pathways has been shown by Schawinski et al. (2014) and Maltby et al. (2018) for galaxies at low and high redshifts, respectively. These results suggest that multiple quenching processes act simultaneously and in different ways at different cosmic times. Therefore, the green valley must present different characteristics in different epochs of the Universe, since, by definition, it is a transitional region of galaxies. In fact, the population of green valley galaxies is different in the local Universe, exhibiting mostly S0 and Sa disc morphologies (Salim, 2014; Schawinski et al., 2014; Evans et al., 2018; Bremer et al., 2018), as opposed to those at intermediate redshifts, which often exhibit elliptical and distorted morphologies (Nogueira-Cavalcante et al., 2018). These general results suggest that violent processes (associated with more elliptical and distorted morphologies at intermediate redshifts) are more frequent for a younger Universe whereas secular evolution is more common at low redshifts.
A useful way to understand how galaxies transition from the blue cloud to the red sequence is by measuring how long it takes for galaxies to cross the green valley. Martin et al. (2007) developed a method that estimates quenching time-scales for green valley galaxies (Section 2), based on photometry and spectroscopy from Sloan Digital Sky Survey (SDSS, York et al., 2000) and photometry from Galaxy Evolution Explorer (GALEX, Martin et al., 2005). However, one difficulty with this method is the need spectroscopic data. Big spectroscopic surveys, like SDSS, zCOSMOS (Lilly et al., 2007) and LEGA-C (van der Wel et al., 2016; Straatman et al., 2018) pre-select only the brightest galaxies. Moreover, in the case of SDSS galaxy spectra, the fiber diameter is 3′′, restricting observations to the centre of nearby galaxies.
We develop in this work a new approach to estimate quenching time-scales in green valley galaxies that circumvents this difficulty, based on the Martin et al. (2007) method, but using only photometric galaxy data. The lack of spectra is compensated by the narrow band filters of the photometric system of the Javalambre Photometric of Local Universe Survey111www.j-plus.es (J-PLUS, Cenarro et al., 2019). This is an ancillary survey of the Javalambre Physics of the accelerating universe Astrophysical Survey222www.j-pas.org (J-PAS, Benitez et al., 2014), which will observe 8500 deg2 of the sky with 56 narrow band filters. J-PLUS observations are carried out from the Javalambre Observatory in Spain, with the Javalambre Auxiliary Survey Telescope (JAST/T80), which is an 0.83m telescope, equipped with the camera T80Cam, supplying a field of view of 3 deg2 in a pixel-scale of 0.55”. Additionally, its filter set is composed by a total of 12 optical filters: 4 broad (, , and ), 2 intermediate (JAVA and F0861) and 6 narrow (F0378, F0395, F0410, F0430, F0515 and F0660).
In this work we show the application of this new approach in a sample of nearby green valley disc galaxies and we analyze the dependence of the measured quenching time-scales of these galaxies on their probability of hosting a bar. Stellar bars are present in more than half of nearby spiral galaxies (e.g., Menéndez-Delmestre et al., 2007; Sheth et al., 2008; Masters et al., 2011) and are associated with the redistribution of angular momentum of the baryonic and dark matter components (Sellwood, 1981; Athanassoula, 2003; Athanassoula et al., 2013; Machado & Athanassoula, 2010), formation of rings and lens structures (Kormendy & Kennicutt, 2004), induction of star formation activity in the central parts of host galaxies (Sheth et al., 2005; Coelho & Gadotti, 2011; Oh et al., 2012; Wang et al., 2012), formation of pseudobulges (Sheth et al., 2005; Méndez-Abreu et al., 2008; Aguerri et al., 2009), and possibly feeding active galactic nucleus (AGN) activity (Shlosman et al., 1989; Ho et al., 1997; Oh et al., 2012).
We structure this paper as follows. In Section 2 we describe the original method by Martin et al. (2007) to measure quenching time-scales and our new approach based on that method. In Section 3 we apply our method to nearby green valley disc galaxies and analyzed how their morphological parameters can impact quenching time-scales. In Section 4 we discuss the robustness of our approach. The results are summarized in Section 5. Throughout this paper we adopt AB magnitudes and standard CDM cosmology: km s-1 Mpc-1, and .
2 Measuring star-formation quenching time-scales in green valley galaxies
In this work we develop a method that estimates quenching time-scales in nearby green valley galaxies, with J-PLUS and GALEX photometric data, and based on the work described in Martin et al. (2007). The main difficulty in that approach with J-PLUS data is that we cannot directly compare the J-PLUS magnitudes with SDSS spectral indices due to the limited fiber aperture of in diameter of SDSS spectra. For instance, up to , only the bulge of a Milky Way-like galaxy is observed with such aperture. One way to circumvent this issue is through constructing J-PLUS spectral energy distributions (SED) from SDSS spectra. To that end, we used a python package called pysynphot (Lim et al., 2015; STScI development Team, 2013) as well as the appropriate parameters given the survey/telescope properties (for further details we refer the reader to Cenarro et al., 2019). In next sections we describe the selection of green valley galaxies in SDSS data, the original Martin et al. (2007) method that this work is based on and our new approach that measure quenching time-scales in green valley galaxies from J-PLUS photometry.
2.1 Selection of green valley galaxies
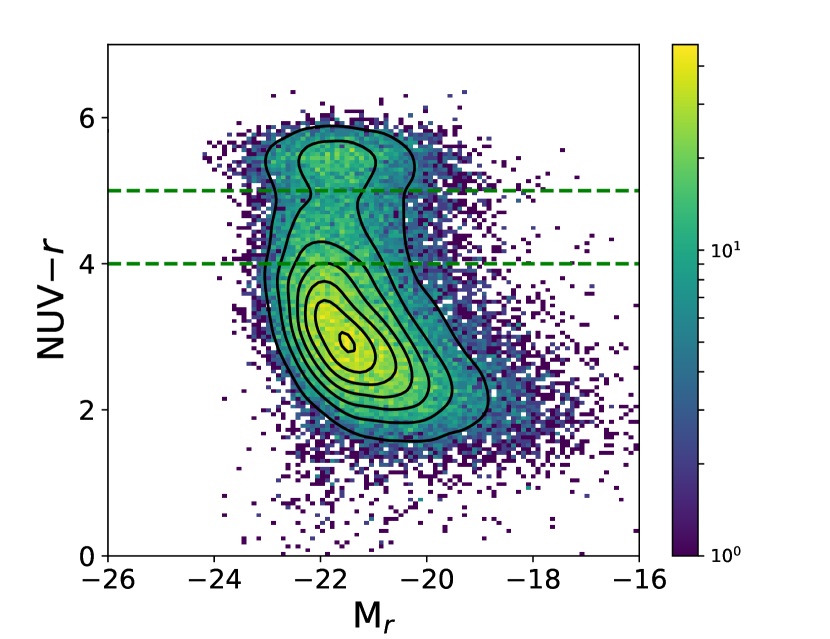
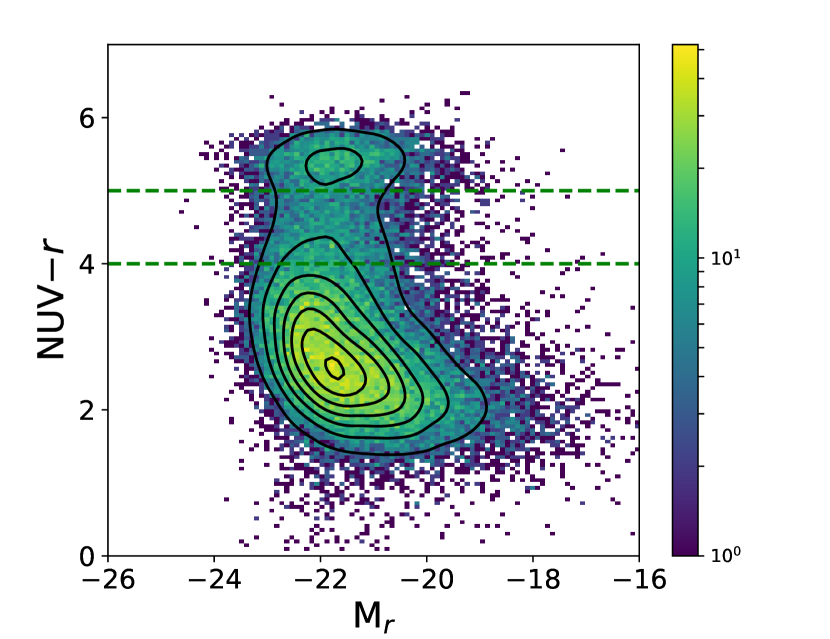
We select green valley galaxies from the traditional galaxy CMD (Fig. 1), using two broad bands: the Near-Ultraviolet (NUV) band, from GALEX GR6/GR7 (Martin et al., 2005), and band, from SDSS DR12 (Alam et al., 2015). We retrieve spectra and photometry through GALEX CasJobs database333https://galex.stsci.edu/casjobs/0; also, following the selection criteria of Martin et al. (2007): redshift range of ; NUV weight ; NUV artifact ; apparent NUV magnitude ; and apparent magnitude . We cross-match SDSS and GALEX samples within a radius of and apply Seaton (1979) model to correct for Galactic extinction and k-correct SDSS and GALEX magnitudes using the k-correction calculator (the python version of the K-correction calculator444http://kcor.sai.msu.ru/getthecode/, Chilingarian et al., 2010; Chilingarian & Zolotukhin, 2012)). We use the definition of the green valley on the CMD as the region between , as estimated by previous works (e.g., Martin et al., 2007; Gonçalves et al., 2012; Salim, 2014; Nogueira-Cavalcante et al., 2018, 2019). From the green valley sample we sub-select those galaxies with error of Hδ,A spectral index lower than 1 Å. This is a necessary condition to properly determine the best star formation history model from stellar population synthesis codes (see Section 2.2 and also Gonçalves et al., 2012). With these constraints, the initial number of green valley galaxies is comprised of 2,865 objects.
The green valley is not only populated by transitional galaxies but also by star-forming galaxies obscured by dust. We properly correct galaxy magnitudes through the flux of the Hα and Hβ emission lines, estimating the excess in colour, , following the prescription by Calzetti et al. (1994):
| (1) |
where the term 0.44 takes into account that we are estimating stellar continuum extinction through nebular emission (Calzetti et al., 1994). In other words, the extinction in the stellar continuum is roughly half of the value for ionized gas. To convert into extinction in SDSS and GALEX magnitudes we use the relation:
| (2) |
where is the extinction in magnitudes at the wavelength and is the extinction curve by Calzetti et al. (2000). For :
| (3) |
and for :
| (4) |
The CMD corrected by intrinsic dust extinction is shown in Fig. 1. The final number of green valley galaxies 2,043, after excluding star-forming galaxies obscured by dust from the initial sample.
2.2 Martin et al. (2007) method
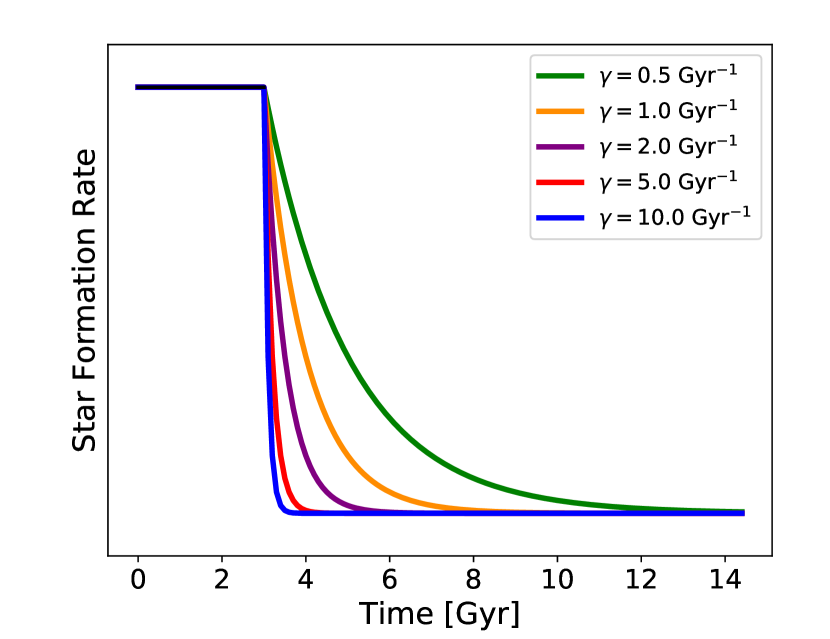
This method considers a very simple parametric model for the star formation histories (SFHs) of green valley galaxies (Fig. 2): a constant star formation rate for the first billions of years, which corresponds to the blue cloud phase, followed by a period of exponential decay (green valley phase):
| (5) |
| (6) |
where is a characteristic time and the exponential index () is in units of Gyr-1. This model is not strictly sensitive to (see Fig. 3), since the parameters used to estimate evolve very weakly during the star-forming phase (for full details see Nogueira-Cavalcante et al., 2018). For instance, Martin et al. (2007) used Gyrs, whereas Gonçalves et al. (2012) and Nogueira-Cavalcante et al. (2018, 2019) used Gyrs. In this work we consider Gyrs, which corresponds to the peak of star formation density of the Universe (e.g, Madau & Dickinson, 2014). It is worth mentioning that the only constraint is that must be greater than zero. The index is the free parameter of this method, which reflects to the speed of quenching (for smaller , slower quenching; larger , faster quenching). The inverse of the exponential index (1/) corresponds to a time-scale, during which the star formation rate decreases from the initial star formation rate before quenching phase (-folding time). We call this time-scale hereafter as quenching time-scale.
To estimate indices for green valley galaxies, Martin et al. (2007) consider three different observables, measured in the rest-frame: one photometric, the NUV, and two spectroscopic, the 4000 Å break (Dn(4000), Bruzual A., 1983) and Hδ absorption line (Hδ,A, Worthey & Ottaviani, 1997). These indices are defined as follows:
| (7) |
and
| (8) |
where is the continuum flux, defined by a straight line through the average flux density (in Å) between 4041.604079.75 and 4128.504161.00.
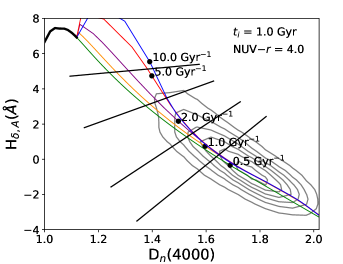
Thus, index is a function of these parameters, i.e., . Particularly, the Dn(4000) and Hδ,A spectral indices define a well established plane, where each position indicates a different galaxy star formation history (Kauffmann et al., 2003). Fig. 3 shows a plane, where coloured curves represent the expected temporal evolution of the values of these spectral indices from a stellar population synthesis model, considering the star formation history described by Eqs. 5 and 6. We use five different values to reproduce these curves: 0.5 Gyr-1, 1 Gyr-1, 2 Gyr-1, 5 Gyr-1 and 10 Gyr-1, using Bruzual & Charlot (2003) models, with solar metallicities, Padova 1994 stellar evolutionary tracks (Alongi et al., 1993; Bressan et al., 1993; Fagotto et al., 1994b, a) and initial mass function from Chabrier (2003). The black dots for each colour lines on these planes represent the exact predicted value from Bruzual & Charlot (2003) models for a specific NUV colour. In other words, for different NUV colours there are different values of the spectral indices for the same SFHs. We also show in Fig. 3 the plane for different values of (1 Gyr, 3 Gyr and 6 Gyr). The position of the black dots does not change considerably for different values of , demonstrating that our model is weakly depend of the parameter.
However, the SFHs of real green valley galaxies are more complex than those described by Eqs. 5 and 6, reflecting a dispersed distribution of green valley spectral indices on plane (gray curves in Fig. 3). Therefore, we expect that the spectral indices measured from green valley galaxy spectra are not exactly those predicted from Bruzual & Charlot (2003) models. To take this into account the plane is divided in parts, so that between two consecutive points (dots) we define a perpendicular bisector, which corresponds to the geometric average of the two values. For instance, between the dots which correspond to 0.5 Gyr-1 and 1 Gyr-1 the bisector corresponds to 0.707 Gyr-1. We interpolate the entire plane, associating each coordinate to a single specific value. For more details on this process see Nogueira-Cavalcante et al. (2018).
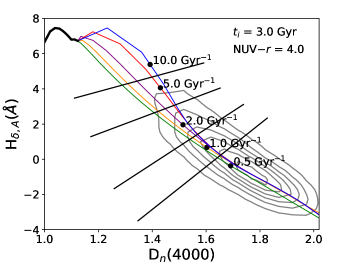
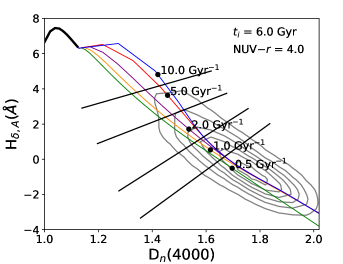
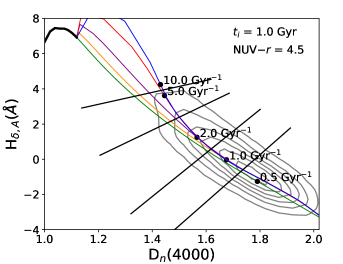
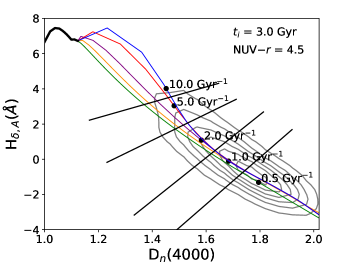
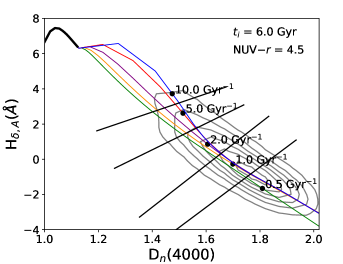
two consecutive black dots, dividing the plane in parts and allowing us to computationally interpolate it. For different values of the position of black dots does not change considerably, demonstrating that our model is weakly depend of the parameter.
2.3 New photometry-only approach with J-PLUS
We seek a set of J-PLUS filters that can, efficiently, substitute the Dn(4000) and Hδ,A spectral indices. Therefore, for each SDSS spectrum we estimate a J-PLUS SED in the F0395, F0410 and J-PLUS filters. We chose these filters because they lie approximately in the same region of the Dn(4000) and Hδ,A spectral indices, as shown in Fig. 4. Figs. 5 and 6 show the F0395 and F0410 colours as functions of Dn(4000) and Hδ,A spectral indices, respectively. There are clear correlations among these quantities, demonstrating that, in principle, these colours can be used instead of the Dn(4000) and Hδ,A spectral indices to estimate quenching time-scales.
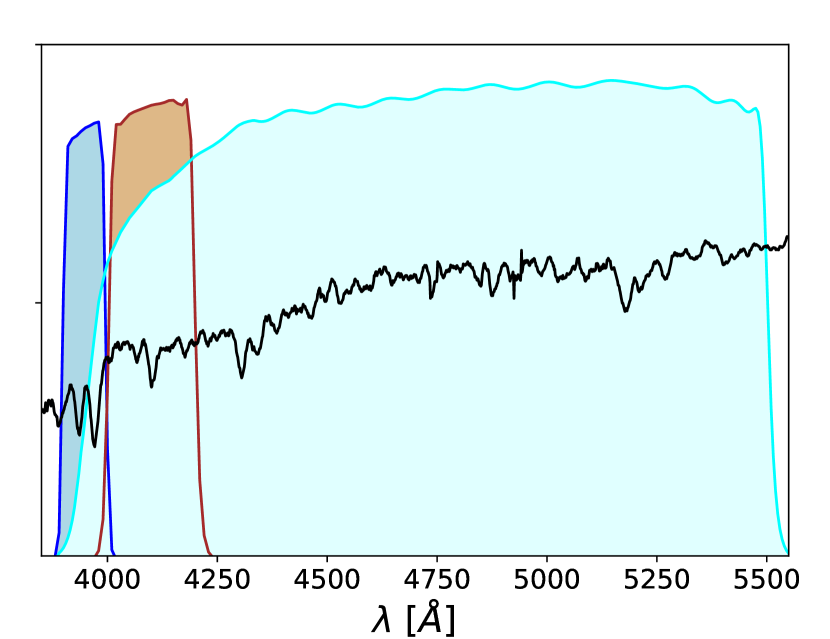
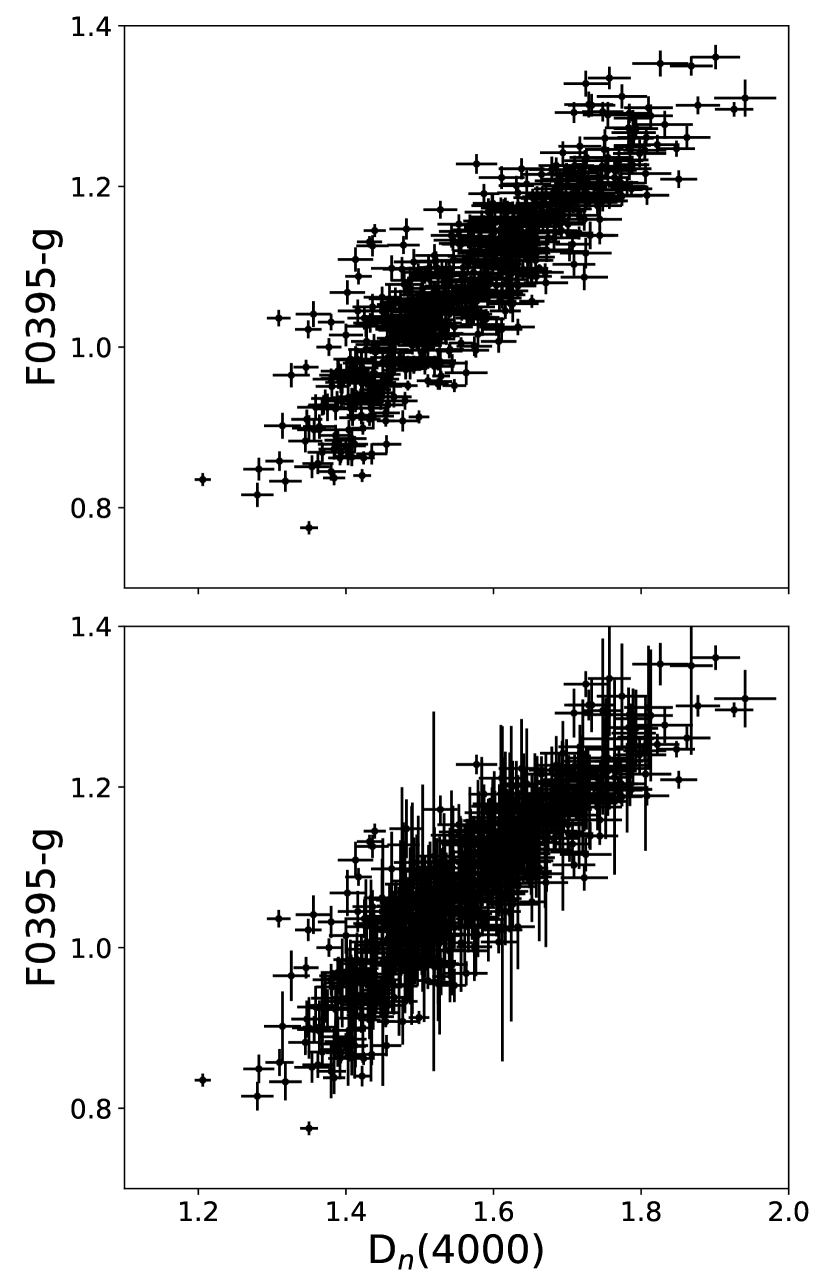
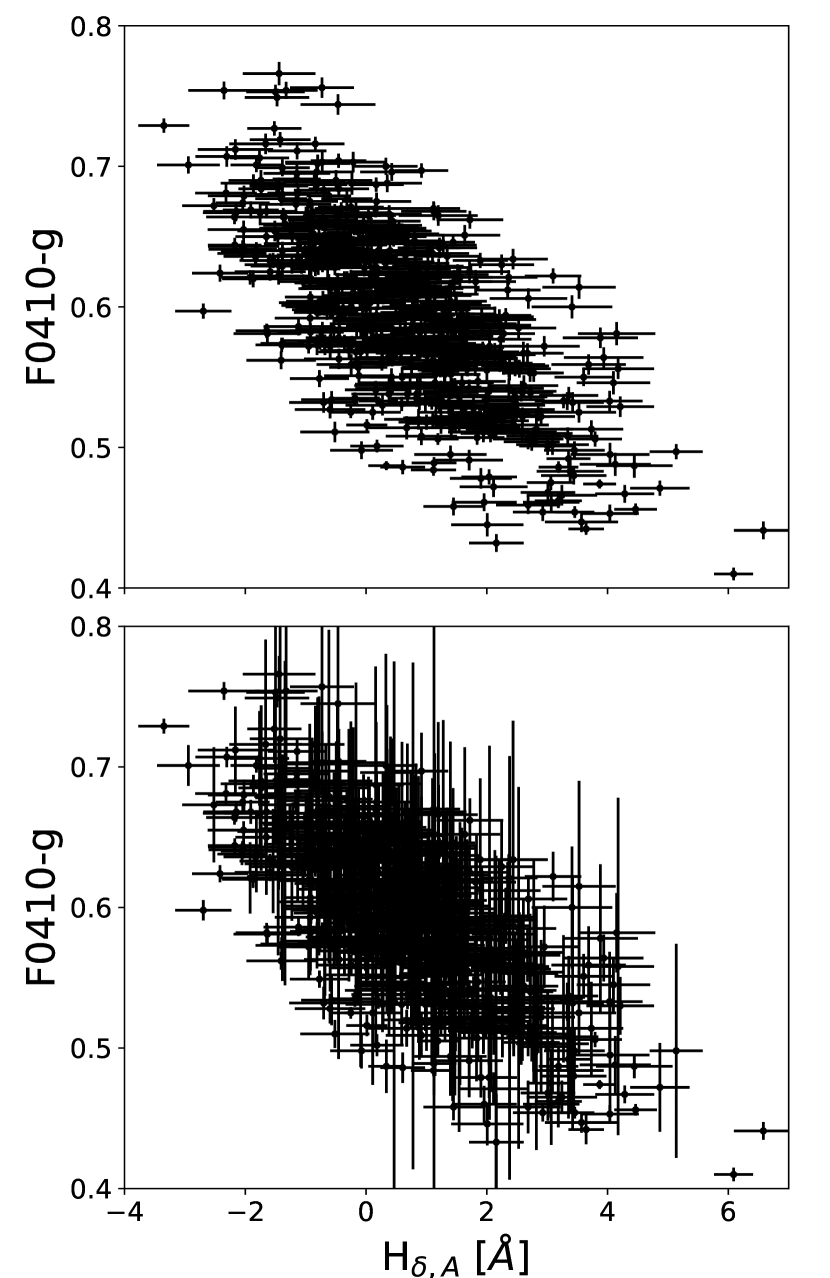
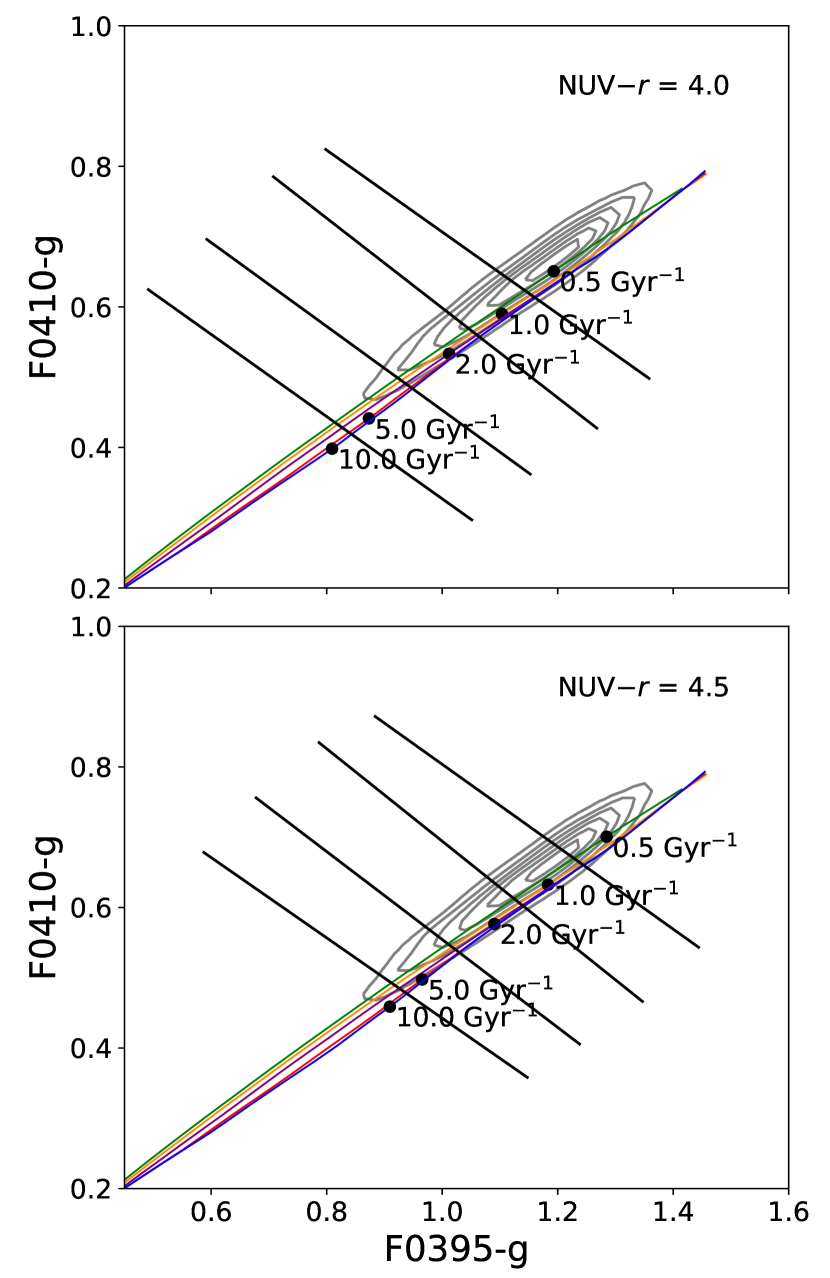
Fig. 7 shows the same distribution of green valley galaxies and the predicted curves by Bruzual & Charlot (2003) models as in Fig. 3, but now on the plane. The procedure to estimate indices from this diagram is similar to that followed with the plane. For each two consecutive points, which correspond to the predicted values by Bruzual & Charlot (2003) models for a specific NUV value, we construct a bisector, corresponding to the geometric average of the involved dots. Following this procedure we divided all the plane in parts, similarly to the plane, by Martin et al. (2007). We then compared the estimated quenching time-scales between Martin et al. (2007) and our new approach (Fig. 8).
.
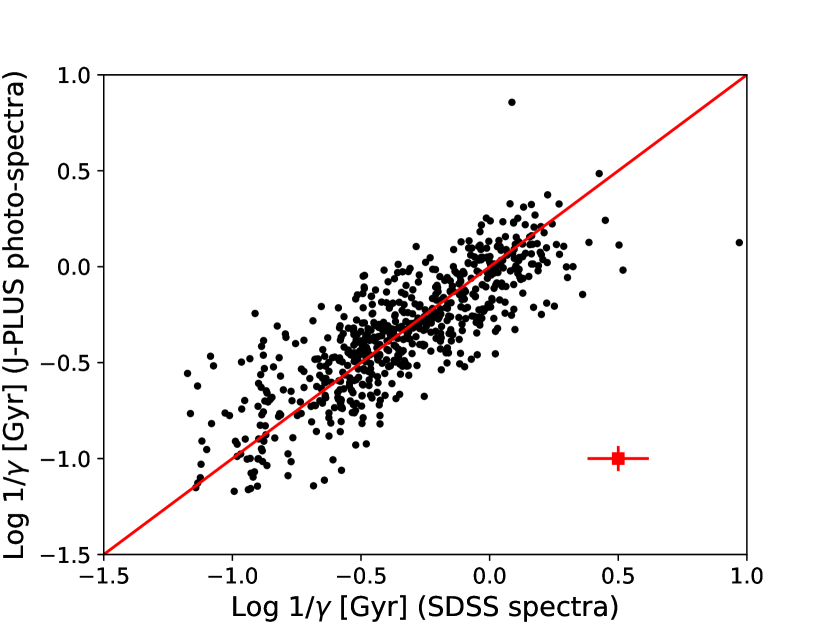
estimates. The spearman correlation and the root mean squared error (RMSE) are, respectively, 0.84 and 0.2, indicating a good correlation between the variables.
3 Star formation quenching time-scales in nearby green valley disc galaxies and constraints with bars
By cross-matching the green valley galaxies selected from Fig. 1 with J-PLUS Data Release 1555www.j-plus.es/datareleases/data_release_dr1 (DR1) and the morphological catalog from Domínguez Sánchez et al. (2018), we identify which galaxies in our sample were observed by J-PLUS and characterized their probability of hosting a bar. In the following, we describe Domínguez Sánchez et al. (2018) catalog and our results, associating quenching time-scales of green valley disc galaxies with the probability of a galaxy hosting a bar (hereafter bar probability).
3.1 Morphological catalog
Domínguez Sánchez et al. (2018) catalog classifies morphologically 670,000 galaxies from SDSS galaxy images. The morphological classification procedure was based on using the Convolutional Neural Networks (CNNs) deep learning algorithms. This methodology is able to automatically learn the main characteristics from a training input data. To train the CNN models, Domínguez Sánchez et al. (2018) used the Galaxy Zoo 2 (GZ2, Willett et al., 2013) and Nair & Abraham (2010) catalogs. GZ2 is a citizen science project that utilized non-professional volunteers to classify thousands of galaxies from SDSS galaxy images. The GZ2 final catalog contains galaxies with m and from SDSS DR7. The catalog from Nair & Abraham (2010) comprises visually classified galaxies from SDSS DR4 within a redshift range of . The performance of the CNN models were tested using two independent catalogs: the catalog from Huertas-Company et al. (2011), which classifies SDSS galaxies by assigning to each galaxy a probability of belonging to one of four morphological classes (E, S0, Sab and Scd); and Cheng et al. (2011) catalog, which contains a combination of visual and automatic morphological classifications of 984 red passive galaxies. We refer the reader to Domínguez Sánchez et al. (2018) for more details about their morphological catalog.
For each galaxy, Domínguez Sánchez et al. (2018) assign 9 different feature probabilities: disc probability (P), edge-on probability (P), bar signature probability through GZ2 training sample (P), bar signature probability through N10 training sample (P), merger probability (P), bulge prominence probability (P), cigar-shaped probability (P), T-Type classification (connected with Hubble sequence, T-type) and S0 probability (P). In this work we choose to characterize bar probability P rather than P. This is because the Galaxy Zoo catalog provides many more galaxies to calibrate the CNN models and, therefore, we understand that P is more reliable than P.
3.2 Results
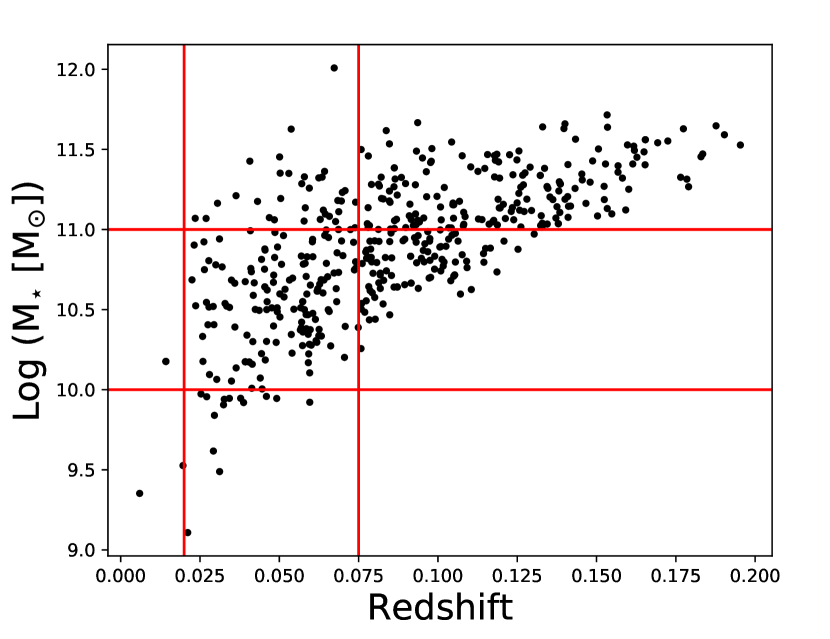
From our cross-matched catalog we pick those with P and P. With these conditions we aim at selecting predominantly disc galaxies that do not have a very close companion. We also constrain our sample in terms of stellar mass by choosing those within a mass range of . Our sample is complete at , as shown in Fig. 9. Martin et al. (2017) discussed that the most massive green valley galaxies ( M⊙) are probably red sequence galaxies that live at the centre of galaxy groups and clusters; these occasionally capture gas-richer satellites galaxies and consequently increase temporarily their star formation rate. As we are interested in galaxies that are only quenching their own star formation we chose to exclude these very massive green valley galaxies. Fig. 10 shows the star formation quenching time-scales of green valley galaxies as a function of bar probability. For low bar probability the quenching time-scales are spread from low to high values. However, green valley galaxies with higher bar probability (P) tend to have lower quenching time-scales. We applied the KolmogorovSmirnov test to the distribution of quenching time-scales of green valley galaxies with P (very likely unbarred) and those of P (very likely barred) to check if these two sub-samples are significantly different. The resulting p-value of 0.006 strongly points against the null hypothesis, i.e., that they are drawn from the same population, showing that the distribution of quenching time-scales of green valley galaxies with low bar probability is indeed statistically different from those of green valley galaxies with high bar probability. We discuss the implications of our findings in the next Section.
.
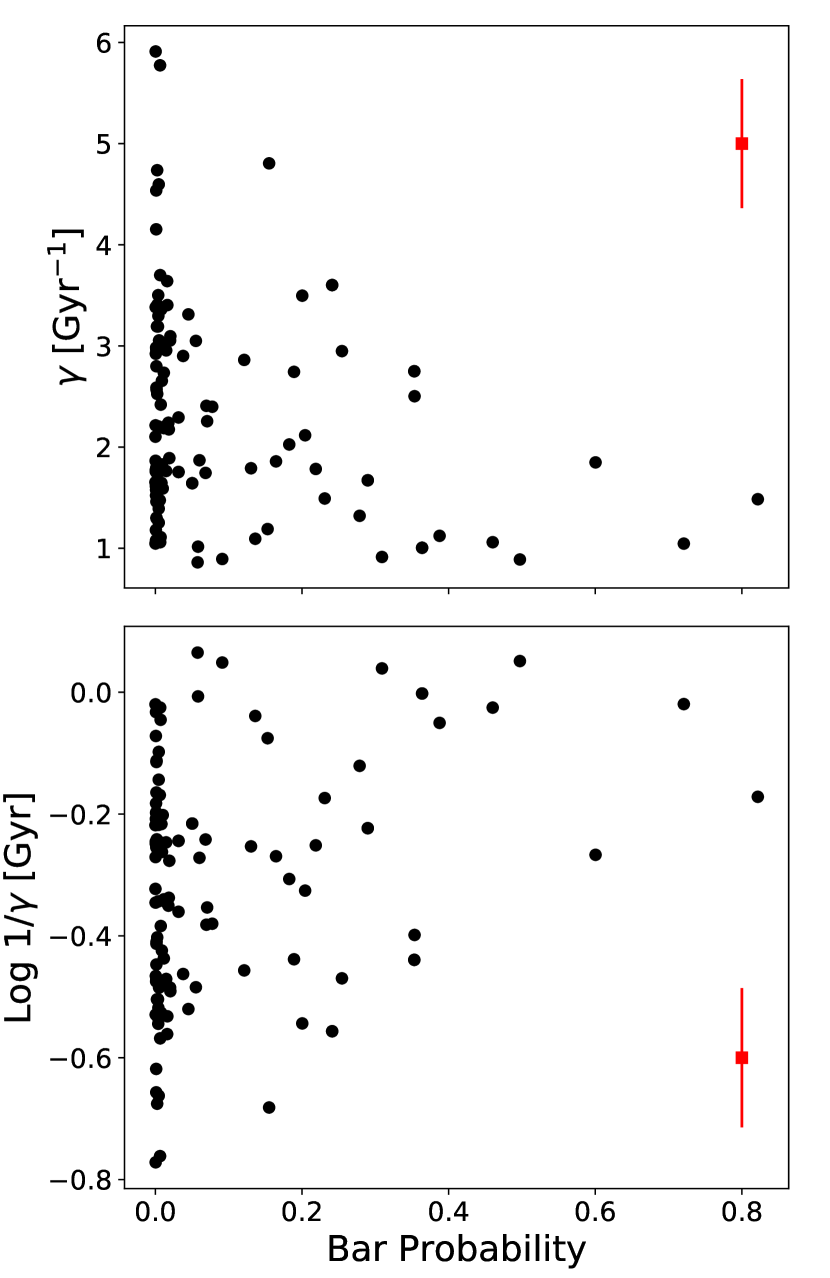
. The red squares represent the average uncertainty in our sample.
4 Discussions and conclusions
Figure 8 shows that our methodology with J-PLUS filters (F0395, F0410 and gSDSS) can recover quenching time-scales in green valley galaxies with a good precision in comparison with the methodology from Martin et al. (2007), which uses spectral indices from galaxy spectra. The quenching time-scales from our methodology converge with those from Martin et al. (2007) because the F0395, F04010 and gSDSS J-PLUS filters cover approximately the same region rest-frame wavelength used to define the Dn(4000) and Hδ,A spectral indices in galaxy spectra. This allows us to use the J-PLUS filters instead of galaxy spectra (Figs. 5 and 6) to drive quenching time-scales.
Although both approaches are in agreement, Fig. 8 shows a noticeable dispersion. Nevertheless, our method with J-PLUS filters recovers the quenching time-scales with a similar accuracy as that of Martin et al. (2007), in spite of their usage of galaxy spectra. Therefore, Fig. 8 demonstrates the potential of J-PLUS photometry to determine quenching time-scales for green valley galaxies in the local Universe. Furthermore, we expect much better constraints with the 56-narrow-band filter system of the upcoming J-PAS survey.
We measure quenching time-scales for a set of nearby green valley galaxies and correlate these time-scales with the probability of hosting a bar (Fig. 10). The results indicate a tendency for green valley galaxies to have longer quenching time-scales for a higher bar probability.
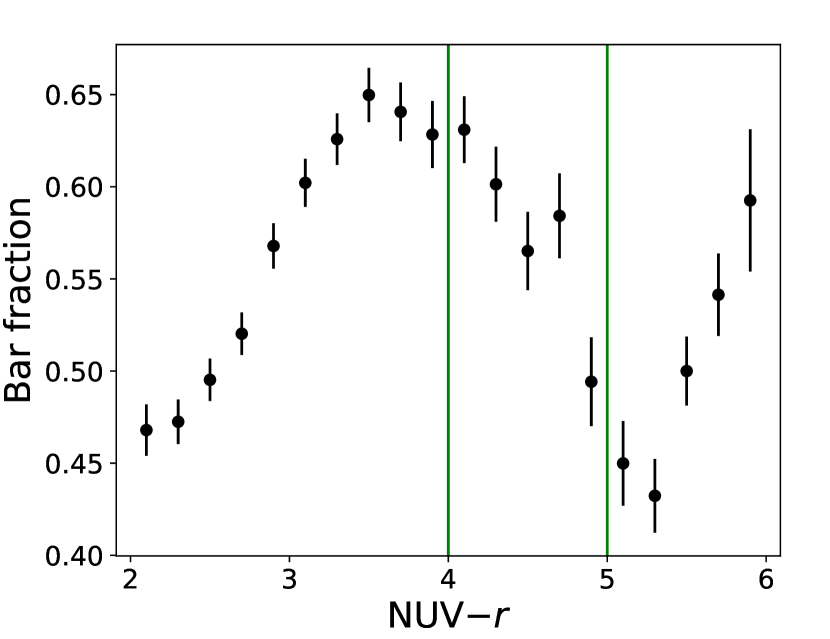
In order to better understand the impact of bars in quenching star formation in disc galaxies we also investigate the bar fraction evolution with NUV colour (Fig. 11). We find that the bar fraction behaviour seems to be have an interesting trend with galaxy colour. We note that both within the blue cloud and the red sequence the bar fraction increases towards redder colours by roughly 20%. However, this increase is not continuous across the green valley. Within the green valley we note a significant drop in the bar fraction, resulting in a bar fraction dip at NUV. This general trend we observe in our sample is in agreement with previous works (e.g., Cheung et al., 2013; Kelvin et al., 2018).
4.1 Bar formation and evolution
N-body simulations show that bars are naturally formed within a few Gyrs or so in dynamically cold discs, although a dark-matter dominated center and gas-richness may delay this process somewhat (Athanassoula & Sellwood, 1986; Athanassoula, 2002; Athanassoula et al., 2013; Aumer & Binney, 2017). Sheth et al. (2008) found that bar fraction decreases with increasing redshift, consistent with galaxies having a tendency of being more gas rich at higher redshifts (Genzel et al., 2010; Tacconi et al., 2010). As galaxies become more dynamically-cold with time, the conditions become more favourable to the formation of a bar. This explains the high value of the local bar fraction in spiral galaxies (63%; e.g., de Vaucouleurs, 1963).
We consider our results from Fig. 11 in the light of this context. With gas richness dropping as we consider redder galaxies in the galaxy CMD, finding a lower bar fraction at the bluer end is reasonable. In fact, recent work by Kruk et al. (2018) shows that unbarred disc galaxies are bluer than barred ones. This is consistent with the increased bar fraction we observe in our sample for galaxies in the blue-cloud: galaxies with redder colours within the blue-cloud population appear to host bars more frequently. The increase in bar fraction that we observe towards redder red sequence galaxies may also be an extension of this logic. The dip in the bar fraction that appears to characterize the green valley represents an interruption to the otherwise global trend of increasing bar fraction with redder colours. The decrease in value of the bar fraction within the green valley suggests that processes that lead to the destruction of bars are at work.
Our results displayed in Fig. 11 suggest that bars can form, be destroyed and form again as galaxies cross the colour- magnitude diagram. These same bar-destroying processes must either also be able to quench star formation in galaxies or act in parallel to the processes responsible for quenching star formation. It is interesting to determine the processes responsible for the destruction and the resurgence of bars in disc galaxies.
Over the last couple of decades different studies have pointed to the potential recurrence of the bar phenomenon, where a bar may form, grow in strength, get destroyed (even self-destroy) and ultimately reform in a galaxy disc (Bournaud & Combes, 2002; Berentzen et al., 2004; Gadotti & de Souza, 2006). Hydrodynamical simulations have shown that the bar-induced increase in mass concentration in the central parts of barred galaxies can lead to bar self-destruction (Roberts et al., 1979; Norman et al., 1996; Sellwood & Moore, 1999; Athanassoula et al., 2005). It is worth noting that the amount of central mass concentrations required to effectively accomplish bar destruction are very large compared to observational constraints (Debattista & Sellwood, 2000; Shen & Sellwood, 2004; Debattista et al., 2006). Another way of destroying a bar is via tidal interactions with other galaxies (Lee et al., 2012), which may lead to the rapid quenching of star formation (Nogueira-Cavalcante et al., 2018). As galaxies become passive and gas-poor, the discs become susceptible again to develop a new stellar bar.
It is interesting to consider that the properties of bars in blue cloud barred galaxies have been shown to be different from those in the red sequence: bars in red discs tend to be longer and stronger whereas bars in star-forming discs are usually weaker and show an exponential light profile (Elmegreen & Elmegreen, 1985, 1989). This suggests that bars that persist through the galaxy transition from blue to red and through the green valley grow in size and strength. This suggests that, although a portion of the barred galaxies in the blue cloud goes through bar-destroying processes, another portion of the galaxy population has bars that persist through the green valley and continue to grow longer and stronger.
The combination of bar survival in some blue-cloud galaxies, together with the sequence of bar destruction and renewal in others would contribute to the increase in bar fraction within the red sequence galaxy population.
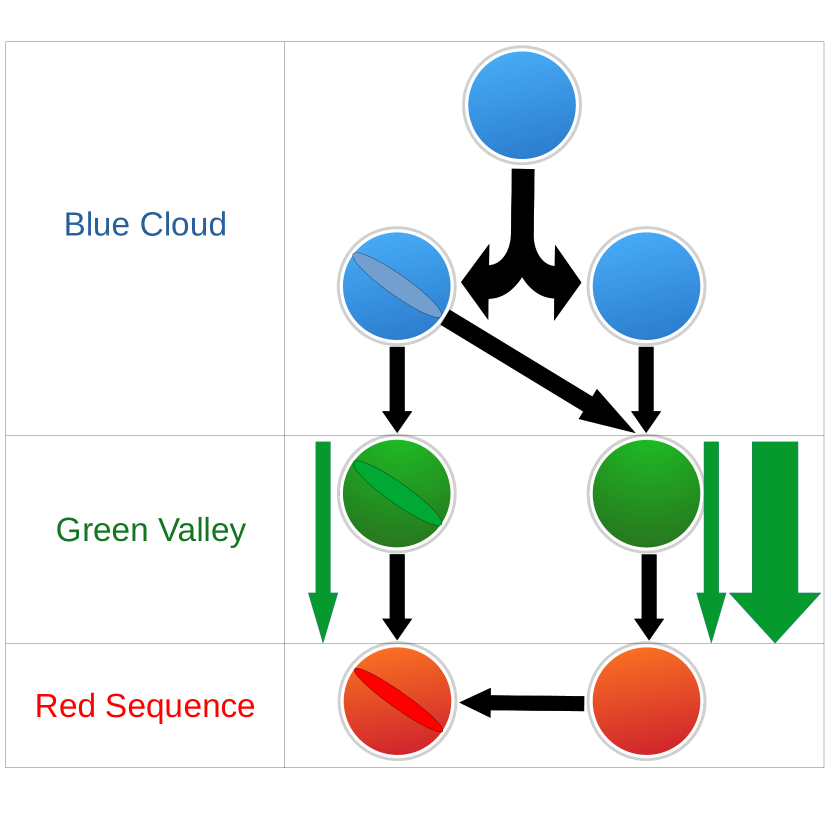
We suggest a possible scenario for the transition across the green valley for galaxies with intermediate mass discs in the local Universe (see schematic representation in Fig. 12). During the blue cloud phase a star forming galaxy may or may not develop a bar. When quenching processes start to act, barred galaxies may or may not lose their bars. As these galaxies transition through the green valley, the same star formation quenching processes (or other processes acting in parallel) may destroy their bars, driving the bar fraction down (Fig. 11). Galaxies whose bars do not persist through the star formation quenching phase, as well as galaxies that were unbarred within the blue cloud, they tend to transit through the green valley (and reach the red sequence) faster than barred green valley galaxies (Fig. 10). Finally, after barred and unbarred galaxies reach the red sequence, barred galaxies tend to retain their bars whereas in unbarred galaxies the conditions become favourable for the formation/resurgence of bars.
4.2 Bars and star formation quenching
Many previous works have associated bars with quenching star formation. Schawinski et al. (2014) discussed that, among disc galaxies, stellar bars can accelerate star formation quenching. Masters et al. (2010) associated quenching with bars in order to explain the high bar fraction among passive disc galaxies. Gavazzi et al. (2015) noted that, for nearby disc galaxies, the bar fraction increases with stellar mass. As passive galaxies are more common among massive galaxies, these authors suggested that bars may play an important role in quenching star formation. Haywood et al. (2016) claimed that, in the case of our Galaxy, the stellar bar can stabilize the disc, preventing new star formation. Simulations also suggest that bars may efficiently quench star formation, decreasing by a factor of 1 Gyr the star formation rate time-scale (Khoperskov et al., 2018).
Although these works suggest that bars induce a faster star formation quenching, our results displayed in Fig. 10 show that green valley disc galaxies with high bar probability tend to quench star formation slowly, which in agreement with Coelho & Gadotti (2011), who found that the stellar population in bulges of barred galaxies shows an excess of populations younger than Gyr, when compared to bulges in unbarred galaxies, for the same galaxy masses. Fig. 10 also shows that green valley disc galaxies with low bar probability can also quench star formation very slowly and we find that many disc galaxies with low bar probability have quenching time-scales greater than those in green valley galaxies with high bar probability. On the other hand, our results suggest that in galaxies with high bar probability the processes which quickly quench star formation are either absent or sustained by the gravitational potential of the host galaxy, which is sufficient to preserve the bar and, simultaneously, the star formation against these processes. Nogueira-Cavalcante et al. (2018) found a similar result for green valley barred galaxies at intermediate redshifts (), with barred galaxies, displaying the longest star formation quenching time-scales.
The increase of the bar fraction in the red sequence region (NUV in Fig. 11) reflects the greater ease that the red discs have to form stellar bars. Therefore, bars are probably not associated with accelerated star formation quenching, contrary to simulations, which suggest that bars can increase gas consumption in isolated discs in comparison with unbarred ones (Khoperskov et al., 2018). However, real galaxies are complex structures where several quenching mechanisms (where the majority of them can be bar-destroyers) happen simultaneously. Inevitably, if a disc galaxy remains isolated long enough and keeps the disc dynamically cool, a bar will be formed. Therefore, the barred systems can be interpreted as those where violent physical processes, that quench star formation rapidly, are absent.
4.3 Bar colours impact on the quenching time-scales estimations
In this work we determine the parameter through the NUV, F0395gSDSS and F0410gSDSS colours. A reasonable explanation for the systematic low values (high quenching time-scales) for green valley barred galaxies is that F0395-gSDSS and F0410-gSDSS colours in these galaxies are redder for a specific NUV- value, in comparison with green valley unbarred galaxies. These reddening F0395-gSDSS and F0410-gSDSS colours could be caused either by dust extinction or by older stellar population in the bar region in barred galaxies.
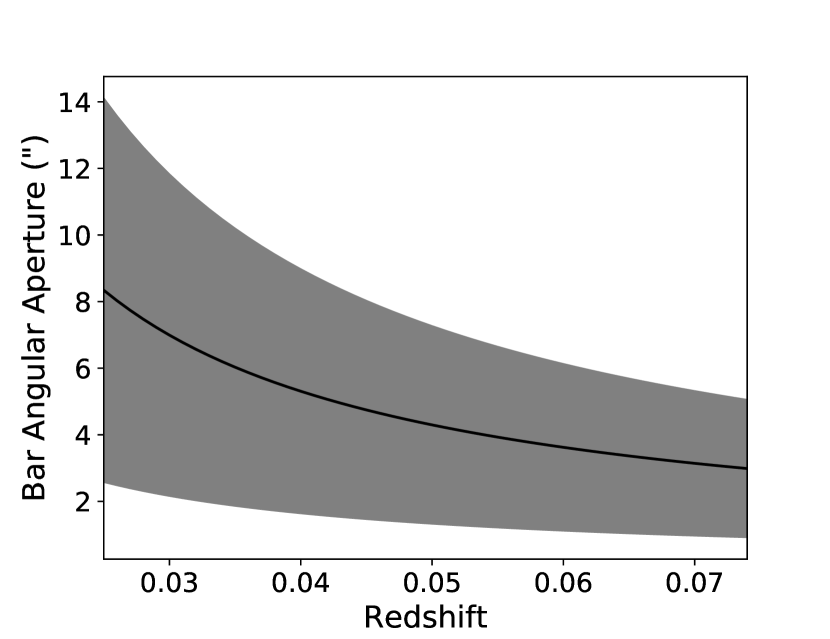
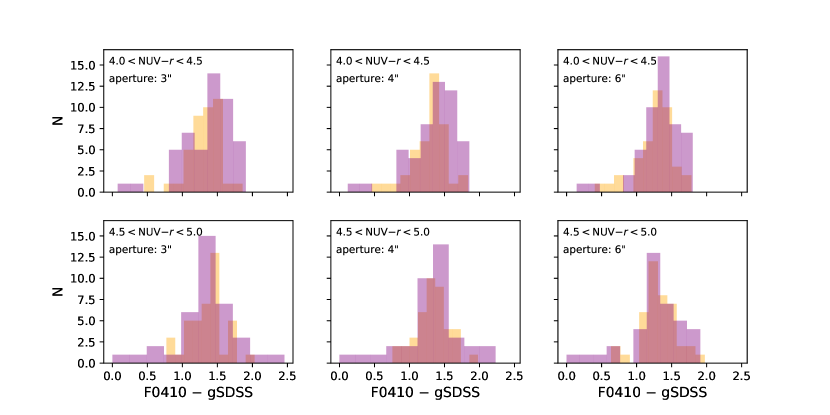
To test the dust extinction hypothesis, we analyze the F0395-gSDSS and F0410-gSDSS colours in different angular apertures, in order to compare the central regions (bar region) of unbarred and barred green valley galaxies. The size of bars in a typical disc galaxy in the local Universe is kpcs (e.g., Menéndez-Delmestre et al., 2007). Fig. 13 shows the necessary angular aperture as a function of redshift to cover the bar region of a typical barred galaxy in the local Universe. The aperture photometries avaiable in J-PLUS DR1 are 0.8”, 1.0”, 1.2”, 2.0”, 3.0”, 4.0” e 6.0”. From Fig. 13 we choose the 3.0”, 4.0” e 6.0” angular apertures, which cover almost entirely the bar region of typical local barred galaxies over the redshift range of our galaxy sample.
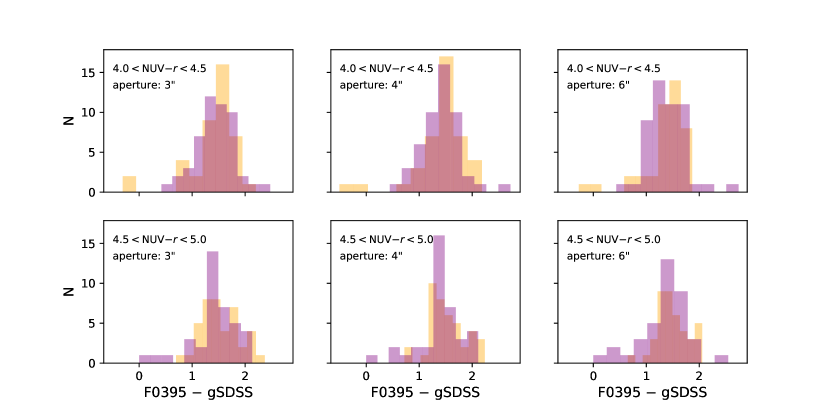
Figures 14 and 15 show the distribution of F0395gSDSS e F0410gSDSS colours, respectively, for barred and unbarred green valley galaxies of our sample. From these Figs. we do not find colour excess for the green valley barred galaxies in the regions delimited by the angular apertures. Therefore, Figs. 14 and 15 suggest that the low values (Fig. 10) for green valley barred galaxies are due a more a more continuous star formation, that simultaneously affects the NUV, F0395gSDSS e F0410gSDSS colours, and not due dust extinction in the bar region.
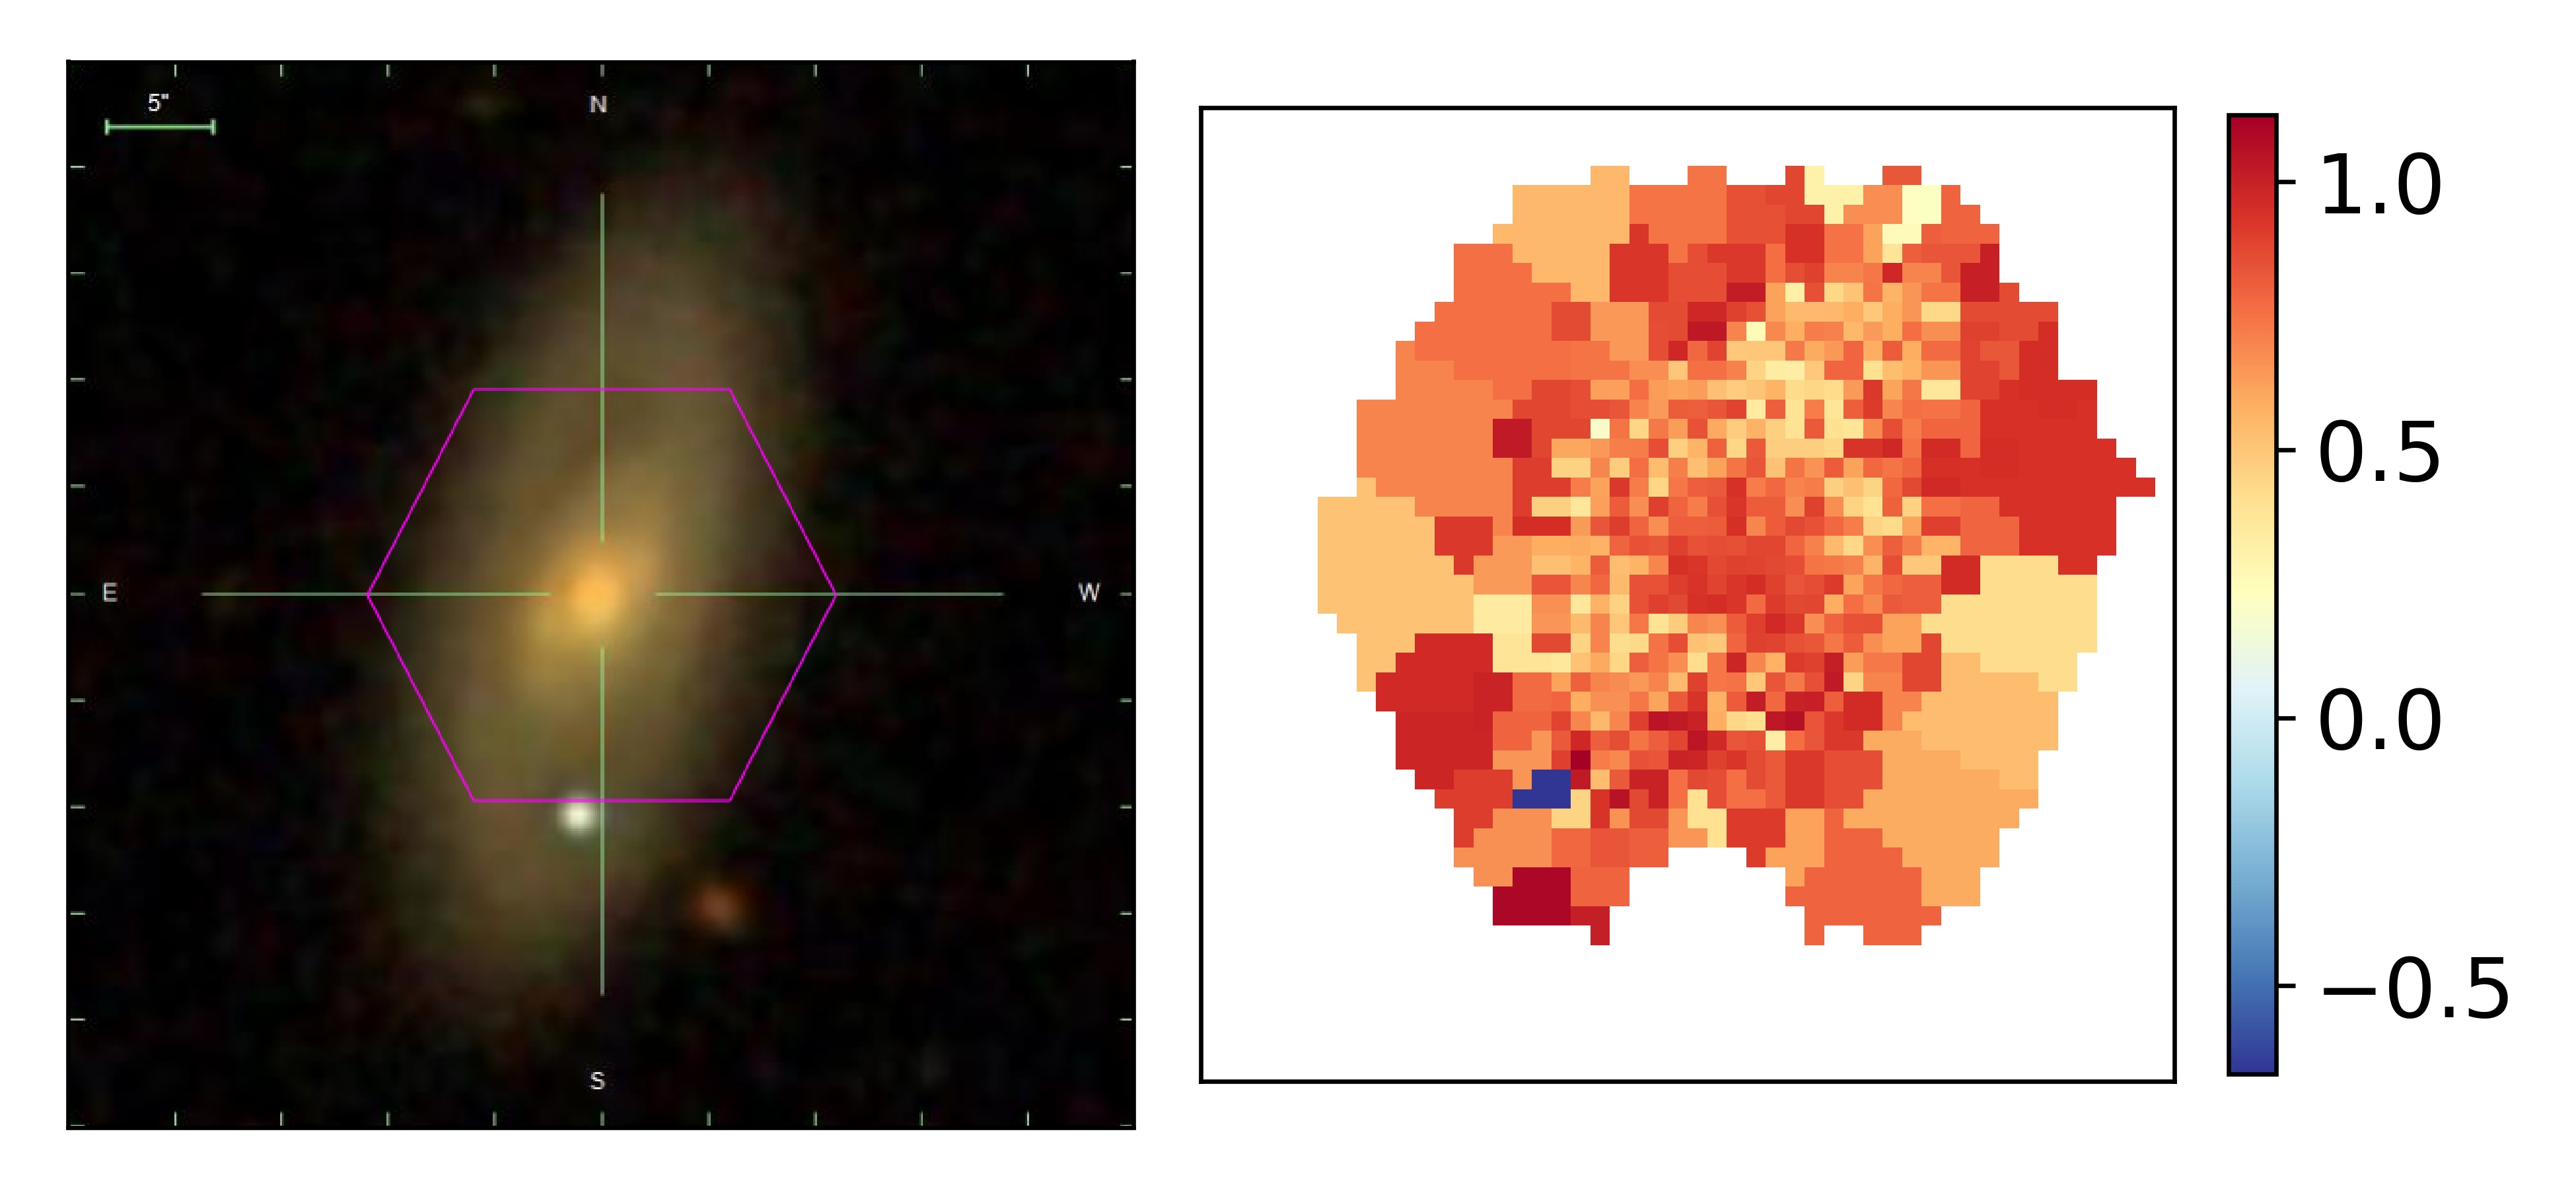
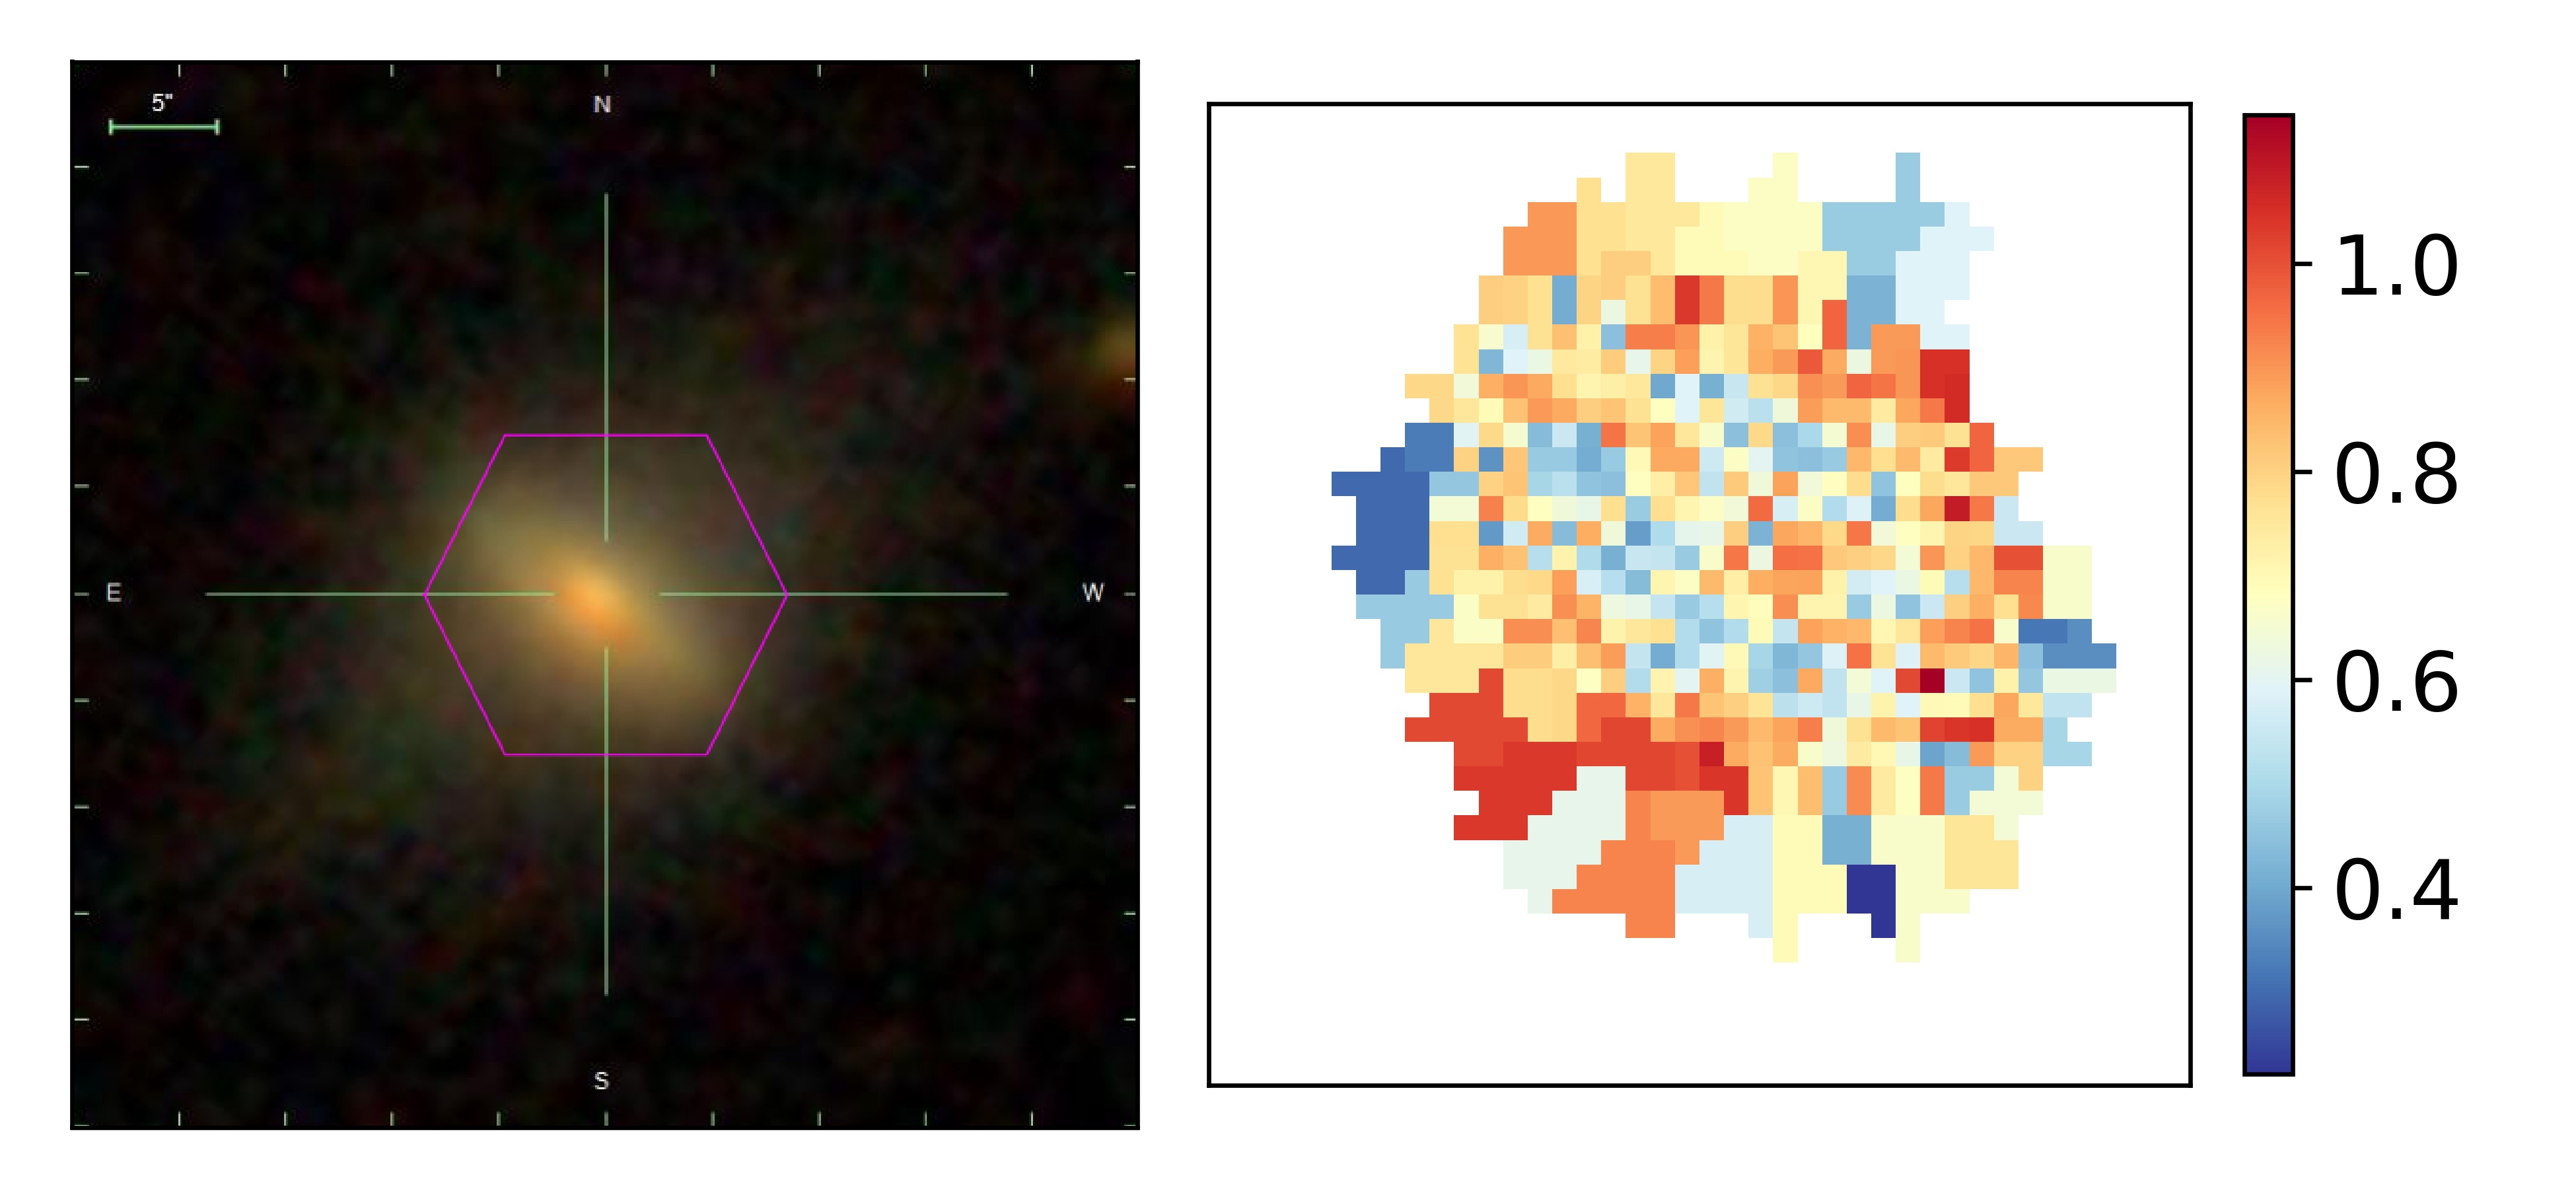
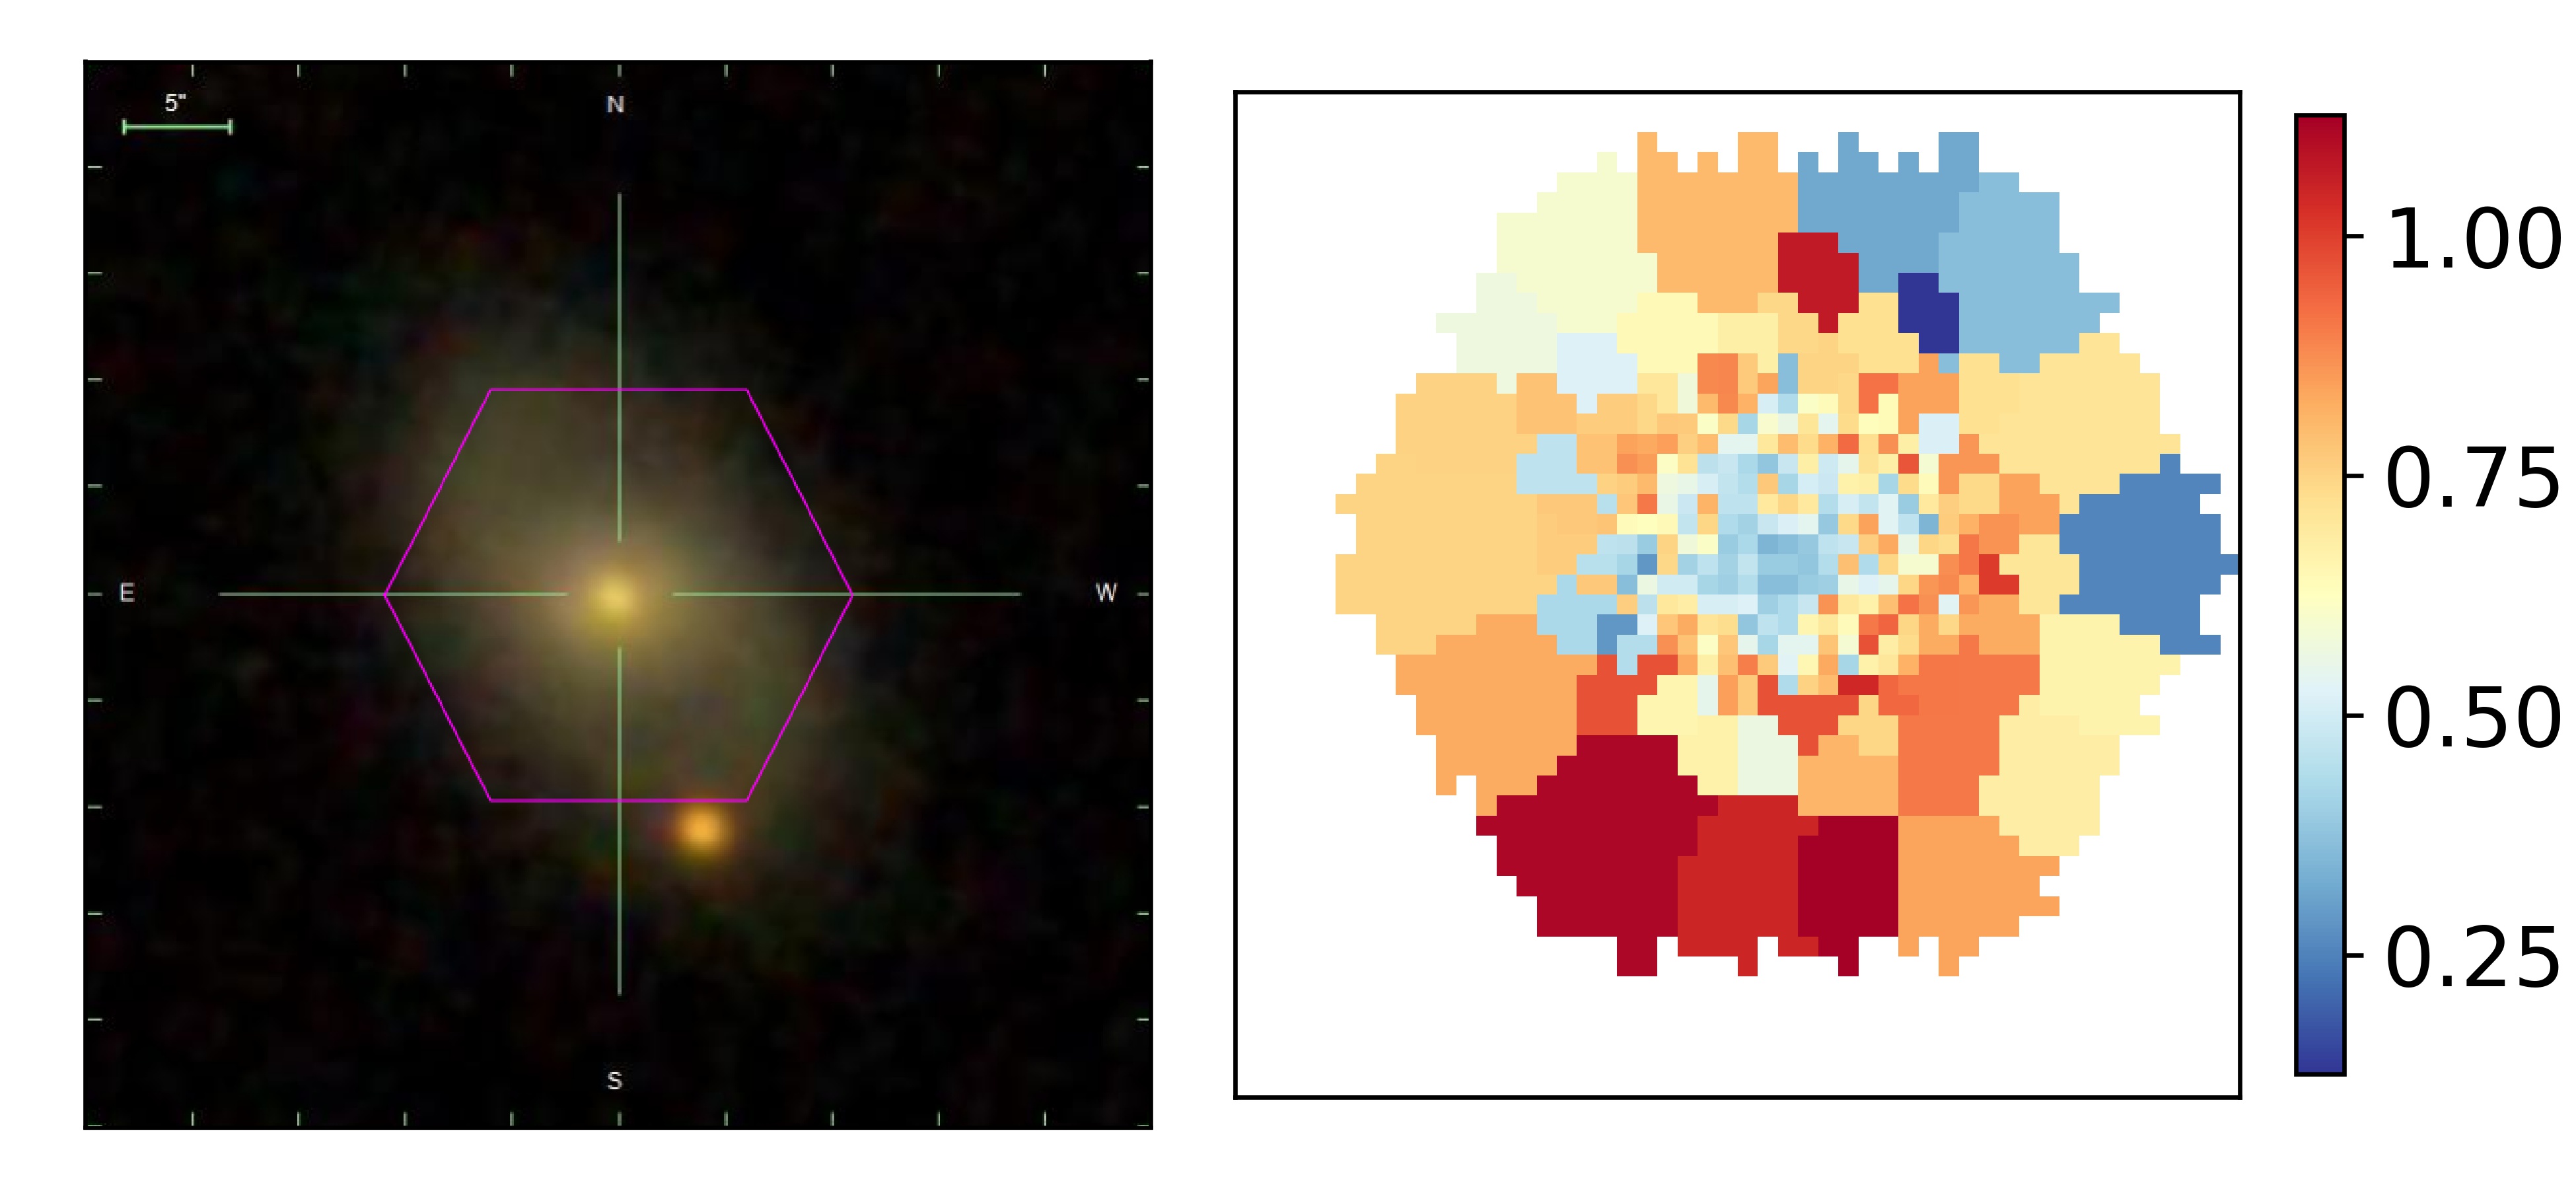
To test for a possible bias that could appear from a tentative older stellar population in the bar region we compare qualitatively the luminosity-weighted age of stellar populations from the bar region and other parts of the galaxy using MaNGA data of a sample of face-on barred green valley galaxies. The MaNGA survey (Bundy et al., 2015; Yan et al., 2016) is a SDSS-IV (Blanton et al., 2017) project that aims to obtain spatially resolved spectroscopy for 10000 local galaxies (), with a spectral resolution of , from 4000 to 8500, using the BOSS spectrograph (Smee et al., 2013; Drory et al., 2015) on the Sloan Telescope (Gunn et al., 2006). MaNGA galaxies come from the NASA Sloan Atlas catalogue (NSA, Blanton et al., 2005), which are representative of all the galaxy populations (blue cloud, green valley and red sequence).
We obtain luminosity-weighted ages from the public MaNGA FIREFLY catalog (Goddard et al., 2017). FIREFLY (Fitting IteRativEly For Likelihood analYsis, Wilkinson et al., 2015) is a spectral fitting code which can obtain several stellar population properties from galaxy spectra, such as stellar ages and metallicities. For the spectral fitting FIREFLY assumes: foreground Milky Way reddening dust maps by Schlegel et al. (1998) and extinction curve by Fitzpatrick (1999); intrinsic reddening by dust in each galaxy by Wilkinson et al. (2015); and stellar population models by Maraston & Strömbäck (2011), with MILES stellar library (Sánchez-Blázquez et al., 2006) and Kroupa initial mass function (Kroupa, 2001).
FIREFLY code both estimates luminosity-weighted and mass-weighted stellar ages. The former is sensitive to recent star formation whereas the latter is affected by the cumulative galaxy evolution. We decided to use luminosity-weighted age because recent star formation changes directly galaxy colours and therefore can influence the estimations of quenching time-scales.
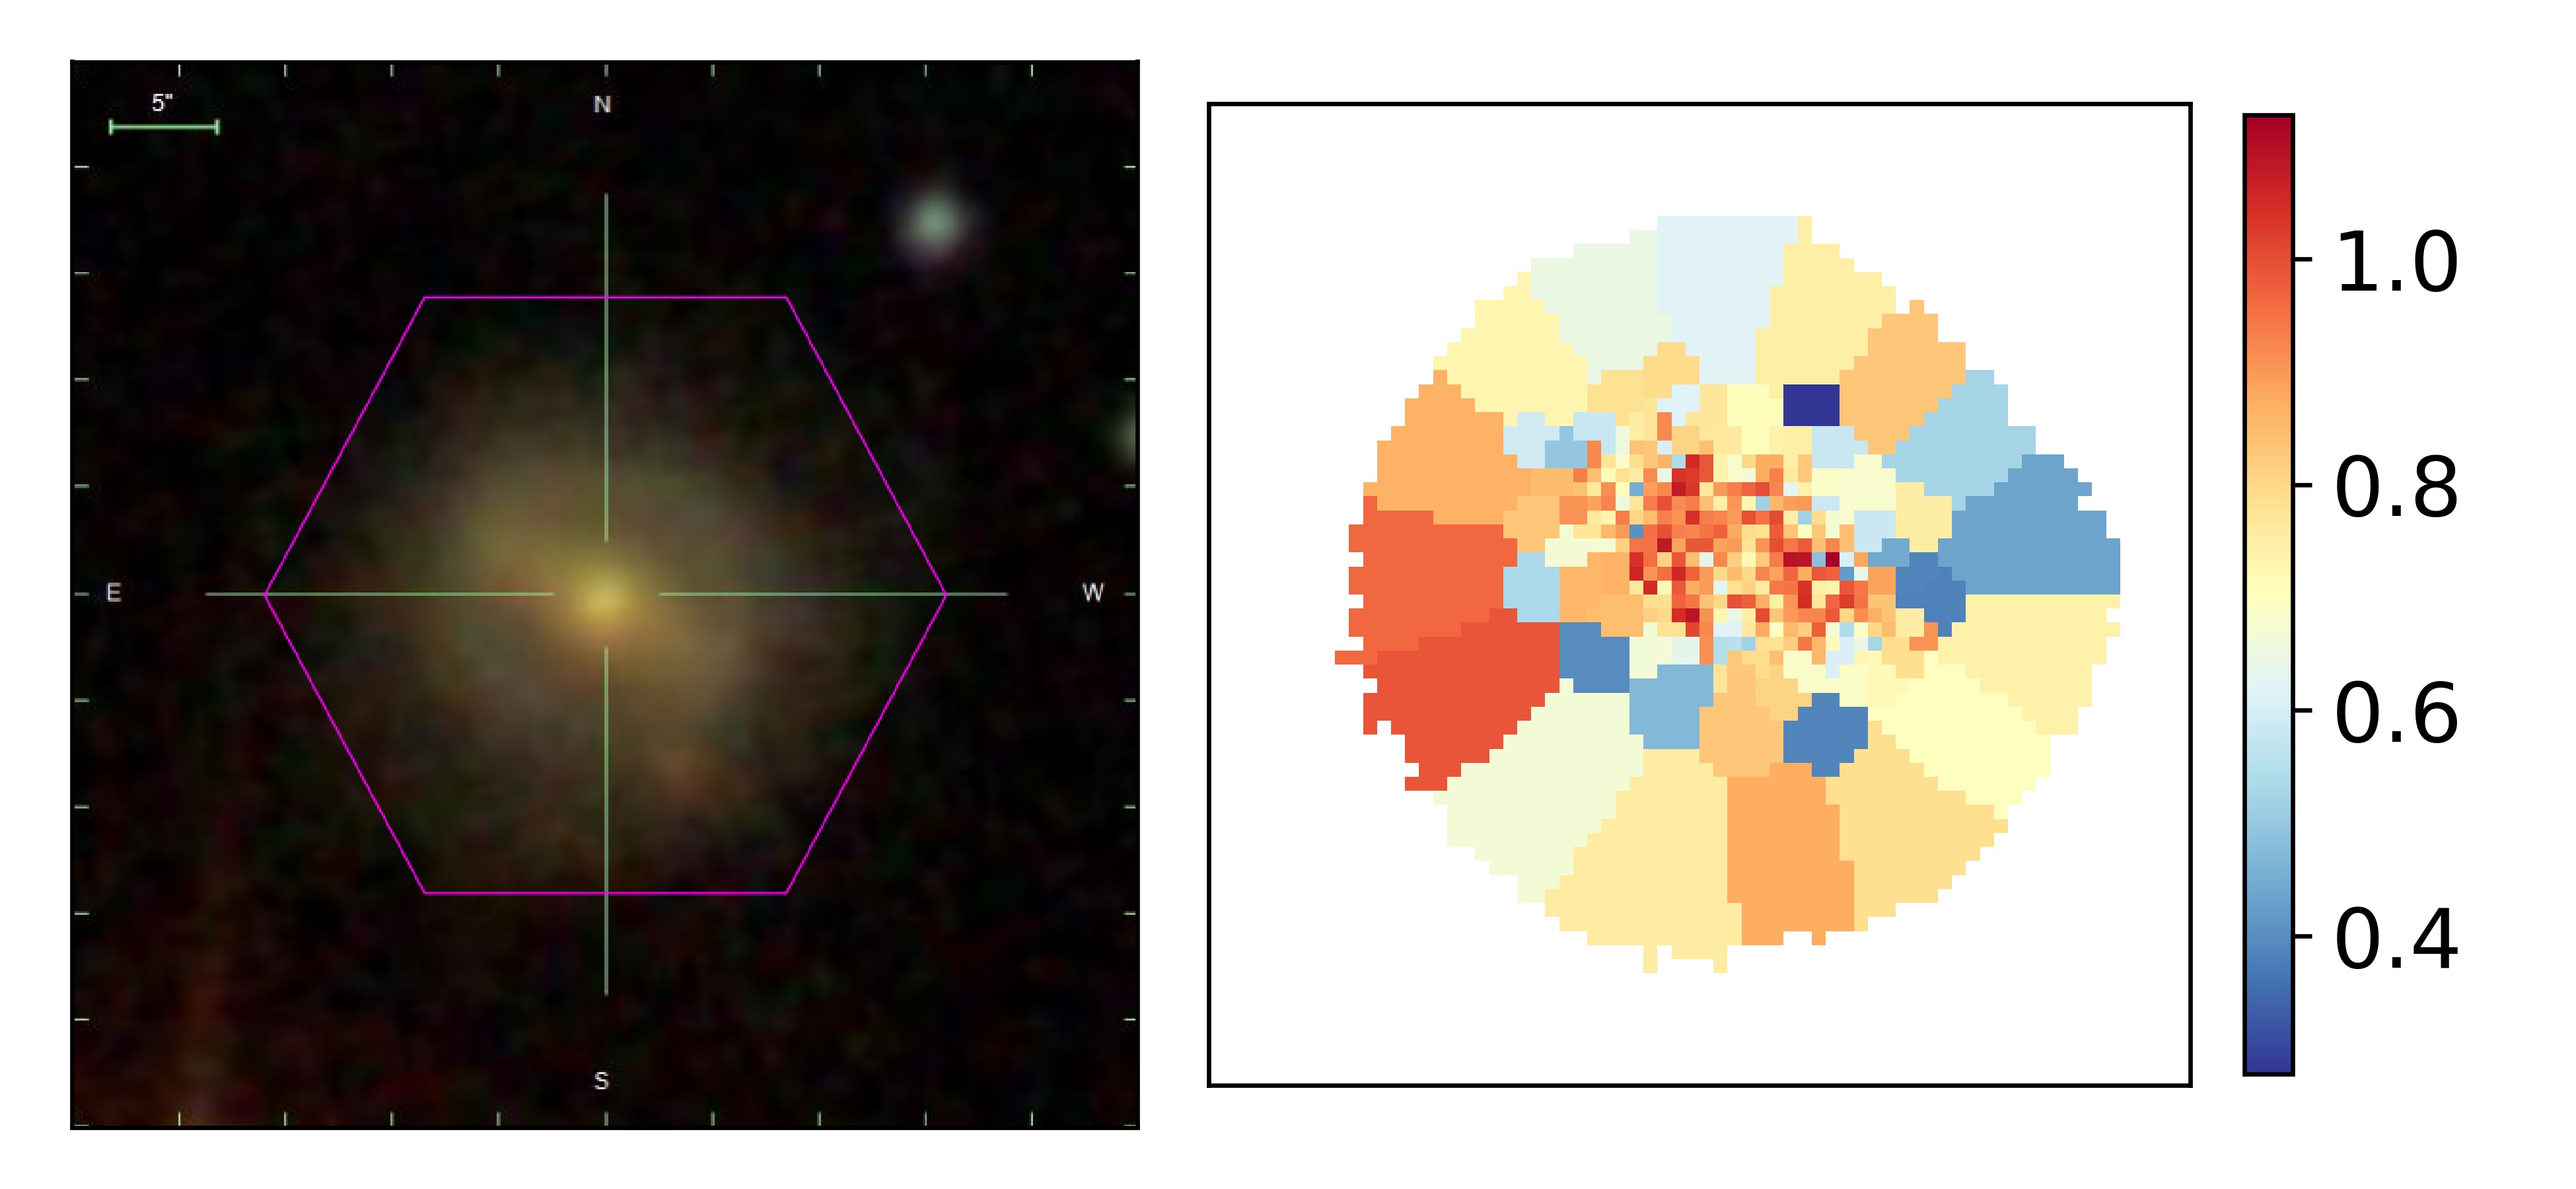
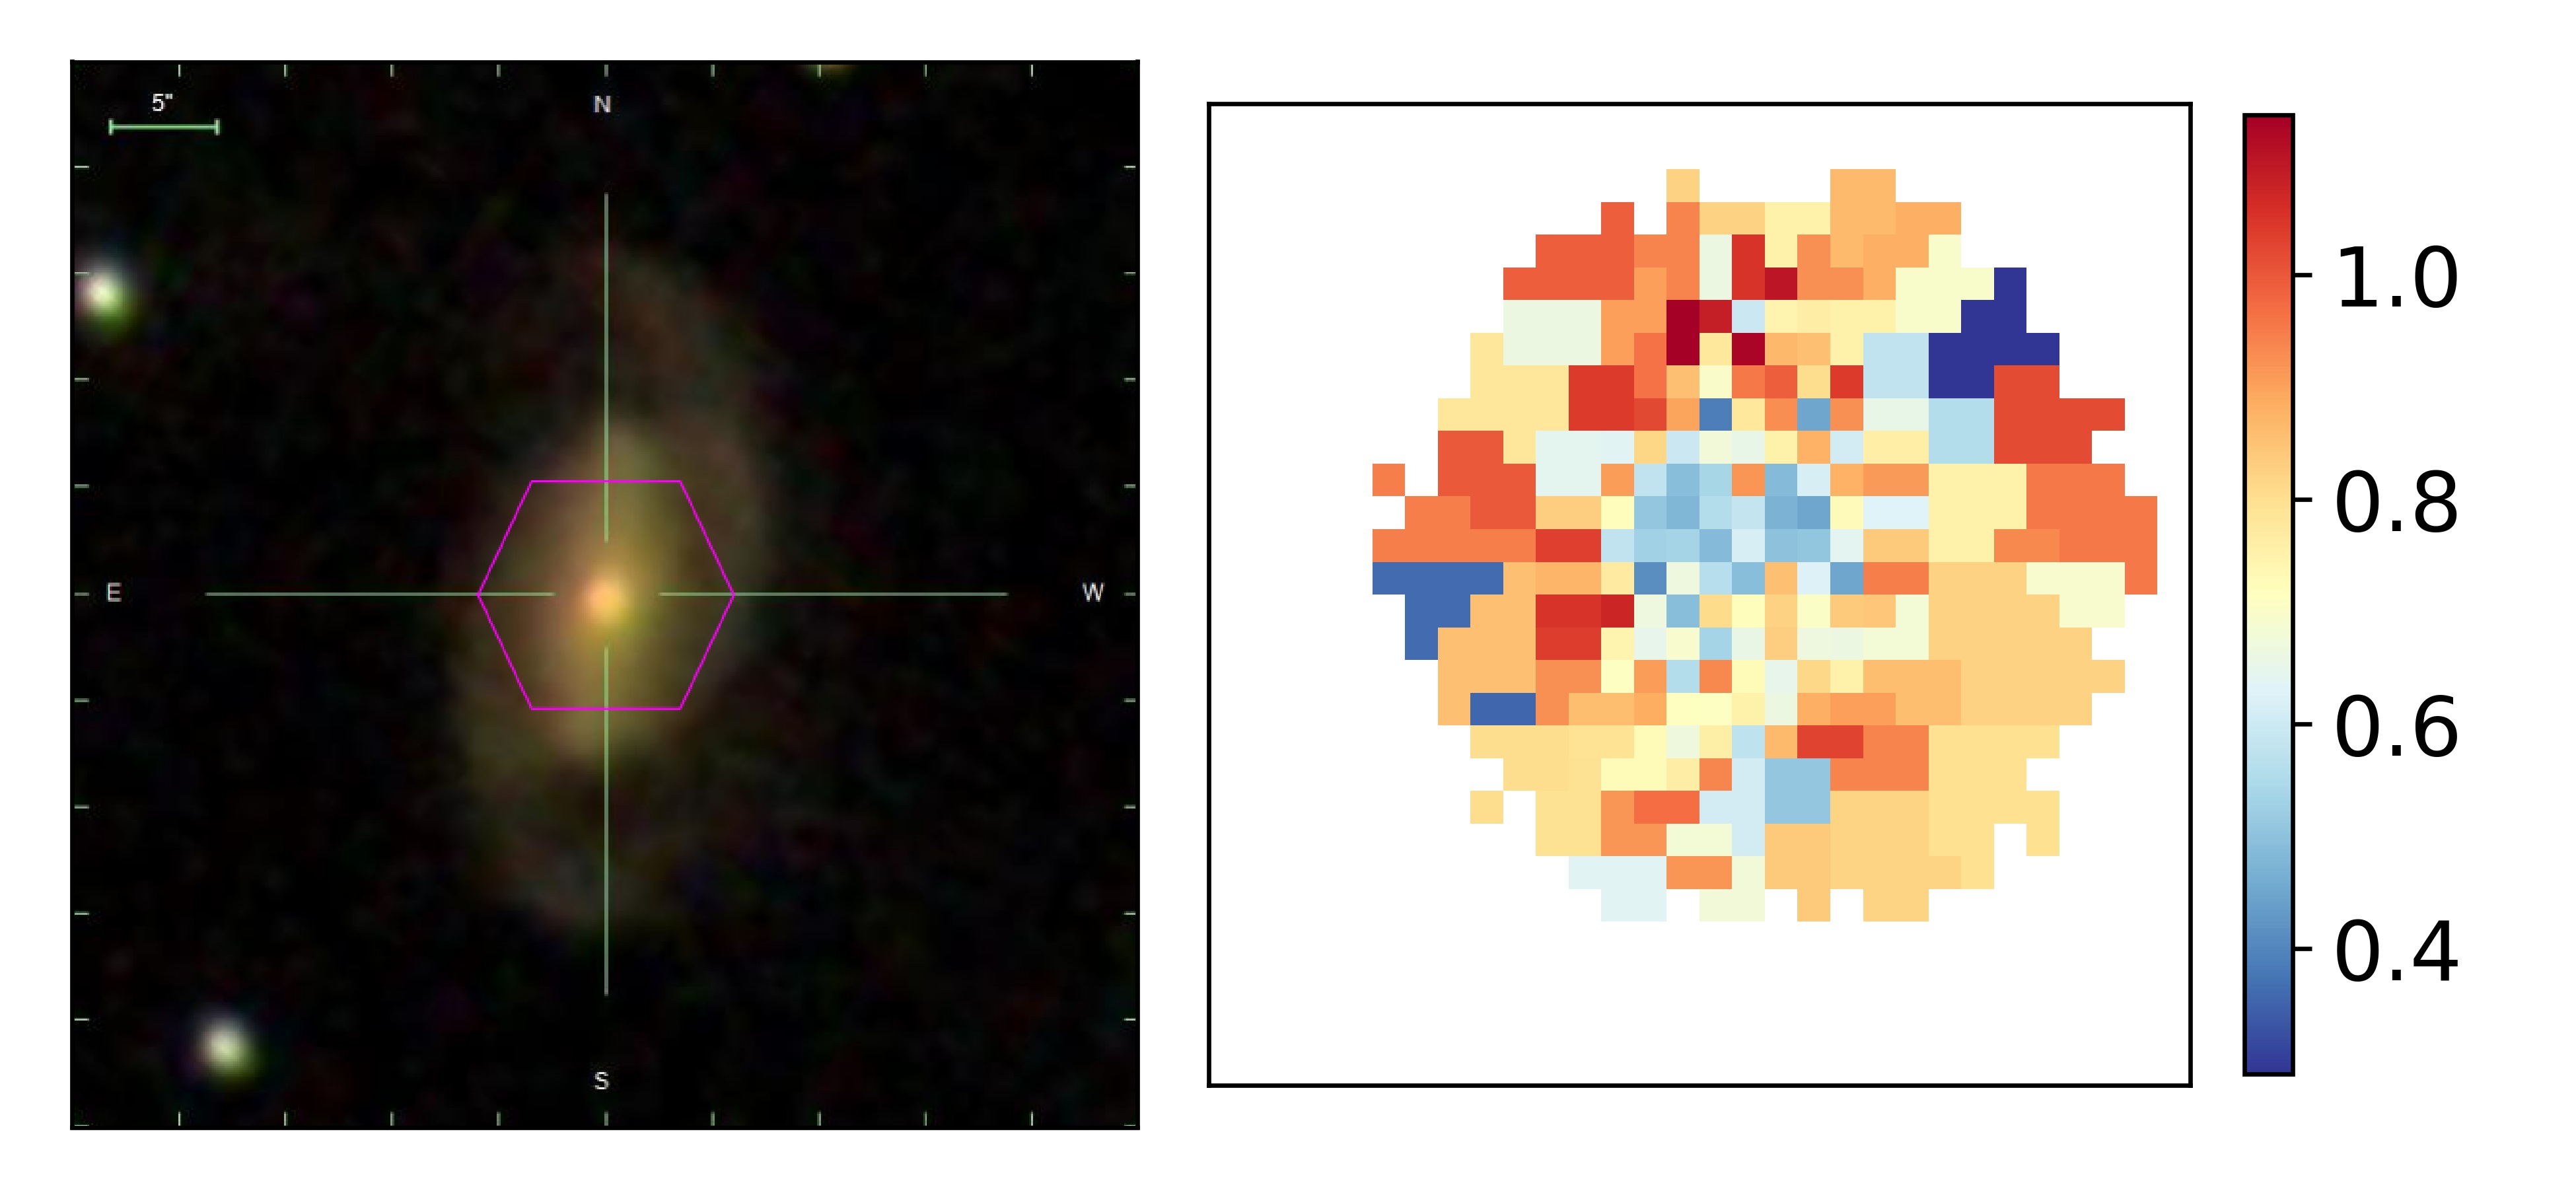
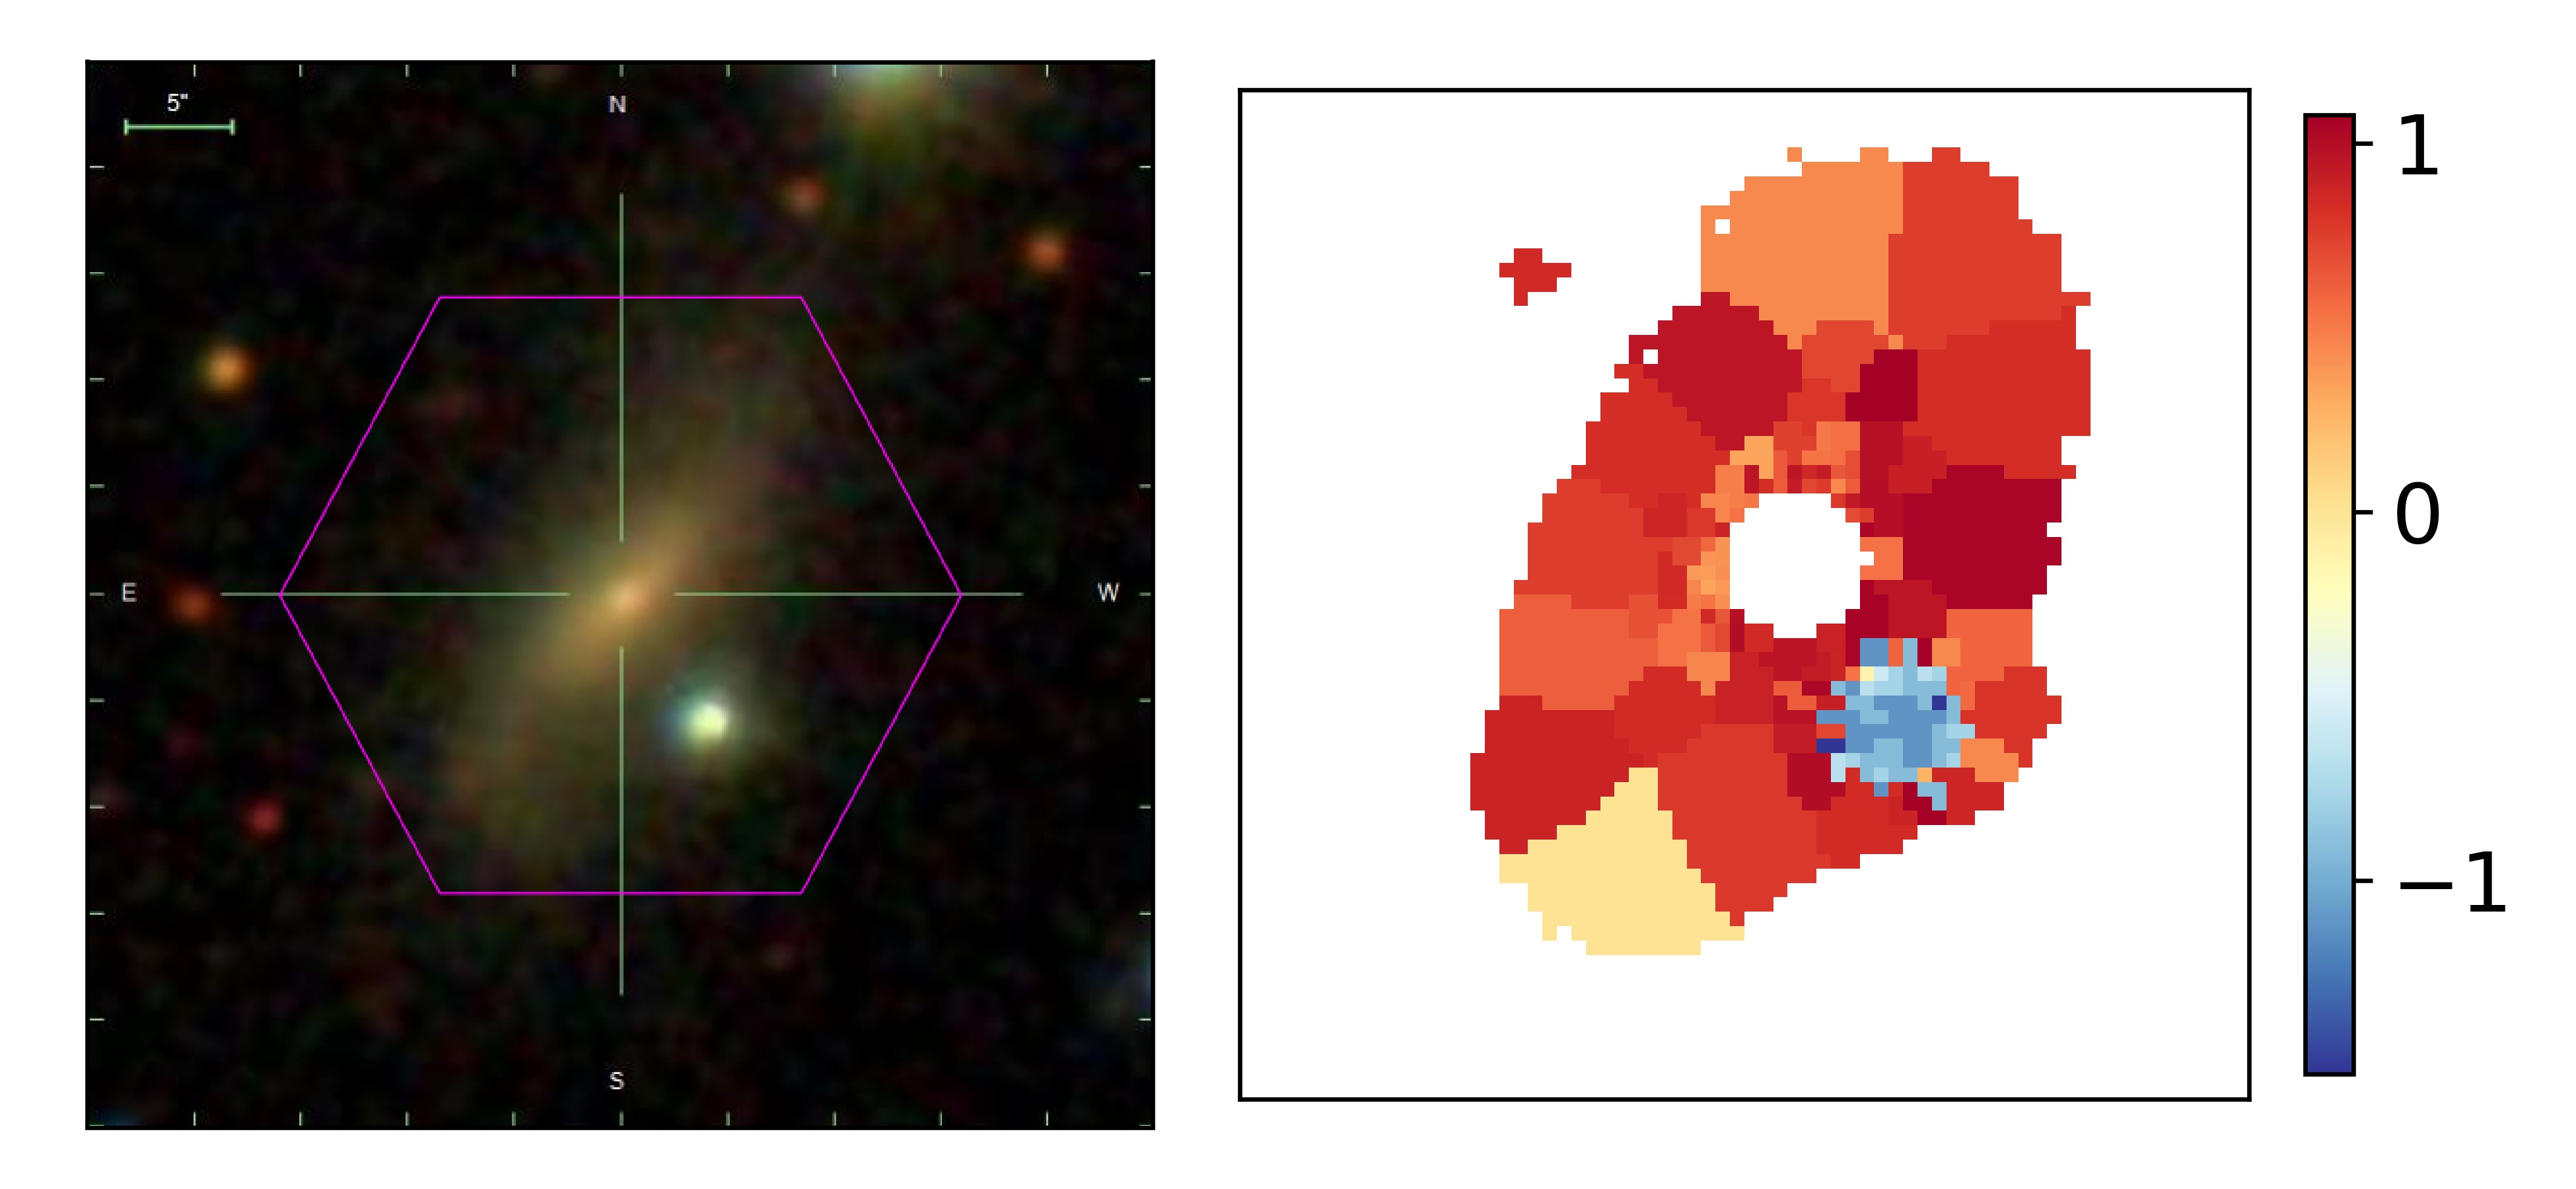
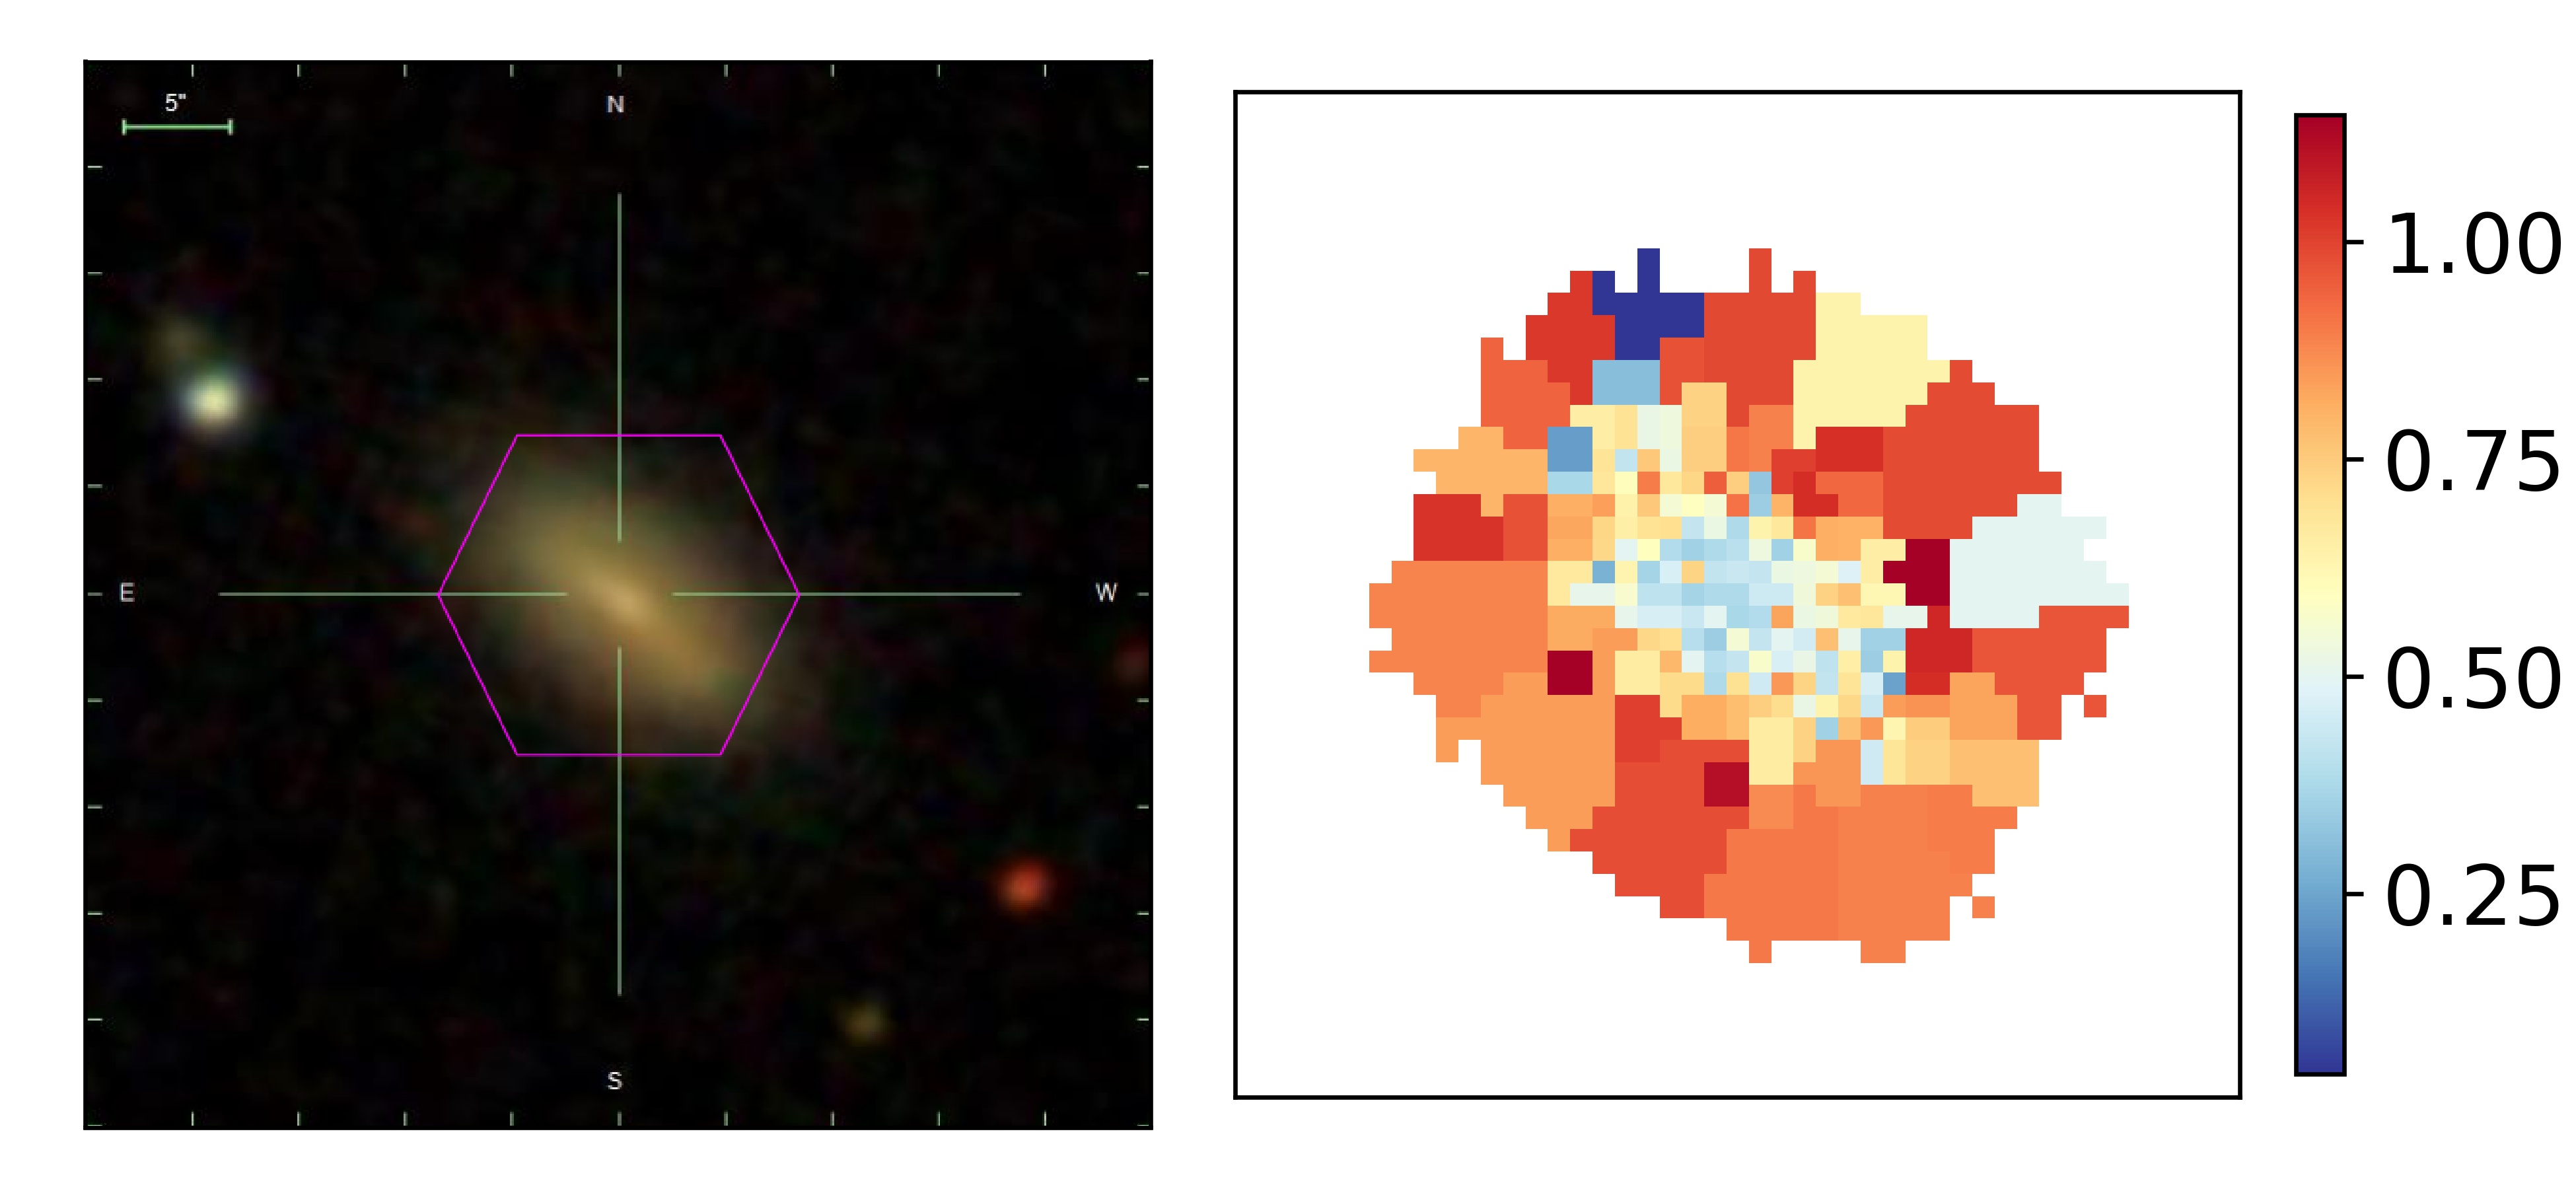
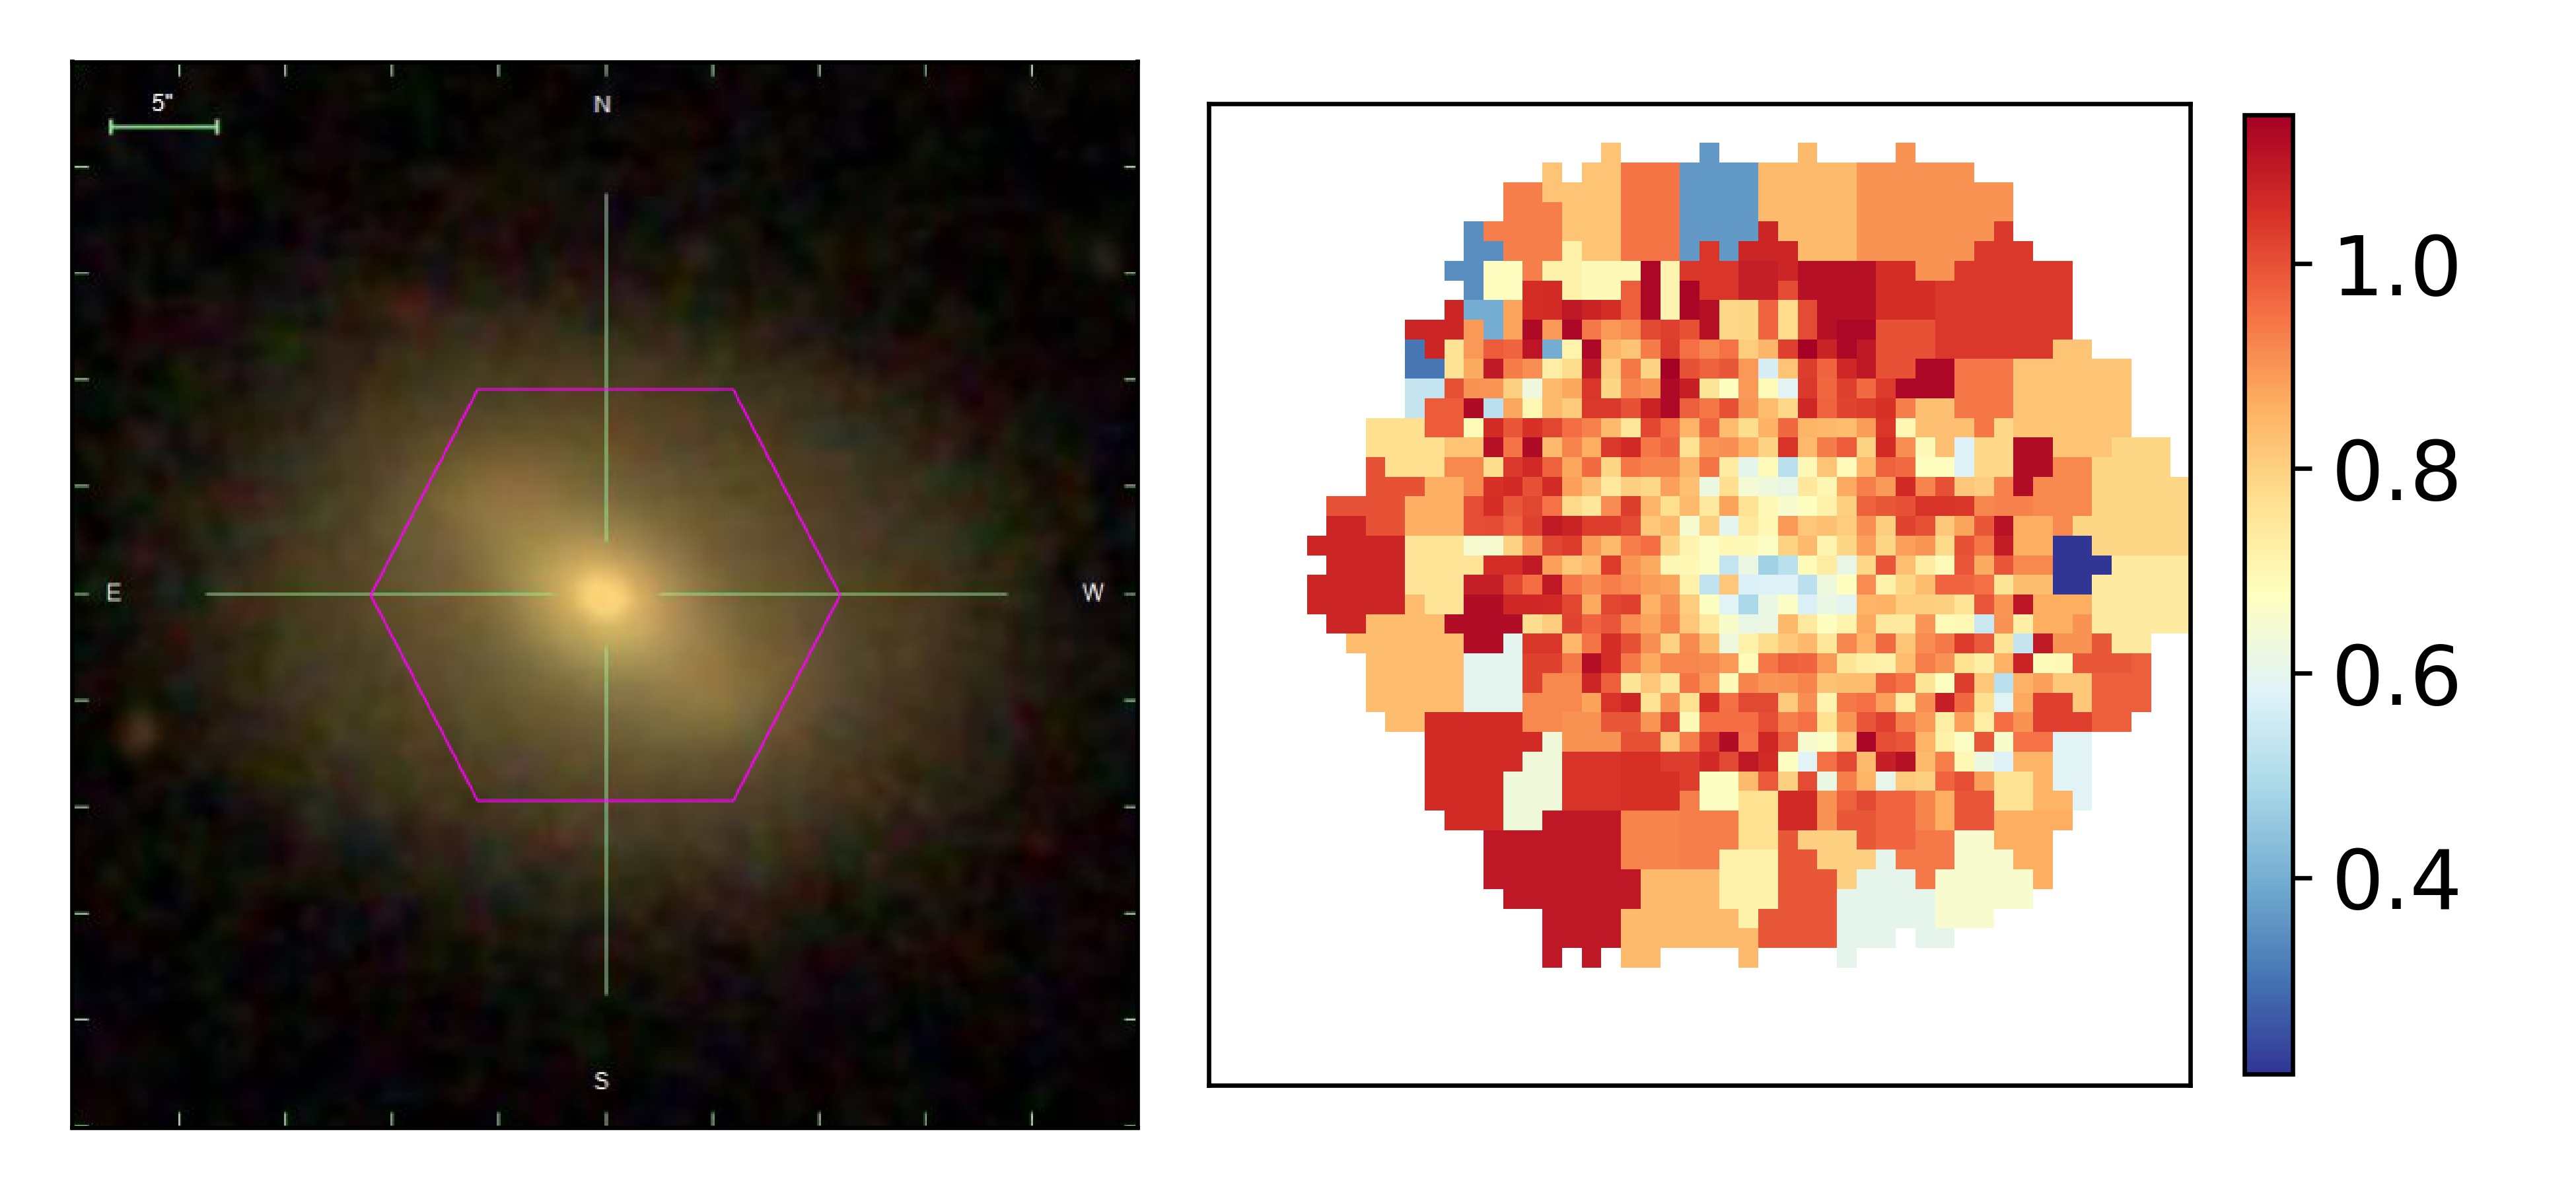
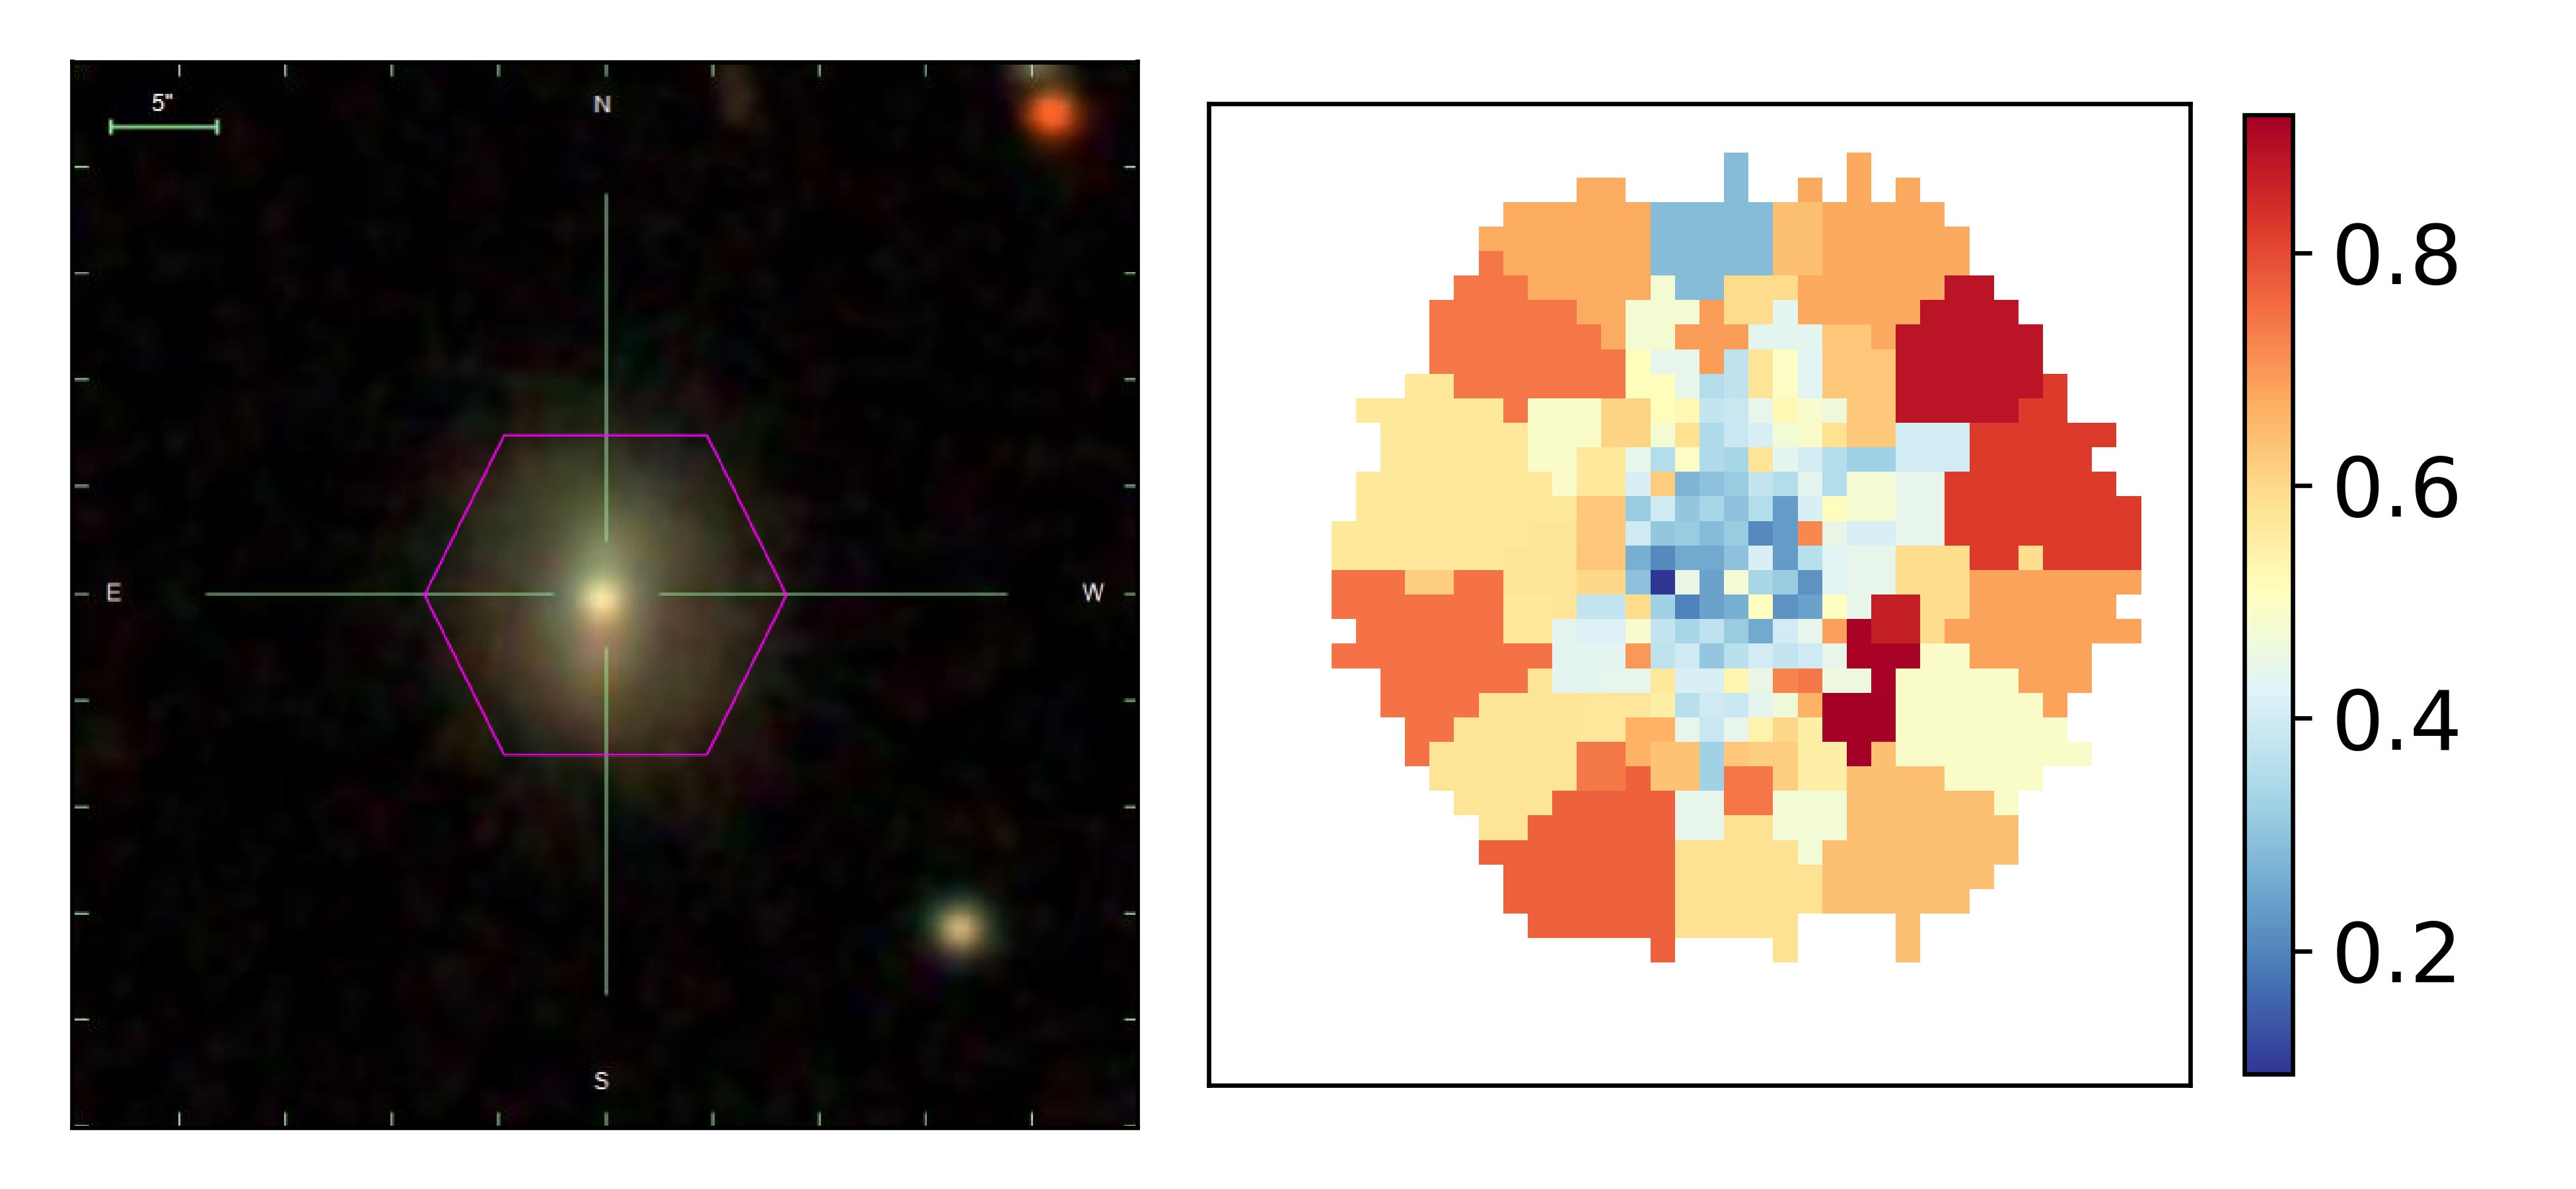
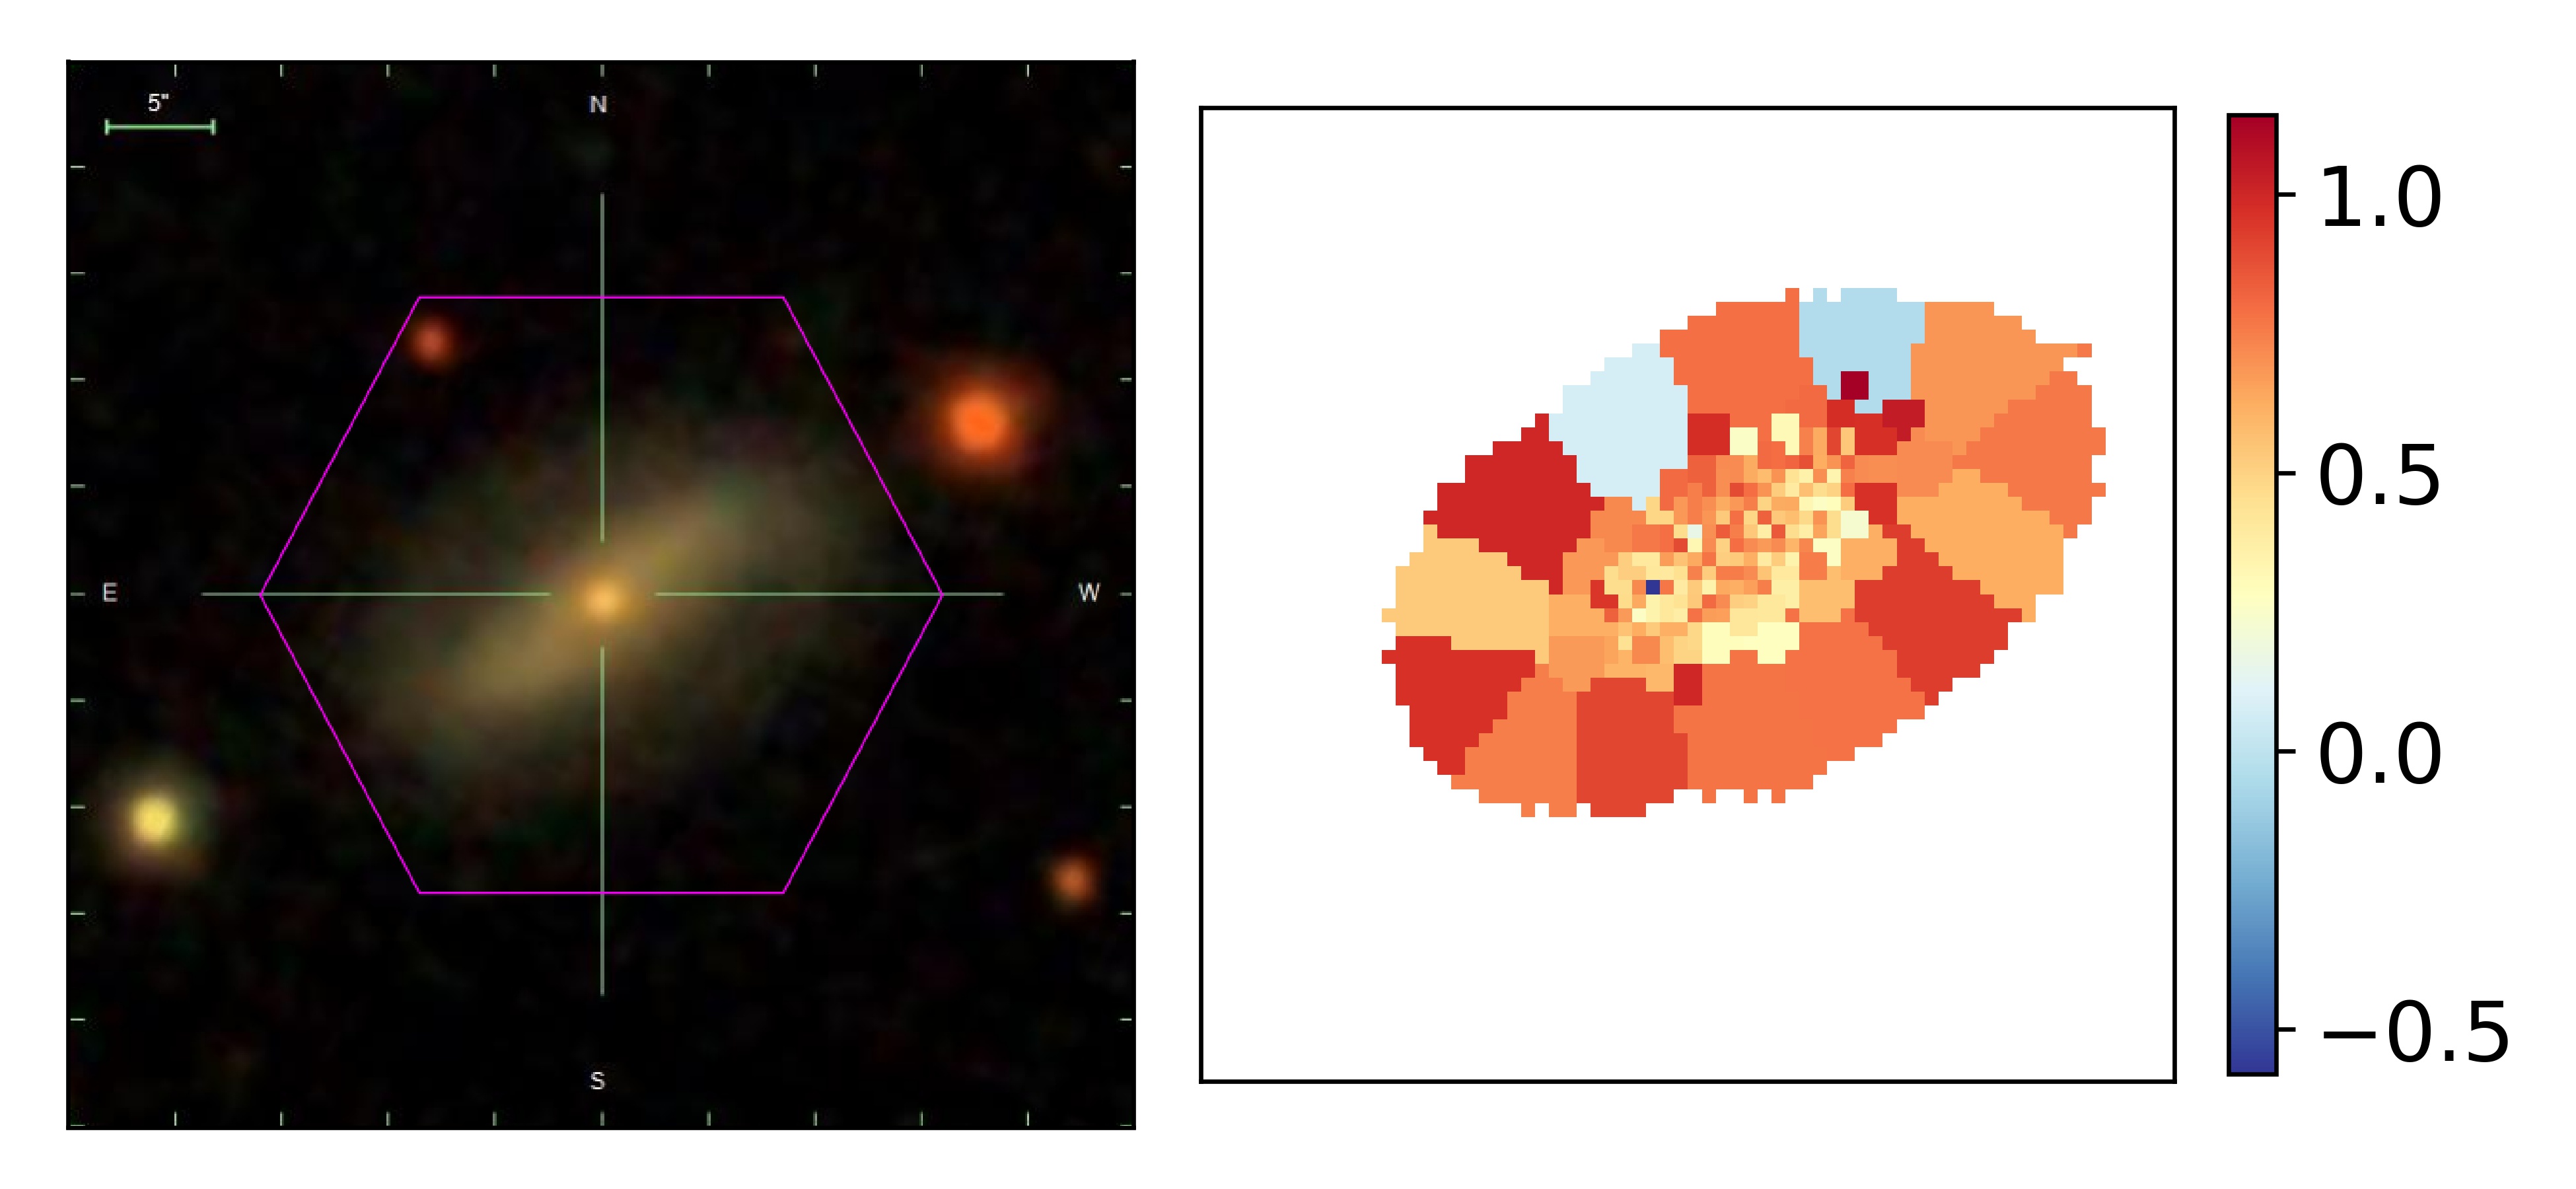
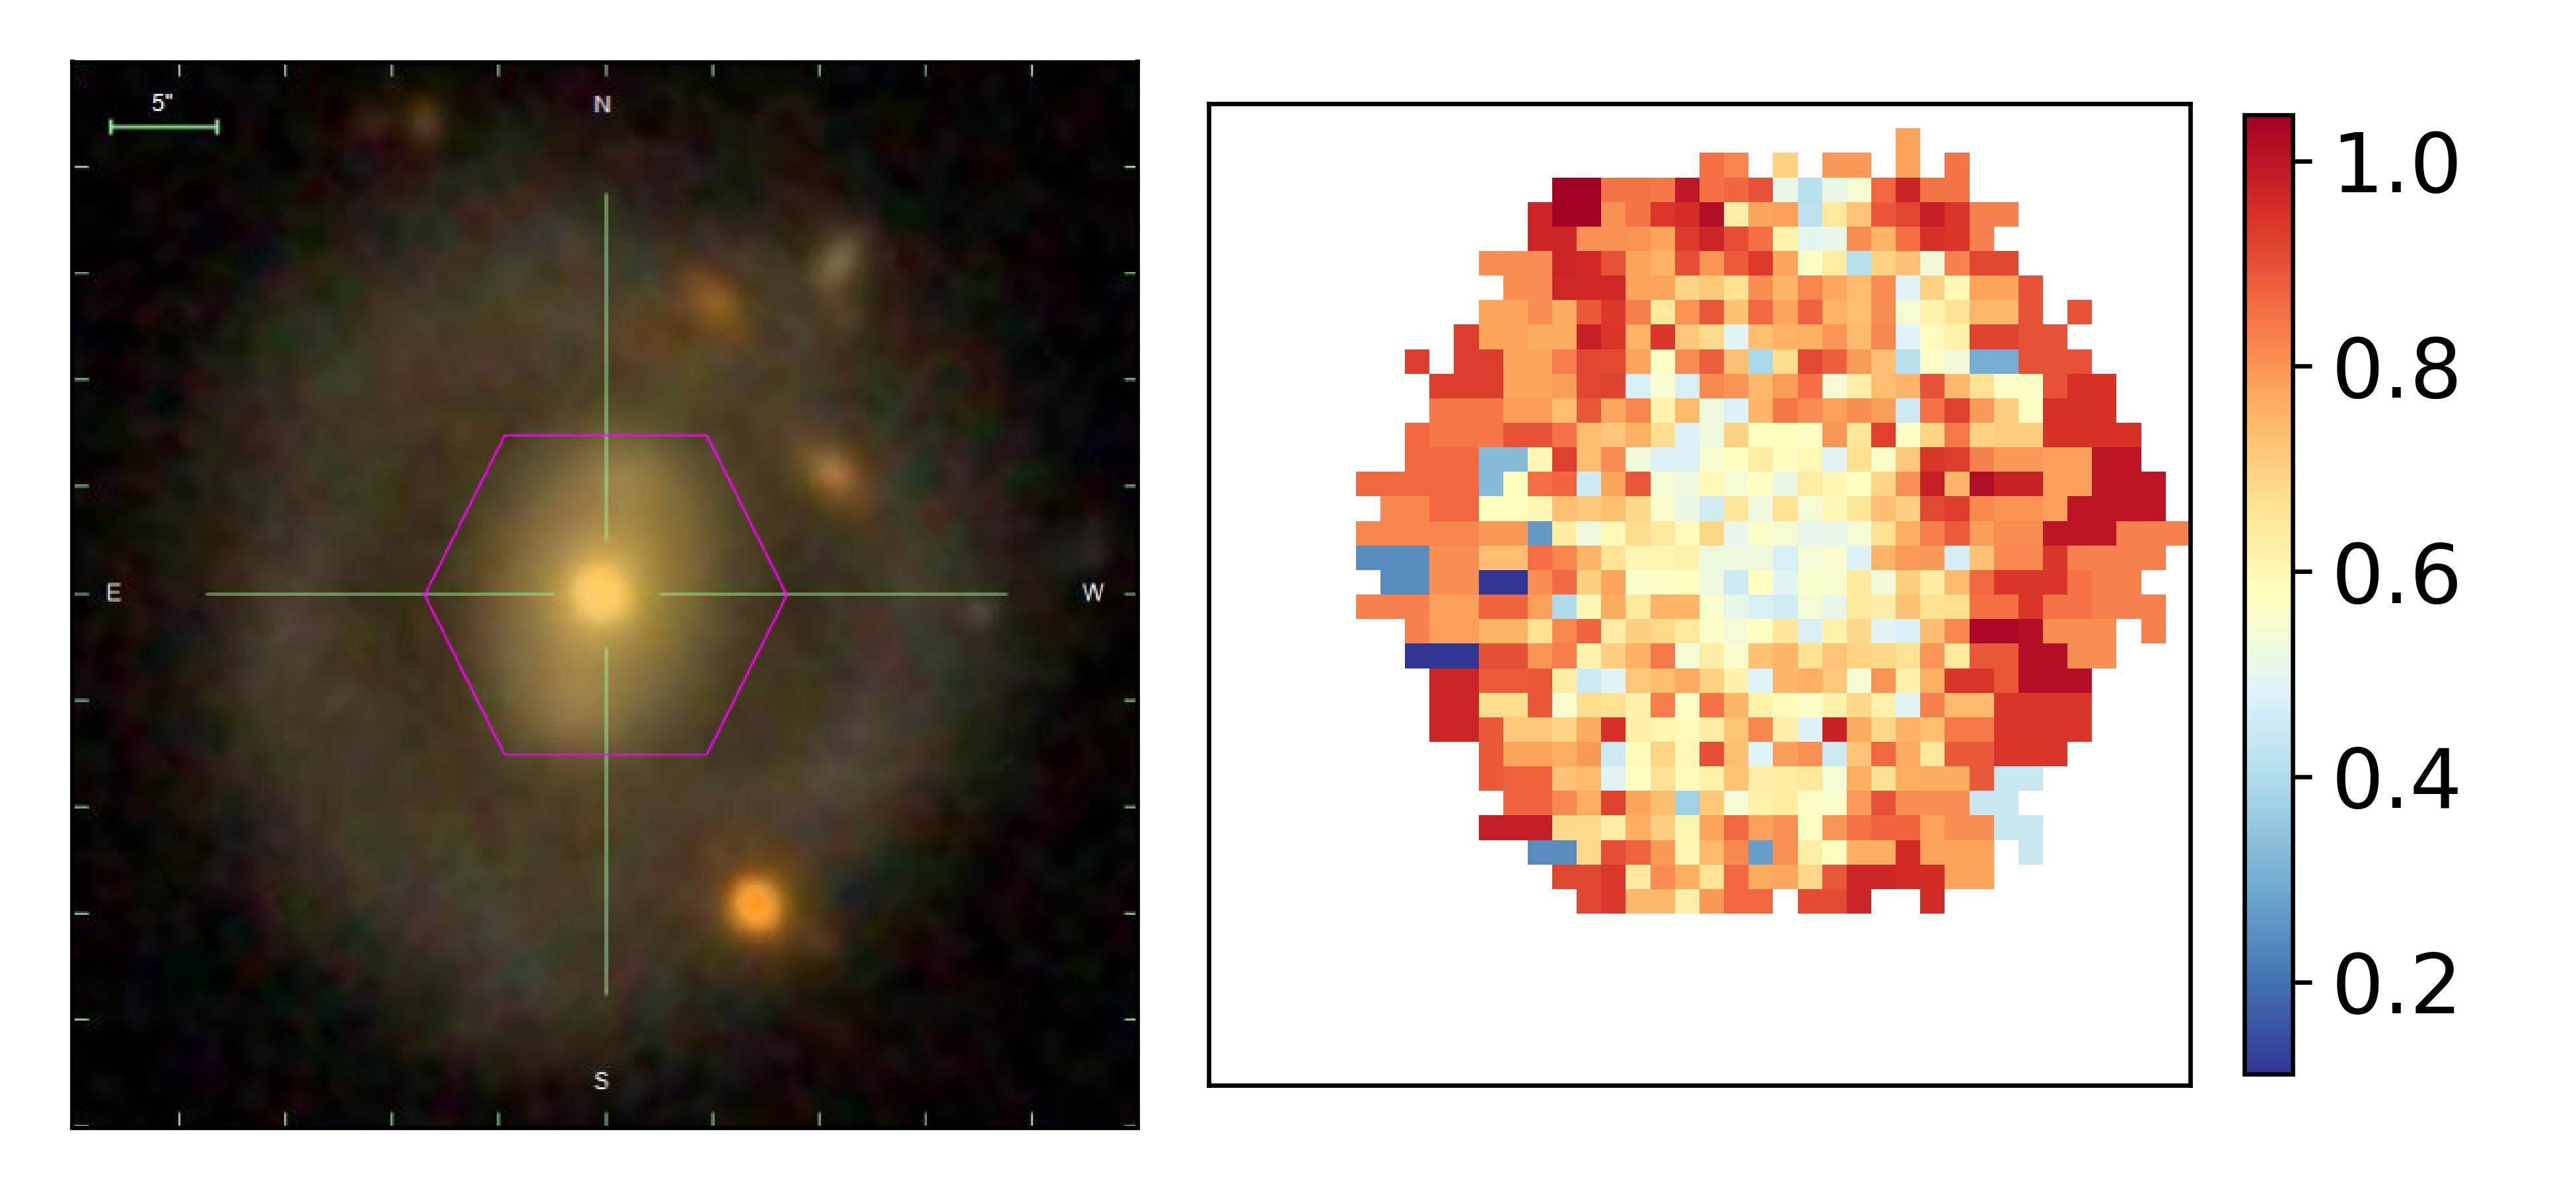
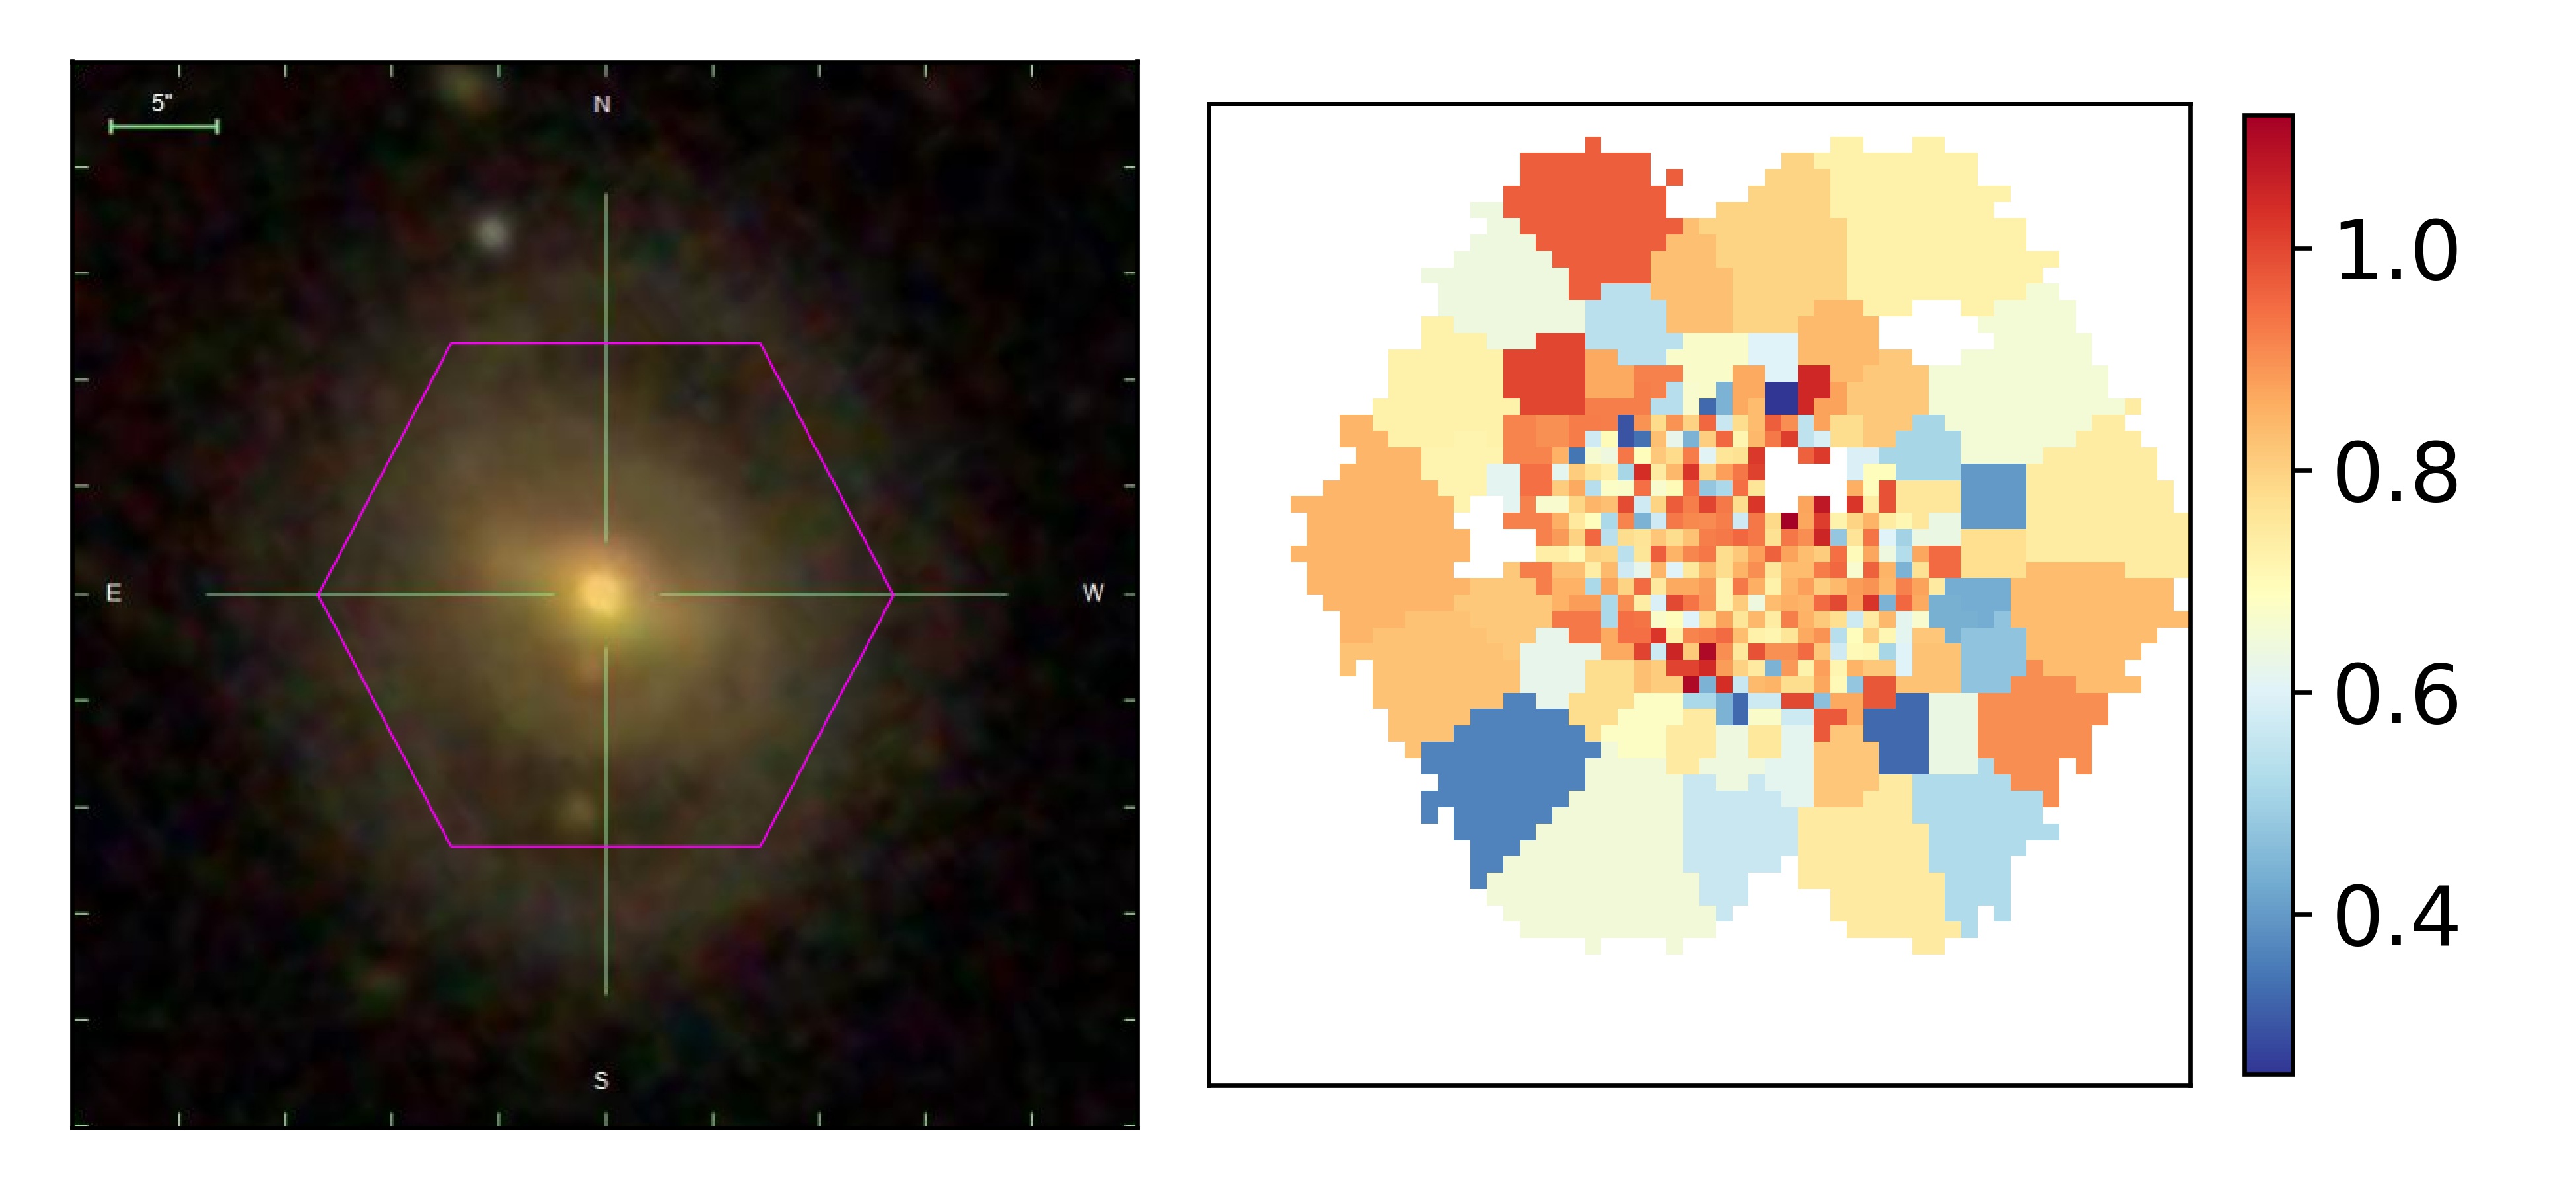
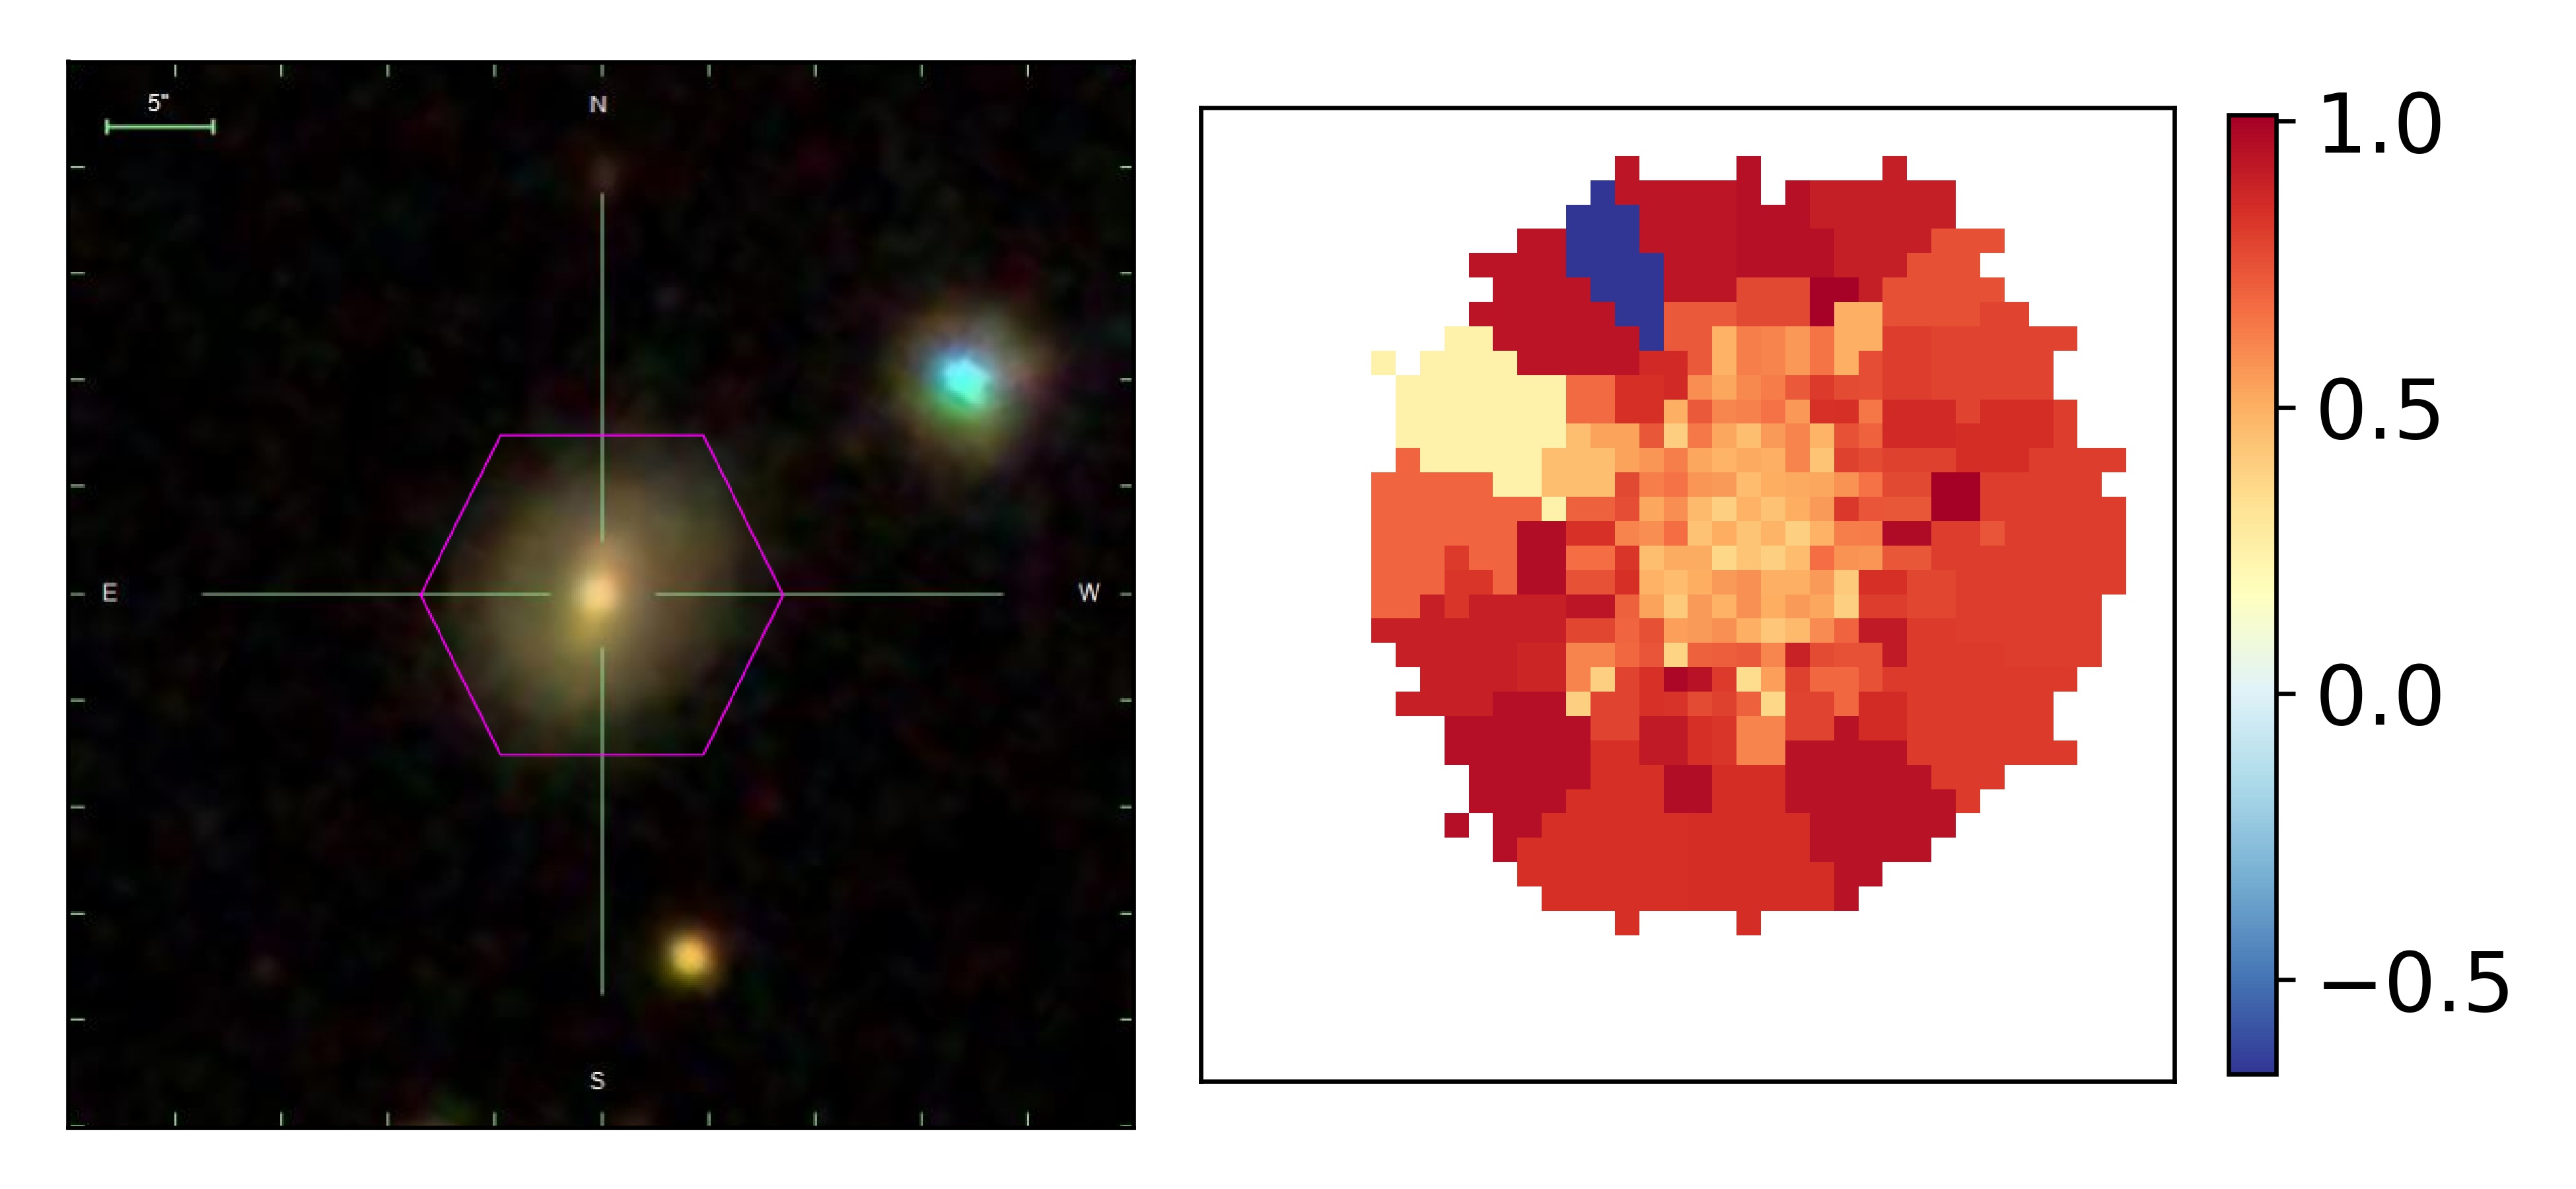
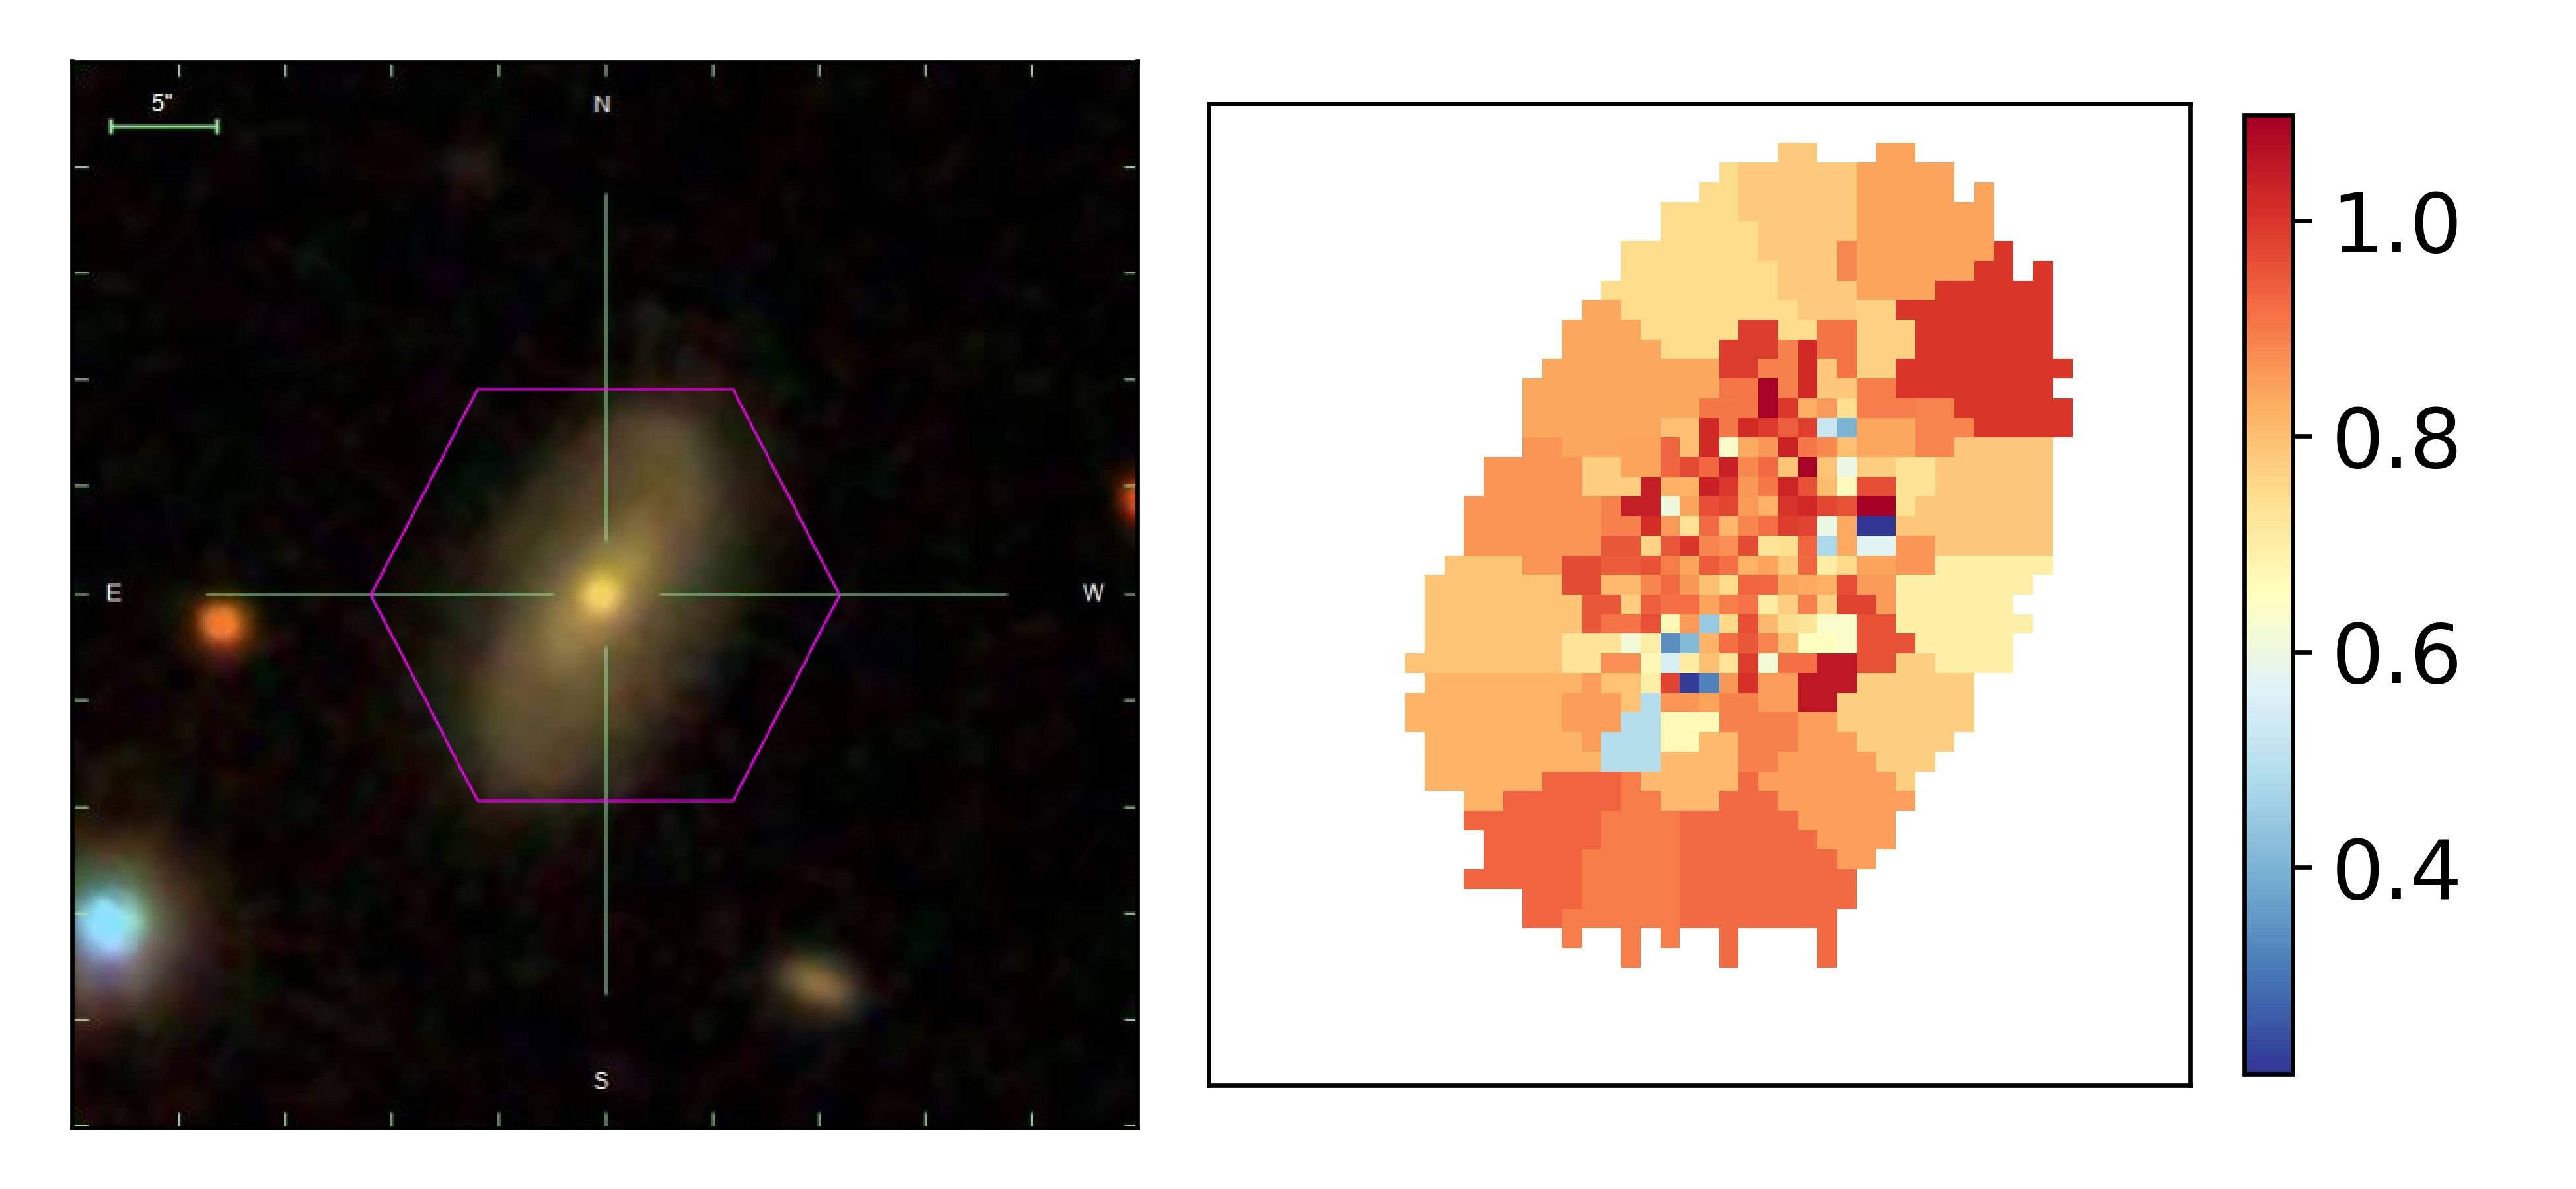
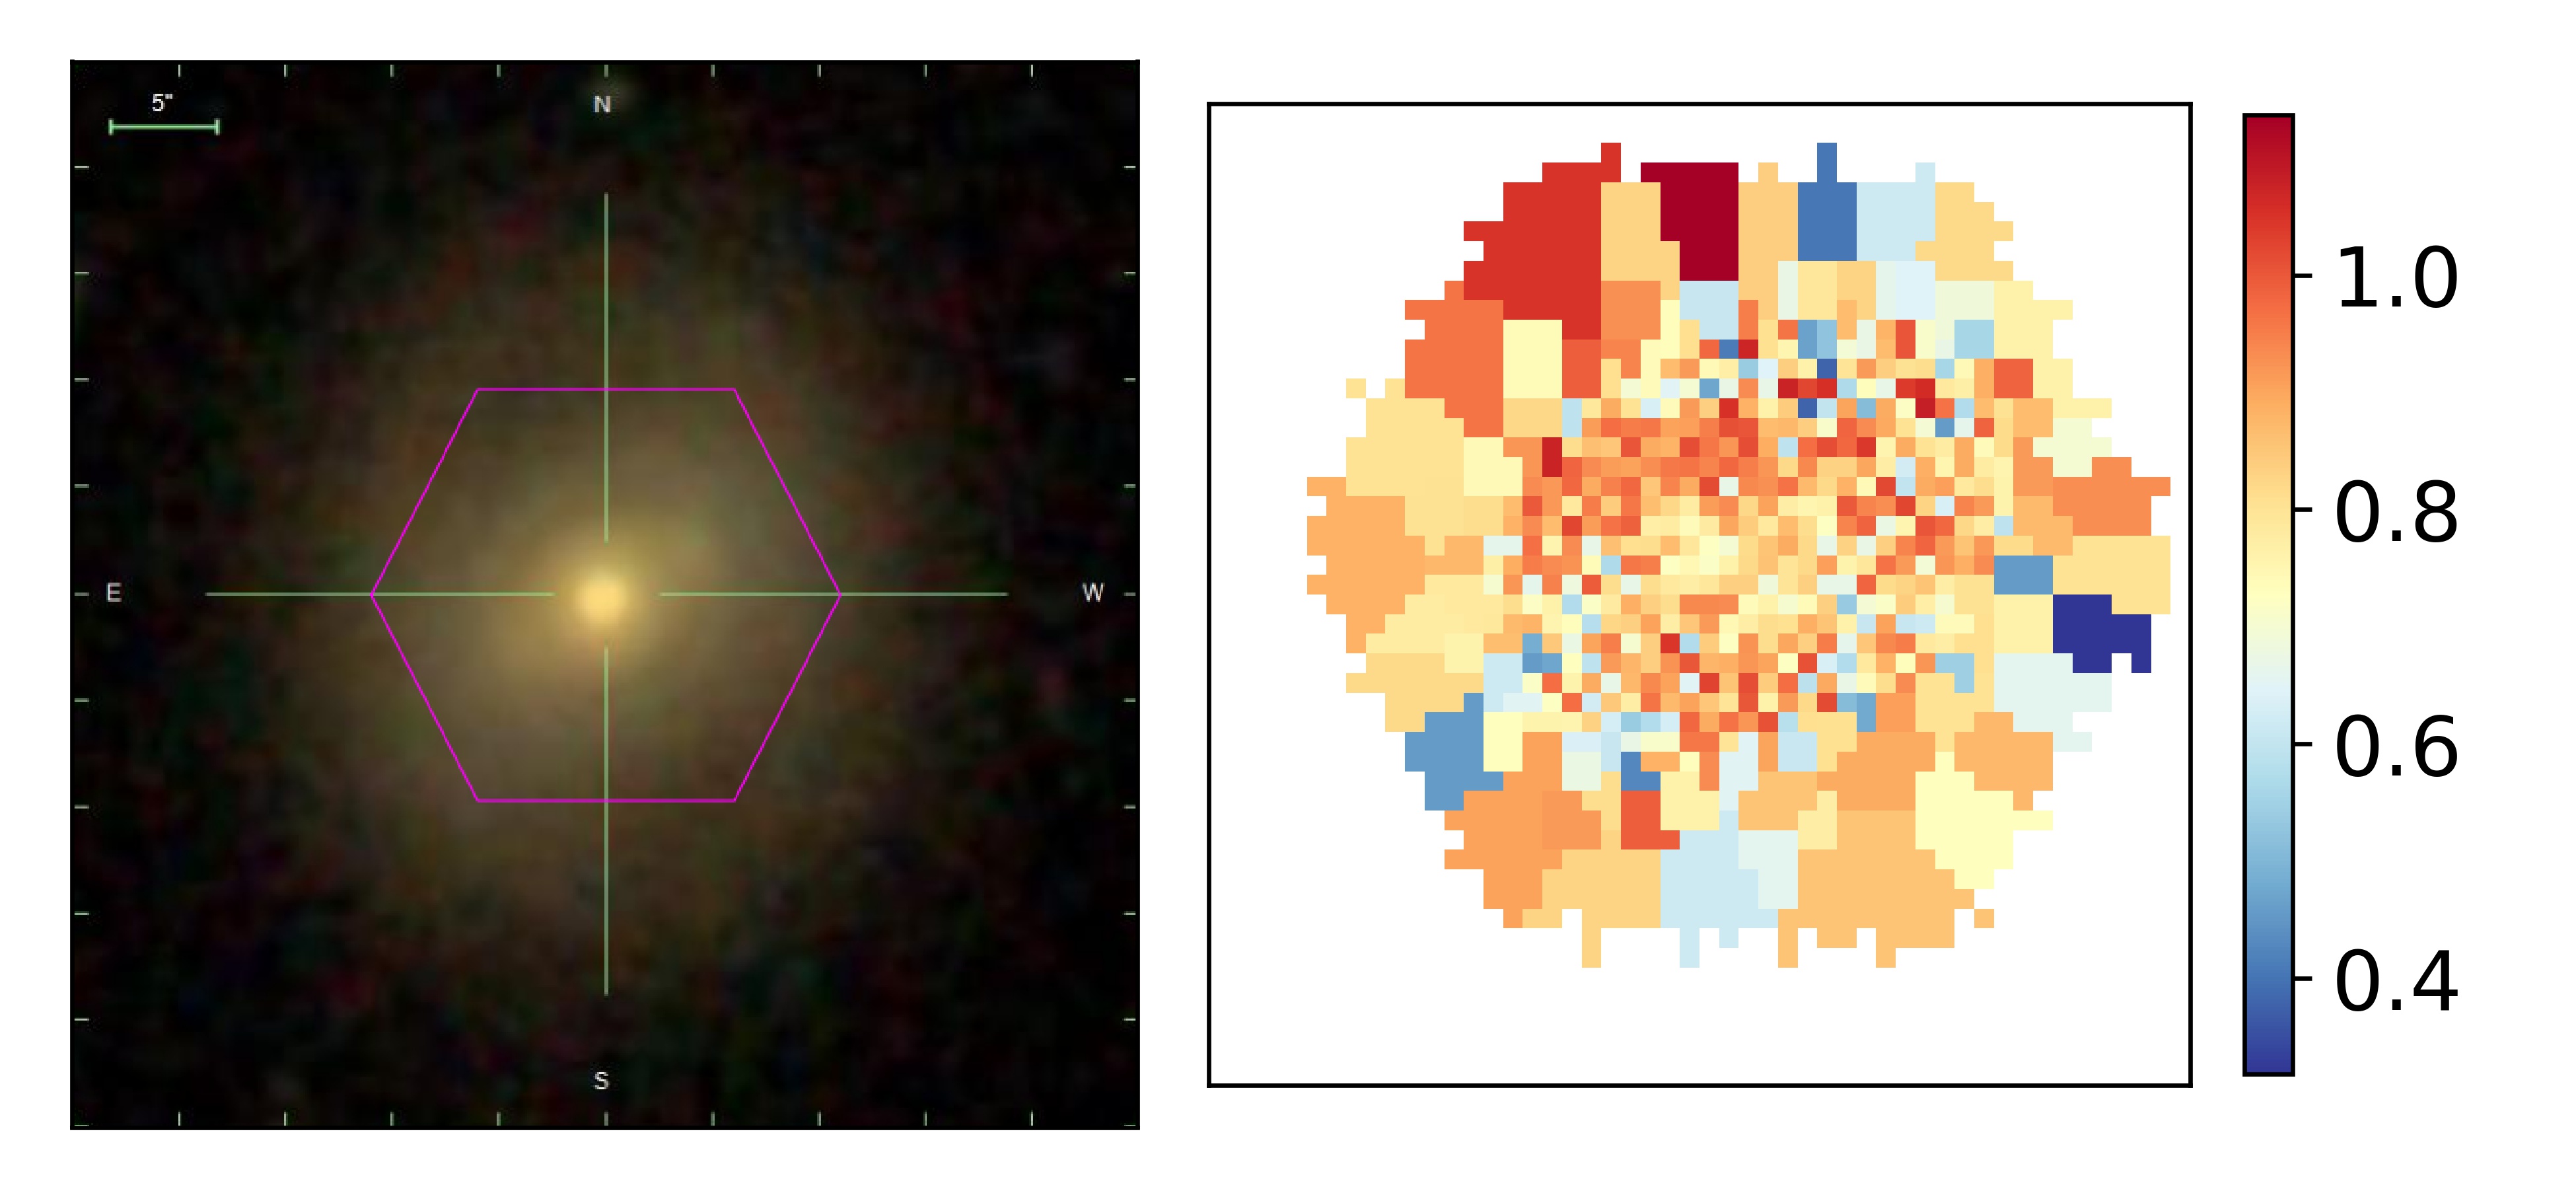
Fig. 16 shows SDSS galaxy images and luminosity-weighted age maps of a sample of face-on barred (P) green valley galaxies identified in the MaNGA FIREFLY catalog. From this figure we do not find any clear indication that the bar region is systematic older (redder) than the other parts of the galaxy. Therefore the quenching time-scales from Fig. 10 for barred green valley galaxies is very likely to be reflecting the overall galaxy evolution.
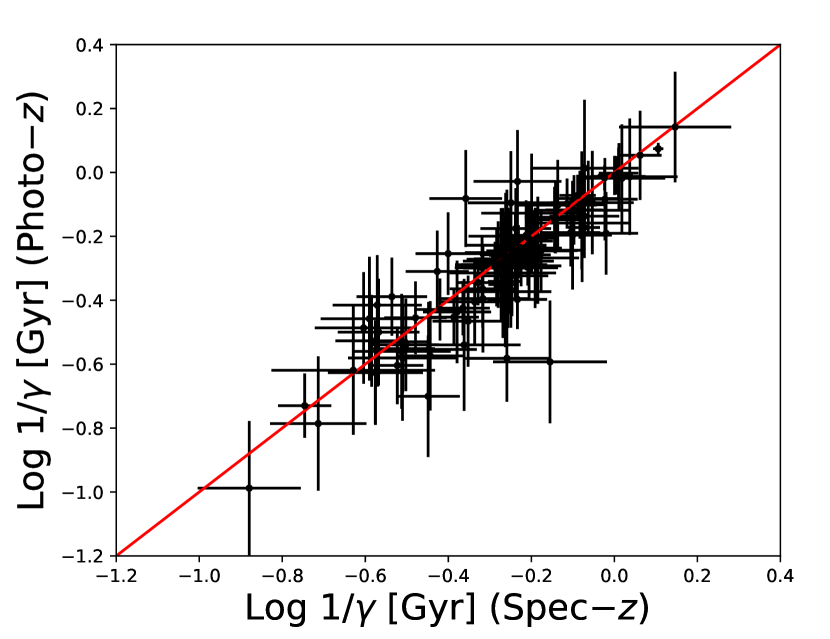
4.4 Photo-z impact on the quenching time-scales estimations
Another legacy of J-PLUS will be marked by photometric redshift determination of galaxies. We explore the impact of photo uncertainties when computing quenching time-scales with J-PLUS data. The photometric redshifts are calculated using the BPZ code (Benítez, 2000). Fig. 17 shows the correlation between the quenching time-scales obtained with spectroscopic redshifts with those obtained with photo. We find that for the majority of green valley galaxies we can recover approximately the same time-scales, demonstrating that the photo uncertainties impact is very small in quenching time-scales estimations.
5 Summary
The scarcity of galaxies between the blue and red peaks on galaxy CMD (green valley) and the growth of the red sequence (at least from ) indicate that galaxy transition across the green valley is rapid and continuous. The identification of the physical processes that are able to transform galaxies from star-forming to passive systems still remains a challenge to galaxy formation and evolution models. Stellar bars are one of the possible physical processes that could accelerate gas depletion and consequently quench star formation faster. In this work we adapted the method of Martin et al. (2007) which is able to estimate star formation quenching time-scales in green valley galaxies based on spectroscopic data to the photometric data from J-PLUS and GALEX surveys. Through this method, we measured quenching time-scales of nearby green valley galaxies () and we correlated these time-scales with the probability of these galaxies hosting a bar (bar probability).
Our main results are:
-
1.
Our method using photometric data is able to estimate quenching time-scales at the same precision level as that from Martin et al. (2007), which assesses quenching time-scales from galaxy spectra.
-
2.
We find a strong correlation between quenching time-scales and bar probability of green valley disc galaxies. Quenching time-scales among green valley galaxies with low bar probability have a large scatter whereas for high bar probability green valley disc galaxies tend to have long quenching time-scales. These results suggest that violent quenching processes, which are able to simultaneously destroy the bars and quench star formation quickly are absent or the gravitational potential of the host galaxy is strong enough to maintain both the stellar bar and a more stable star formation.
-
3.
The apparent bar bimodality with NUV colour indicates potential different bar phases. During the blue cloud phase bars are naturally formed, which is reflected by the increase of bar fraction with colour, until NUV. After this peak, bar fraction quickly decreases, reaching a minimum at the beginning of red sequence phase (NUV). This suggests that the same quenching processes that move galaxies across the green valley can also destroy the bars or bar-destroyers processes happen simultaneously with quenching processes. Red sequence discs can recover their bars, as indicated by the increase of bar fraction in NUV.
Our analysis of quenching time-scales as a function of bar probability in nearby green valley galaxies and bar fraction as a function of NUV colour suggests an evolutionary scenario (Fig. 12) where massive disc galaxies () quench their star formation in slow mode wheres unbarred galaxies can quench their star formation both in slow and fast modes. Future surveys, such as the recently started J-PAS, maybe can address this scenario in galaxy-dense environments.
Acknowledgements.
We thank the anonymous referee for contributing to improving our paper. JPNC was supported by a Institutional Capacity Program grant from CNPq the Brazilian National Council for Scientific and Technological Development within the Ministry of Education of Brazil and Ministry of Science, Technology, Innovations and Communication. RD acknowledges support from the CNPq through BP grant 312307/2015-2, and the Financiadora de Estudos e Projetos - FINEP grants REF. 1217/13 -01.13.0279.00 and REF 0859/10 - 01.10.0663.00 for hardware support for the J-PLUS project through the National Observatory of Brazil and CBPF. PC acknowledges support from FAPESP 2018/05392-8, CNPq 305066/2015-3 and USP/Cofecub 18.1.214.1.8/40449YB. MLLD acknowledges Coordenação de Aperfeiçoamento de Pessoal de Nível Superior - Brasil (CAPES) - Finance Code 001, Conselho Nacional de Desenvolvimento Científico e Tecnológico (CNPq). KMD thanks the support of the CNPq. JHJ thanks to Brazilian institution CNPq for financial support through postdoctoral fellowship (project 150237/2017-0) and Chilean institution CONICYT, Programa de Astronomía, Fondo ALMA-CONICYT 2017, Código de proyecto 31170038. ET was supported by ETAg grants IUT40-2, IUT26-2 and by EU through the ERDF CoE grant TK133 and MOBTP86. This research made use of the “K-corrections calculator” service available at http://kcor.sai.msu.ru/. Python wrapper of the C library by Blanton & Roweis (2007), with Python wrapper on github666https://pypi.python.org/pypi/kcorrect_python/2017.07.05. Based on observations made with the JAST/T80 telescope at the Observatorio Astrofísico de Javalambre (OAJ), in Teruel, owned, managed and operated by the Centro de Estudios de Física del Cosmos de Aragón. We acknowledge the OAJ Data Processing and Archiving Unit (UPAD) for reducing and calibrating the OAJ data used in this work. Funding for the J-PLUS Project has been provided by the Governments of Spain and Aragón through the Fondo de Inversiones de Teruel; the Aragón Government through the Reseach Groups E96, E103, and E16_17R; the Spanish Ministry of Science, Innovation and Universities (MCIU/AEI/FEDER, UE) with grants PGC2018-097585-B-C21 and PGC2018-097585-B-C22, the Spanish Ministry of Economy and Competitiveness (MINECO) under AYA2015-66211-C2-1-P, AYA2015-66211-C2-2, AYA2012-30789, and ICTS-2009-14; and European FEDER funding (FCDD10-4E-867, FCDD13-4E-2685). Funding for the SDSS and SDSS-II has been provided by the Alfred P. Sloan Foundation, the Participating Institutions, the National Science Foundation, the U.S. Department of Energy, the National Aeronautics and Space Administration, the Japanese Monbukagakusho, the Max Planck Society, and the Higher Education Funding Council for England. The SDSS Web Site is www.sdss.org. The SDSS is managed by the Astrophysical Research Consortium for the Participating Institutions. The Participating Institutions are the American Museum of Natural History, Astrophysical Institute Potsdam, University of Basel, University of Cambridge, Case Western Reserve University, University of Chicago, Drexel University, Fermilab, the Institute for Advanced Study, the Japan Participation Group, Johns Hopkins University, the Joint Institute for Nuclear Astrophysics, the Kavli Institute for Particle Astrophysics and Cosmology, the Korean Scientist Group, the Chinese Academy of Sciences (LAMOST), Los Alamos National Laboratory, the Max-Planck-Institute for Astronomy (MPIA), the Max-Planck-Institute for Astrophysics (MPA), New Mexico State University, the Ohio State University, University of Pittsburgh, University of Portsmouth, Princeton University, the United States Naval Observatory, and the University of Washington. This research is based on observations made with the Galaxy Evolution Explorer, obtained from the MAST data archive at the Space Telescope Science Institute, which is operated by the Association of Universities for Research in Astronomy, Inc., under NASA contract NAS 526555.References
- Abadi et al. (1999) Abadi, M. G., Moore, B., & Bower, R. G. 1999, MNRAS, 308, 947
- Aguerri et al. (2009) Aguerri, J. A. L., Méndez-Abreu, J., & Corsini, E. M. 2009, A&A, 495, 491
- Alam et al. (2015) Alam, S., Albareti, F. D., Allende Prieto, C., et al. 2015, ApJS, 219, 12
- Alongi et al. (1993) Alongi, M., Bertelli, G., Bressan, A., et al. 1993, A&AS, 97, 851
- Athanassoula (2002) Athanassoula, E. 2002, ApJ, 569, L83
- Athanassoula (2003) Athanassoula, E. 2003, MNRAS, 341, 1179
- Athanassoula et al. (2005) Athanassoula, E., Lambert, J. C., & Dehnen, W. 2005, MNRAS, 363, 496
- Athanassoula et al. (2013) Athanassoula, E., Machado, R. E. G., & Rodionov, S. A. 2013, MNRAS, 429, 1949
- Athanassoula & Sellwood (1986) Athanassoula, E. & Sellwood, J. A. 1986, MNRAS, 221, 213
- Aumer & Binney (2017) Aumer, M. & Binney, J. 2017, MNRAS, 470, 2113
- Baldry et al. (2004) Baldry, I. K., Glazebrook, K., Brinkmann, J., et al. 2004, ApJ, 600, 681
- Balogh et al. (2004) Balogh, M. L., Baldry, I. K., Nichol, R., et al. 2004, ApJ, 615, L101
- Balogh et al. (1999) Balogh, M. L., Morris, S. L., Yee, H. K. C., Carlberg, R. G., & Ellingson, E. 1999, ApJ, 527, 54
- Bell et al. (2004) Bell, E. F., Wolf, C., Meisenheimer, K., et al. 2004, ApJ, 608, 752
- Benítez (2000) Benítez, N. 2000, ApJ, 536, 571
- Benitez et al. (2014) Benitez, N., Dupke, R., Moles, M., et al. 2014, ArXiv e-prints [arXiv:1403.5237]
- Berentzen et al. (2004) Berentzen, I., Athanassoula, E., Heller, C. H., & Fricke, K. J. 2004, MNRAS, 347, 220
- Blanton et al. (2017) Blanton, M. R., Bershady, M. A., Abolfathi, B., et al. 2017, AJ, 154, 28
- Blanton & Roweis (2007) Blanton, M. R. & Roweis, S. 2007, AJ, 133, 734
- Blanton et al. (2005) Blanton, M. R., Schlegel, D. J., Strauss, M. A., et al. 2005, AJ, 129, 2562
- Bongiorno et al. (2016) Bongiorno, A., Schulze, A., Merloni, A., et al. 2016, A&A, 588, A78
- Boselli et al. (2006) Boselli, A., Boissier, S., Cortese, L., et al. 2006, ApJ, 651, 811
- Bournaud & Combes (2002) Bournaud, F. & Combes, F. 2002, A&A, 392, 83
- Brammer et al. (2009) Brammer, G. B., Whitaker, K. E., van Dokkum, P. G., et al. 2009, ApJ, 706, L173
- Bremer et al. (2018) Bremer, M. N., Phillipps, S., Kelvin, L. S., et al. 2018, MNRAS, 476, 12
- Bressan et al. (1993) Bressan, A., Fagotto, F., Bertelli, G., & Chiosi, C. 1993, A&AS, 100, 647
- Brinchmann et al. (2004) Brinchmann, J., Charlot, S., White, S. D. M., et al. 2004, MNRAS, 351, 1151
- Brown et al. (2007) Brown, M. J. I., Dey, A., Jannuzi, B. T., et al. 2007, ApJ, 654, 858
- Bruzual & Charlot (2003) Bruzual, G. & Charlot, S. 2003, MNRAS, 344, 1000
- Bruzual A. (1983) Bruzual A., G. 1983, ApJ, 273, 105
- Bundy et al. (2015) Bundy, K., Bershady, M. A., Law, D. R., et al. 2015, ApJ, 798, 7
- Calzetti et al. (2000) Calzetti, D., Armus, L., Bohlin, R. C., et al. 2000, ApJ, 533, 682
- Calzetti et al. (1994) Calzetti, D., Kinney, A. L., & Storchi-Bergmann, T. 1994, ApJ, 429, 582
- Capak et al. (2007) Capak, P., Aussel, H., Ajiki, M., et al. 2007, ApJS, 172, 99
- Cattaneo et al. (2009) Cattaneo, A., Faber, S. M., Binney, J., et al. 2009, Nature, 460, 213
- Cenarro et al. (2019) Cenarro, A. J., Moles, M., Cristóbal-Hornillos, D., et al. 2019, A&A, 622, A176
- Chabrier (2003) Chabrier, G. 2003, ApJ, 586, L133
- Cheng et al. (2011) Cheng, J. Y., Faber, S. M., Simard, L., et al. 2011, MNRAS, 412, 727
- Cheung et al. (2013) Cheung, E., Athanassoula, E., Masters, K. L., et al. 2013, ApJ, 779, 162
- Chilingarian et al. (2010) Chilingarian, I. V., Melchior, A.-L., & Zolotukhin, I. Y. 2010, MNRAS, 405, 1409
- Chilingarian & Zolotukhin (2012) Chilingarian, I. V. & Zolotukhin, I. Y. 2012, MNRAS, 419, 1727
- Ciotti & Ostriker (2007) Ciotti, L. & Ostriker, J. P. 2007, ApJ, 665, 1038
- Coelho & Gadotti (2011) Coelho, P. & Gadotti, D. A. 2011, ApJ, 743, L13
- Conselice (2006) Conselice, C. J. 2006, ApJ, 638, 686
- Darvish et al. (2018) Darvish, B., Martin, C., Gonçalves, T. S., et al. 2018, ApJ, 853, 155
- Darvish et al. (2016) Darvish, B., Mobasher, B., Sobral, D., et al. 2016, ApJ, 825, 113
- de Vaucouleurs (1963) de Vaucouleurs, G. 1963, ApJS, 8, 31
- Debattista et al. (2006) Debattista, V. P., Mayer, L., Carollo, C. M., et al. 2006, ApJ, 645, 209
- Debattista & Sellwood (2000) Debattista, V. P. & Sellwood, J. A. 2000, ApJ, 543, 704
- Dekel & Burkert (2014) Dekel, A. & Burkert, A. 2014, MNRAS, 438, 1870
- Di Matteo et al. (2005) Di Matteo, T., Springel, V., & Hernquist, L. 2005, Nature, 433, 604
- Díaz-García et al. (2017) Díaz-García, L. A., Cenarro, A. J., López-Sanjuan, C., et al. 2017, arXiv e-prints [arXiv:1711.10590]
- Domínguez Sánchez et al. (2018) Domínguez Sánchez, H., Huertas-Company, M., Bernardi, M., Tuccillo, D., & Fischer, J. L. 2018, MNRAS, 476, 3661
- Drory et al. (2015) Drory, N., MacDonald, N., Bershady, M. A., et al. 2015, AJ, 149, 77
- Dubois et al. (2013) Dubois, Y., Gavazzi, R., Peirani, S., & Silk, J. 2013, MNRAS, 433, 3297
- Elmegreen & Elmegreen (1985) Elmegreen, B. G. & Elmegreen, D. M. 1985, ApJ, 288, 438
- Elmegreen & Elmegreen (1989) Elmegreen, B. G. & Elmegreen, D. M. 1989, ApJ, 342, 677
- Evans et al. (2018) Evans, F. A., Parker, L. C., & Roberts, I. D. 2018, MNRAS, 476, 5284
- Faber et al. (2007) Faber, S. M., Willmer, C. N. A., Wolf, C., et al. 2007, ApJ, 665, 265
- Fagotto et al. (1994a) Fagotto, F., Bressan, A., Bertelli, G., & Chiosi, C. 1994a, A&AS, 104
- Fagotto et al. (1994b) Fagotto, F., Bressan, A., Bertelli, G., & Chiosi, C. 1994b, A&AS, 105
- Fitzpatrick (1999) Fitzpatrick, E. L. 1999, PASP, 111, 63
- Gadotti & de Souza (2006) Gadotti, D. A. & de Souza, R. E. 2006, ApJS, 163, 270
- Gavazzi et al. (2015) Gavazzi, G., Consolandi, G., Dotti, M., et al. 2015, A&A, 580, A116
- Genzel et al. (2010) Genzel, R., Tacconi, L. J., Gracia-Carpio, J., et al. 2010, MNRAS, 407, 2091
- Gilbank et al. (2010) Gilbank, D. G., Balogh, M. L., Glazebrook, K., et al. 2010, MNRAS, 405, 2419
- Goddard et al. (2017) Goddard, D., Thomas, D., Maraston, C., et al. 2017, MNRAS, 466, 4731
- Gonçalves et al. (2012) Gonçalves, T. S., Martin, D. C., Menéndez-Delmestre, K., Wyder, T. K., & Koekemoer, A. 2012, ApJ, 759, 67
- Gunn & Gott (1972) Gunn, J. E. & Gott, III, J. R. 1972, ApJ, 176, 1
- Gunn et al. (2006) Gunn, J. E., Siegmund, W. A., Mannery, E. J., et al. 2006, AJ, 131, 2332
- Hatfield & Jarvis (2017) Hatfield, P. W. & Jarvis, M. J. 2017, MNRAS, 472, 3570
- Hausman & Ostriker (1978) Hausman, M. A. & Ostriker, J. P. 1978, ApJ, 224, 320
- Haywood et al. (2016) Haywood, M., Lehnert, M. D., Di Matteo, P., et al. 2016, A&A, 589, A66
- Ho et al. (1997) Ho, L. C., Filippenko, A. V., & Sargent, W. L. W. 1997, ApJ, 487, 591
- Huertas-Company et al. (2011) Huertas-Company, M., Aguerri, J. A. L., Bernardi, M., Mei, S., & Sánchez Almeida, J. 2011, A&A, 525, A157
- Ilbert et al. (2013) Ilbert, O., McCracken, H. J., Le Fèvre, O., et al. 2013, A&A, 556, A55
- Kauffmann et al. (2003) Kauffmann, G., Heckman, T. M., White, S. D. M., et al. 2003, MNRAS, 341, 33
- Kelvin et al. (2018) Kelvin, L. S., Bremer, M. N., Phillipps, S., et al. 2018, MNRAS, 477, 4116
- Khoperskov et al. (2018) Khoperskov, S., Haywood, M., Di Matteo, P., Lehnert, M. D., & Combes, F. 2018, A&A, 609, A60
- Kocevski et al. (2017) Kocevski, D. D., Barro, G., Faber, S. M., et al. 2017, ApJ, 846, 112
- Kormendy & Kennicutt (2004) Kormendy, J. & Kennicutt, Jr., R. C. 2004, ARA&A, 42, 603
- Kroupa (2001) Kroupa, P. 2001, MNRAS, 322, 231
- Kruk et al. (2018) Kruk, S. J., Lintott, C. J., Bamford, S. P., et al. 2018, MNRAS, 473, 4731
- Lagos et al. (2013) Lagos, C. d. P., Lacey, C. G., & Baugh, C. M. 2013, MNRAS, 436, 1787
- Lee et al. (2012) Lee, G.-H., Park, C., Lee, M. G., & Choi, Y.-Y. 2012, ApJ, 745, 125
- Lilly et al. (2007) Lilly, S. J., Le Fèvre, O., Renzini, A., et al. 2007, ApJS, 172, 70
- Lim et al. (2015) Lim, P. L., Diaz, R. I., & Laidler, V. 2015, PySynphot User’s Guide
- Machado & Athanassoula (2010) Machado, R. E. G. & Athanassoula, E. 2010, MNRAS, 406, 2386
- Madau & Dickinson (2014) Madau, P. & Dickinson, M. 2014, ARA&A, 52, 415
- Maltby et al. (2018) Maltby, D. T., Almaini, O., Wild, V., et al. 2018, MNRAS, 480, 381
- Maraston & Strömbäck (2011) Maraston, C. & Strömbäck, G. 2011, MNRAS, 418, 2785
- Martin et al. (2005) Martin, D. C., Fanson, J., Schiminovich, D., et al. 2005, ApJ, 619, L1
- Martin et al. (2017) Martin, D. C., Gonçalves, T. S., Darvish, B., Seibert, M., & Schiminovich, D. 2017, ApJ, 842, 20
- Martin et al. (2007) Martin, D. C., Wyder, T. K., Schiminovich, D., et al. 2007, ApJS, 173, 342
- Masters et al. (2010) Masters, K. L., Mosleh, M., Romer, A. K., et al. 2010, MNRAS, 405, 783
- Masters et al. (2011) Masters, K. L., Nichol, R. C., Hoyle, B., et al. 2011, MNRAS, 411, 2026
- McGee et al. (2011) McGee, S. L., Balogh, M. L., Wilman, D. J., et al. 2011, MNRAS, 413, 996
- Menci et al. (2005) Menci, N., Fontana, A., Giallongo, E., & Salimbeni, S. 2005, ApJ, 632, 49
- Mendez et al. (2011) Mendez, A. J., Coil, A. L., Lotz, J., et al. 2011, ApJ, 736, 110
- Méndez-Abreu et al. (2008) Méndez-Abreu, J., Aguerri, J. A. L., Corsini, E. M., & Simonneau, E. 2008, A&A, 478, 353
- Menéndez-Delmestre et al. (2007) Menéndez-Delmestre, K., Sheth, K., Schinnerer, E., Jarrett, T. H., & Scoville, N. Z. 2007, ApJ, 657, 790
- Moore et al. (1998) Moore, B., Lake, G., & Katz, N. 1998, ApJ, 495, 139
- Moran et al. (2007) Moran, S. M., Ellis, R. S., Treu, T., et al. 2007, ApJ, 671, 1503
- Muzzin et al. (2013) Muzzin, A., Marchesini, D., Stefanon, M., et al. 2013, ApJ, 777, 18
- Nair & Abraham (2010) Nair, P. B. & Abraham, R. G. 2010, ApJS, 186, 427
- Noeske et al. (2007) Noeske, K. G., Weiner, B. J., Faber, S. M., et al. 2007, ApJ, 660, L43
- Nogueira-Cavalcante et al. (2018) Nogueira-Cavalcante, J. P., Gonçalves, T. S., Menéndez-Delmestre, K., & Sheth, K. 2018, MNRAS, 473, 1346
- Nogueira-Cavalcante et al. (2019) Nogueira-Cavalcante, J. P., Gonçalves, T. S., Menéndez-Delmestre, K., de la Rosa, I. G., & Charbonnier, A. 2019, MNRAS, 484, 3022
- Norman et al. (1996) Norman, C. A., Sellwood, J. A., & Hasan, H. 1996, ApJ, 462, 114
- Oh et al. (2012) Oh, S., Oh, K., & Yi, S. K. 2012, ApJS, 198, 4
- Pan et al. (2013) Pan, Z., Kong, X., & Fan, L. 2013, ApJ, 776, 14
- Pan et al. (2014) Pan, Z., Li, J., Lin, W., Wang, J., & Kong, X. 2014, ApJ, 792, L4
- Peng et al. (2015) Peng, Y., Maiolino, R., & Cochrane, R. 2015, Nature, 521, 192
- Peng et al. (2010) Peng, Y.-j., Lilly, S. J., Kovač, K., et al. 2010, ApJ, 721, 193
- Renzini & Peng (2015) Renzini, A. & Peng, Y.-j. 2015, ApJ, 801, L29
- Roberts et al. (1979) Roberts, Jr., W. W., Huntley, J. M., & van Albada, G. D. 1979, ApJ, 233, 67
- Rowlands et al. (2018) Rowlands, K., Wild, V., Bourne, N., et al. 2018, MNRAS, 473, 1168
- Salim (2014) Salim, S. 2014, Serbian Astronomical Journal, 189, 1
- Salim et al. (2007) Salim, S., Rich, R. M., Charlot, S., et al. 2007, ApJS, 173, 267
- Sánchez-Blázquez et al. (2006) Sánchez-Blázquez, P., Peletier, R. F., Jiménez-Vicente, J., et al. 2006, MNRAS, 371, 703
- Schawinski et al. (2009) Schawinski, K., Lintott, C. J., Thomas, D., et al. 2009, ApJ, 690, 1672
- Schawinski et al. (2014) Schawinski, K., Urry, C. M., Simmons, B. D., et al. 2014, MNRAS, 440, 889
- Schlegel et al. (1998) Schlegel, D. J., Finkbeiner, D. P., & Davis, M. 1998, ApJ, 500, 525
- Seaton (1979) Seaton, M. J. 1979, MNRAS, 187, 73P
- Sellwood (1981) Sellwood, J. A. 1981, A&A, 99, 362
- Sellwood & Moore (1999) Sellwood, J. A. & Moore, E. M. 1999, ApJ, 510, 125
- Shen & Sellwood (2004) Shen, J. & Sellwood, J. A. 2004, ApJ, 604, 614
- Shen et al. (2003) Shen, S., Mo, H. J., White, S. D. M., et al. 2003, MNRAS, 343, 978
- Sheth et al. (2008) Sheth, K., Elmegreen, D. M., Elmegreen, B. G., et al. 2008, ApJ, 675, 1141
- Sheth et al. (2005) Sheth, K., Vogel, S. N., Regan, M. W., Thornley, M. D., & Teuben, P. J. 2005, ApJ, 632, 217
- Shlosman et al. (1989) Shlosman, I., Frank, J., & Begelman, M. C. 1989, Nature, 338, 45
- Smee et al. (2013) Smee, S. A., Gunn, J. E., Uomoto, A., et al. 2013, AJ, 146, 32
- Smethurst et al. (2017) Smethurst, R. J., Lintott, C. J., Bamford, S. P., et al. 2017, MNRAS, 469, 3670
- Smethurst et al. (2016) Smethurst, R. J., Lintott, C. J., Simmons, B. D., et al. 2016, MNRAS, 463, 2986
- Smethurst et al. (2015) Smethurst, R. J., Lintott, C. J., Simmons, B. D., et al. 2015, MNRAS, 450, 435
- Sobral et al. (2014) Sobral, D., Best, P. N., Smail, I., et al. 2014, MNRAS, 437, 3516
- Speagle et al. (2014) Speagle, J. S., Steinhardt, C. L., Capak, P. L., & Silverman, J. D. 2014, ApJS, 214, 15
- Springel et al. (2005a) Springel, V., Di Matteo, T., & Hernquist, L. 2005a, ApJ, 620, L79
- Springel et al. (2005b) Springel, V., Di Matteo, T., & Hernquist, L. 2005b, ApJ, 620, L79
- Straatman et al. (2018) Straatman, C. M. S., van der Wel, A., Bezanson, R., et al. 2018, ApJS, 239, 27
- Strateva et al. (2001) Strateva, I., Ivezić, Ž., Knapp, G. R., et al. 2001, AJ, 122, 1861
- STScI development Team (2013) STScI development Team. 2013, pysynphot: Synthetic photometry software package, Astrophysics Source Code Library
- Tacconi et al. (2010) Tacconi, L. J., Genzel, R., Neri, R., et al. 2010, Nature, 463, 781
- Taylor et al. (2009) Taylor, E. N., Franx, M., van Dokkum, P. G., et al. 2009, ApJ, 694, 1171
- Toomre (1977) Toomre, A. 1977, in Evolution of Galaxies and Stellar Populations, ed. B. M. Tinsley & R. B. G. Larson, D. Campbell, 401
- Trayford et al. (2016) Trayford, J. W., Theuns, T., Bower, R. G., et al. 2016, MNRAS, 460, 3925
- van de Voort et al. (2017) van de Voort, F., Bahé, Y. M., Bower, R. G., et al. 2017, MNRAS, 466, 3460
- van den Bosch et al. (2008) van den Bosch, F. C., Aquino, D., Yang, X., et al. 2008, MNRAS, 387, 79
- van der Wel et al. (2016) van der Wel, A., Noeske, K., Bezanson, R., et al. 2016, ApJS, 223, 29
- Wang et al. (2012) Wang, J., Kauffmann, G., Overzier, R., et al. 2012, MNRAS, 423, 3486
- Wetzel et al. (2013) Wetzel, A. R., Tinker, J. L., Conroy, C., & van den Bosch, F. C. 2013, MNRAS, 432, 336
- Whitaker et al. (2012) Whitaker, K. E., Kriek, M., van Dokkum, P. G., et al. 2012, ApJ, 745, 179
- White (1976) White, S. D. M. 1976, MNRAS, 174, 19
- Wilkinson et al. (2015) Wilkinson, D. M., Maraston, C., Thomas, D., et al. 2015, MNRAS, 449, 328
- Willett et al. (2013) Willett, K. W., Lintott, C. J., Bamford, S. P., et al. 2013, MNRAS, 435, 2835
- Willmer et al. (2006) Willmer, C. N. A., Faber, S. M., Koo, D. C., et al. 2006, ApJ, 647, 853
- Worthey & Ottaviani (1997) Worthey, G. & Ottaviani, D. L. 1997, ApJS, 111, 377
- Wyder et al. (2007) Wyder, T. K., Martin, D. C., Schiminovich, D., et al. 2007, ApJS, 173, 293
- Yan et al. (2016) Yan, R., Bundy, K., Law, D. R., et al. 2016, AJ, 152, 197
- York et al. (2000) York, D. G., Adelman, J., Anderson, Jr., J. E., et al. 2000, AJ, 120, 1579
- Zolotov et al. (2015) Zolotov, A., Dekel, A., Mandelker, N., et al. 2015, MNRAS, 450, 2327