Detection of white dwarf spin period variability in the intermediate polar V2306 Cygni
Abstract
Magnetic cataclysmic variables are close binaries which consist of a compact object – a white dwarf – and a red dwarf filling its Roche Lobe. Such systems are physical laboratories which enable study of the influence of magnetic fields on matter flows. They often exhibit spin-up or spin-down of the white dwarf, while some systems exhibit more complex behaviour of the spin period change. We monitor changes of the spin periods of white dwarfs in a sample of close binary systems to study interaction of the magnetic field and accretion processes as well as evolution of intermediate polars. Within the framework of our intermediate polar monitoring program, we obtained photometric CCD observations at several observatories. Two-period trigonometric polynomial fitting was used for determination of extrema timings. The (O-C) analysis was performed to study the variability of the orbital and spin periods of the systems. Using data taken during 9 years of observations of the magnetic cataclysmic variable V2306 Cygni (formerly known as 1WGA J1958.2+3232), we detected the spin period variability which shows a spin-up of the white dwarf with a characteristic time of years. The value of the spin period was seconds with the formal accuracy of seconds. We derived an improved value of the orbital period of the system to be hours.
keywords:
stars: individual: V2306 Cyg – stars: novae, cataclysmic variables – stars: binaries: close – stars: magnetic field1 Introduction
Intermediate polars, often called DQ Her type stars, are close binary systems consisting of a magnetic white dwarf and a main-sequence star filling the Roche lobe. The gravity of the primary component leads to capture of matter from the secondary component near the inner Lagrangian point. Due to the high angular momentum of the plasma leaving the Lagrangian point, the stream can not be accreted directly by the compact star, and instead it forms an accretion disk around the white dwarf, see e.g. Lubow & Shu (1975).
The magnetic field of the primary is strong enough to destroy the inner part of the accretion disk and matter is being accreted along the magnetic field lines, leading to the formation of one or two accretion columns near the magnetic poles. The matter forms a shock wave, heats up, and eventually settles down on the surface of the white dwarf. The accretion columns in such systems are often the brightest sources of polarized radiation in a wide spectral range from X-ray to radio. Rare outbursts have also been observed, e.g. Hellier, Harmer & Beardmore (2004) and Andronov et al. (2008).
Usually intermediate polars show two types of optical variability. The orbital variability is caused by the rotation of the system. During its revolution, we see the stars, an accretion disk and a hot spot at different angles. The orbital periods of intermediate polars are usually about 3–7 hours, see Table 1 and Fig. 11 from review paper by Patterson (2002). The spin variability is caused by the rotation of the white dwarf with one or two accretion columns, with the periods ranging from few to dozens of minutes. Therefore, the light curve is frequently a superposition of 2 different periodic variations and some aperiodic processes like flickering or outbursts, leading to changes between high and low luminosity states.
The pulsating X-ray source 1WGAJ1958.2+3232 was discovered by Israel et al. (1998). In 2003, it was assigned the variable star designation V2306 Cyg. The authors discussed the nature of pulsations with a period of 12 minutes and concluded that the source may be either a low-luminosity X-ray pulsar or an intermediate polar. Negueruela, Reig & Clark (2000) classified it as an intermediate polar based on its X-ray and optical properties. They noticed the double-peaked shape of the Balmer emission lines, indicating the presence of an accretion disk. Uslenghi et al. (2000) suggested that the true white dwarf spin period could be twice that published earlier by Israel et al. (1999) and mentioned that this object is one of the slowest rotators showing a double-peaked spin profile.
Zharikov et al. (2001) derived an orbital period of (4h 36m) based on the photometric data and a somewhat higher value of from the radial velocity curve. They confirmed the ()s white dwarf spin period both from spectroscopy and photometry. They argued for the presence of an accretion disk and the existence of a hot spot on it based on examination of the radial velocity curves, the light curve and the results of Doppler tomography. Uslenghi et al. (2001) reported variations of circular polarization with a period twice as long () as the previously published white dwarf spin.
Norton et al. (2002) suggested that the orbital period was () hours, however this value corresponds to the day alias of the period value published by Zharikov et al. (2001). They also confirmed that the rotational period of the white dwarf is twice as long as the pulse period, indicating that two-pole accretion may be occurring in the system. Zharikov, Tovmassian & Echevarría (2002), using their own data along with those provided by A. SNorton, repeated the analysis and derived a similar result to their previous determination of . However, they mentioned that a longer time base of observations is needed to further improve the measured value of the period.
Breus et al. (2015) analyzed the results of 6 years of photometric monitoring of V2306 Cyg. They were not able to find spin period variations from the (O-C) analysis, but found a regular cycle miscount for the previously published orbital period and a linear trend in the (O-C) diagram. They concluded that an orbital period of better fitted their data. The periodogram analysis revealed a period of days, and they noticed significant changes of mean brightness level from one night to another. This was interpreted as a possible precession of the accretion disk in this system.
The paper is organized as follows: in the next Section we describe the photometric data gathered for V2306 Cyg and the instruments used, and Section 3 presents the methods used for derivation of the high precision period values. In Sections 4 and 5 we describe the results obtained for the orbital and spin periods detected in the light curves of V2306 Cyg. We discuss our findings in the last Section.
2 Observations and data reduction
The first set of photometric data used in this research was obtained with the 60 cm ZeissCassegrain telescope at the Observatory and Planetarium in Hlohovec, Slovakia (ZC600). At this site two instruments were used: in the period 2012-2014 the SBIG ST-9 camera, while the ATIK 383L CCD was attached to this telescope in 2015-2018. In 2014-2016 we gathered photometric observations with the the 50 cm Cassegrain telescope at the Astronomical Observatory of the Jagiellonian University in Krakow, Poland (Zeiss50), equipped with an Andor DZ936 BV camera. Additionally, our analysis includes one run obtained in 2013 by O. R. Baransky with the 70-cm telescope of the Astronomical Observatory of Taras Shevchenko National University in Kiev, Ukraine (AZT-8). This telescope is equipped with a PL47-10 FLI camera and this run was previously analyzed by Breus et al. (2015).
The observation log is listed in Table 1, the total duration of each run is presented in hours. Typically we monitored the target over an entire night.
Most of our data were taken with alternating wide band V and R filters. Some observational runs were taken in BVR or R filters. Exposure times were between 30–60 seconds, adjusted according to weather conditions, instrument and filters used. The overhead time, required for CCD readout and filter changes, was typically a few seconds. The reduction,s consisting of calibration of scientific images for bias, dark and flatfield and extraction of instrumental magnitudes, was carried out with the Muniwin software developed by Motl (2011). We used nearby comparison stars, listed in the AAVSO Variable Star Plotter111https://www.aavso.org/apps/vsp/ database. The chosen primary comparison star is No. 127 marked in the AAVSO chart for all data before 2014 and No. 137 for 2014 and later observations. The comparison stars were found to be constant in our entire data set. The final derivation of magnitudes was obtained using the multiple comparison stars method described by Kim, Andronov & Jeon (2004) and implemented in Multi-Column View by Andronov & Baklanov (2004) (hereafter named MCV).
| From | To | Runs | Duration | Telescope |
|---|---|---|---|---|
| 08.07.2012 | 16.07.2012 | 3 | 11.46 | ZC600 |
| 27.07.2013 | 28.07.2013 | 2 | 9.04 | ZC600 |
| 19.08.2013 | 19.08.2013 | 1 | 3.36 | AZT-8 |
| 19.05.2014 | 19.05.2014 | 1 | 5.63 | Zeiss50 |
| 09.06.2014 | 30.06.2014 | 4 | 16.94 | ZC600 |
| 11.05.2015 | 01.06.2015 | 5 | 17.60 | Zeiss50 |
| 08.06.2015 | 12.07.2015 | 6 | 20.05 | ZC600 |
| 28.06.2016 | 10.07.2016 | 4 | 16.04 | Zeiss50 |
| 24.06.2017 | 26.07.2017 | 6 | 17.31 | ZC600 |
| 09.06.2018 | 30.07.2018 | 7 | 18.07 | ZC600 |
Data were grouped by seasons. ‘Number of runs’ means the number of nights when the object was observed and total duration is given in hours.
Along with our own data we also included in the analysis all CCD observations spanning more than a few hours published in the AAVSO database. Barycentric corrections was applied to all geocentric Julian dates.
3 O-C Analysis
To determine spin maxima and orbital minima timings we used the trigonometric polynomial approximation of the light curve implemented in MCV applied for each filter separately. We choose a 2-periodic model for smoothing in the form:
| (1) |
where is the smoothed value of brightness at time , is the average brightness of theoretical curve (generally different from the sample mean, see Andronov (2003). , is the semi-amplitude, and is the epoch for maxima of brightness of photometric wave with number and period . This method has been previously widely used for approximation of observations of intermediate polars (see Kim et al. (2005), Andronov & Breus (2013)).
As mentioned above, the orbital periods of intermediate polars are within the range between 3–7 hours. Due to the different length of nights across the year and atmospheric conditions, it was not always possible to cover the entire orbital period during one night. Only when an orbital minimum was well covered was it possible to use minima timings derived from trigonometric polynomial fits for the (O-C) analysis.
In the opposite case, when we measured only that part of the light curve between minimum and maximum, or in the case of short runs, we were unable to determine the timing from such data with adequate precision. Therefore, to proceed with the (O-C) analysis of orbital variability we derived a synthetic minimum time from the combined data taken over a few nights or one minimum per season. With this approach we significantly increased the accuracy of timings. Spin periods of intermediate polars are short, usually between 12–20 minutes. Therefore, we took one average spin maximum per night. The accuracy estimate of the value derived in this way is much better than for individual extrema. Furthermore, to increase the accuracy of the spin maxima timing, in this analysis we have also merged a few nights.
Instead of the typical representation of the (O-C) diagram being a function of the extrema timings and the cycle number , calculated from an ephemeris in the following form:
| (2) |
we have used the dependence of phase, i.e. , with time or cycle number. For a correct ephemeris, the phases should be concentrated near the zero value. A linear trend in the (O-C) diagram would correspond to a shift of observed extrema timings relative to the calculated values due to the inaccurate value of the period. A parabolic trend would indicate changes of period with time, while strictly periodic changes seen in the (O-C) diagram usually indicate the presence of a third body in the system.
4 Improvement of the orbital period
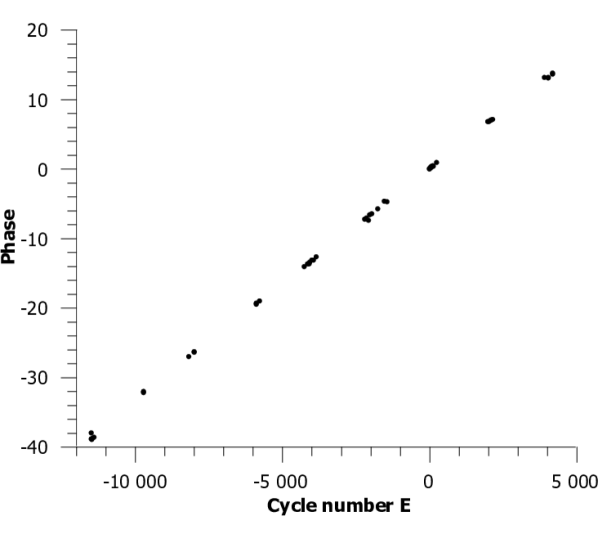
Using all minima timings, we calculated the (O-C) diagram using an initial value of the orbital period of (taken from the previous work by Breus et al. (2015)) and an initial epoch of , determined for the night where the formal error estimate was smallest. It turned out that the cycle miscount was significant and required correction. Subsequently, we determined the statistically optimal linear weighted fit to the (O-C) (see Fig. 1). As a result, we obtained a more accurate value of the orbital period .
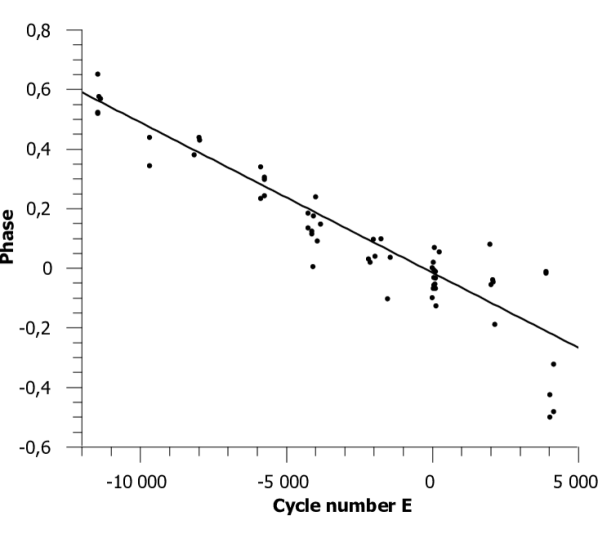
With this new value, we repeated the calculation of orbital minima and the O-C analysis. The list of minima timings is available online. A second (O-C) diagram (see Fig. 2) has an amplitude of about 1 full period during all 9 years of monitoring and again we used a linear weighted fit to the (O-C). This resulted in an improved period value of . After the third iteration the amplitude of the (O-C) diagram decreased to of Porb, and most points fall in a band with width Porb from the zero line. We consider this orbital period value to be the most accurate and describing the analysed data best. The new determination has a formal statistical accuracy about 3 orders of magnitude smaller then that determined by Zharikov, Tovmassian & Echevarría (2002) and a order of magnitude smaller then our previous result (see Breus et al. (2015)). We found no periodic variations of the orbital period.
5 Spin period variability
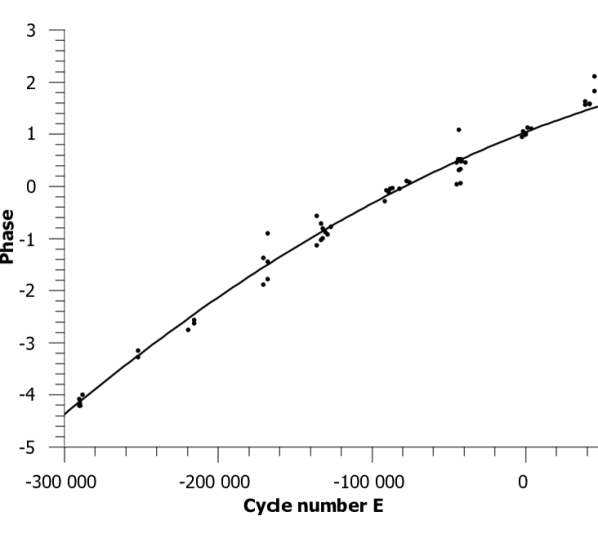
Due to the similar shape of humps seen in the light curve, we used half of the spin period and an initial epoch of to determine spin maxima timings (a table is available in the online version). The (O-C) diagram calculated for these data shows a regular cycle miscount of about cycles per year. We introduced a correction to account for this miscount, presented in Fig. 3, and performed computations to derive best fits to the (O-C) diagram. We consider a cubic fit not justified, as the coefficient is about of its error estimate. Our next trial was a quadratic weighted polynomial fit in the form:
| (3) |
Here is an integer cycle number close to mean time of observations and the quadratic term reaches . This fit may correspond to the current value of the half of the spin period of and characteristic time of change of spin period:
| (4) |
6 Conclusions
From the analysis of observations gathered during 9 years of photometric monitoring of the intermediate polar V2306 Cygni, we discovered its white dwarf spin period variability. The characteristic spin-up time is years and this value is the same both for the spin period and the twice shorter pulse period. The value of for the spin period (twice larger than the value obtained for the pulse period) has an order typical of intermediate polars.
For the epoch of 2017, we derived the white dwarf rotation rate value of seconds, with a formal accuracy of seconds. This is consistent with that determined by Norton et al. (2002) ( seconds), however, our determination based on a longer span of data is more accurate. From the (O-C) analysis we improved the value of the orbital period of V2306 Cyg resulting in a value of hours.
Spin period variations are frequently observed in intermediate polars and are typically detectable on a timescale of decades (see e.g. Andronov et al. (2017)). Some intermediate polars show a constant decrease (e.g. EX Hya, Andronov & Breus (2013), BG CMi, Kim, Andronov & Jeon (2004)), while others exhibit an increase of their white dwarfs’ rotation rates (PQ Gem, V1223 Sgr, AE Aqr mentioned by Norton et al. (2002)). Even more complicated period changes, an increase followed by a decrease of rotation periods, were detected during observations covering a couple of decades (e.g. FO Aqr, Breus et al. (2012) and V405 Aur, Breus et al. (in preparation)). On the other hand, V1323 Her does not show a statistically significant spin period change (see Petrik et al. (2015)).
de Miguel et al. (2017) compiled published spin-up rates for intermediate polars. Among 16 objects listed there, V2306 Cyg has one of the longest orbital and spin periods. The value of for this object, along with orbital and spin periods, resemble the properties of FO Aqr - "The King of Intermediate Polars", which exhibited at least three low states during recent years (Kennedy et al. (2017), Littlefield et al. (2018)).
The variations of the white dwarf rotation rates in intermediate polars can be caused by a change of angular momentum of the white dwarf due to accretion, precession of the rotation axis of the magnetic white dwarf (see Andronov (2005) and Tovmassian, Zharikov & Neustroev (2007)) or the presence of a third body in the system.
Acknowledgements
We acknowledge with thanks the variable star observations from the AAVSO International Database (https://www.aavso.org/) contributed by observers worldwide and used in this research and personally William Goff, James Jones, Joseph Ulowetz, David Boyd, Michael Cook, Richard Sabo, Donald Collins, Lewis Cook and Etienne Morelle. We thank prof. Ivan L. Andronov for helpful discussions on this paper, Olexander Baransky for providing his observations and Greg Stachowski for language corrections.
References
- Andronov (2003) Andronov I. L. 2003, ASP Conf. Ser. 292, 391
- Andronov (2005) Andronov I. L. 2005, ASP Conf. Ser. 334, 447
- Andronov & Baklanov (2004) Andronov I. L. & Baklanov A. V. 2004, Astron. School Reports 5, 264
- Andronov et al. (2008) Andronov I. L. & Chinarova L. L. & Han W. & Kim Y. & Yoon J.-N. 2008, A&A, 486, Issue 3, 855-865
- Andronov, Breus & Zola (2012) Andronov I.L. & Breus V.V. & Zoła S., 2012, Odessa Astron. Publ., 25, 150.
- Andronov & Breus (2013) Andronov I. L. & Breus V. V. 2013, Astrophysics. 56, 4, 518-530
- Andronov et al. (2017) Andronov, I. L. et al. 2017, in ASP Conf. Ser. 511, Non-Stable Universe: Energetic Resources, Activity Phenomena and Evolutionary Processes, ed. A. M. Mickaelian, H. A. Harutyunian, and E. H. Nikoghosyan, 43
- Breus et al. (2012) Breus V. & Andronov I.L. & Hegedus T. & Dubovsky P.A. & Kudzej I. 2012, Advances in Astronomy and Space Physics, 2, 9.
- Breus et al. (2015) Breus V. & Petrik K. & Zola S. & Baransky A. & Hegedus T. 2015, Advances in Astronomy and Space Physics, 5, 17-20
- de Miguel et al. (2017) de Miguel, E. & Patterson, J. & Jones, J. L. & Morelle, E. & Boyd, D. R. S. & Stein, W. & Koff, R. & Krajci, T. et al. 2017, MNRAS, 467, 428-437
- Hellier, Harmer & Beardmore (2004) Hellier C. & Harmer S. & Beardmore A. 2004, MNRAS, 349, 2, 710-714
- Israel et al. (1998) Israel G. L. et al. 1998, MNRAS, 298, 2, 502-506
- Israel et al. (1999) Israel G. L. et al. 1999, Astron. Astrophys., 345, L1-L4
- Kennedy et al. (2017) Kennedy M. R. & Garnavich P. M. & Littlefield C. & Callanan P. & Mukai K. & Aadland E. & Kotze M. M. & Kotze, E. J. 2017, MNRAS, 469, 1, 956-967.
- Kim, Andronov & Jeon (2004) Kim Y. & Andronov I. L. & Jeon Y. 2004, Journal of Astronomy and Space Sciences. 21, 3, 191-200
- Kim et al. (2005) Kim Y. & Andronov I. L. & Park S. & Chinarova L. L. & Baklanov A. V. & Jeon Y. B. 2005, Journal of Astronomy and Space Sciences 22, 3, 197-210
- Littlefield et al. (2018) Littlefield C. & Stiller R. & Hambsch F. & Shappee B. & Holoien T. & Garnavich P. & Kennedy M., 2018, The Astronomer’s Telegram, 11844
- Lubow & Shu (1975) Lubow S. H. & Shu F. H. 1975, Astrophysical Journal, 198, 383-405
- Motl (2011) Motl D. C-Munipack project. 2011, http://c-munipack.sourceforge.net/
- Negueruela, Reig & Clark (2000) Negueruela I. & Reig P. & Clark J. S. 2000, A&A, 354, L29-L32
- Norton et al. (2002) Norton A. J. & Quaintrell H. & Katajainen S. & Lehto H. J. & Mukai K. & Negueruela I. 2002, A&A, 384, 195-205
- Patterson (2002) Patterson J. 1994, PASP, 106, 209-238
- Petrik et al. (2015) Petrik, K.,& Breus, V. V.,& Andronov, I. L.,& Csataryova, M.,& Drga, J.,& Hegedus, T.,& Zola, S.,& Chinarova, L. L.,& Kim, Y. H.,& Park, J.,& Yoon, J.-N.,& Dubovsky, P.,& Kolesnikov, S. V.,& Antonyuk, K. A. 2015, in ASP Conf. Ser. 496, Living Together: Planets, Host Stars and Binaries, ed. S. M. Rucinski, G. Torres, and M. Zejda, 252
- Tovmassian, Zharikov & Neustroev (2007) Tovmassian G. H. & Zharikov S. V. & Neustroev V. V. 2007, ASP Conf. Ser. 372, 541
- Uslenghi et al. (2000) Uslenghi M. & Bergamini P. & Catalano S. & Tommasi L. & Treves A. 2000, A&A, 359, 639-645
- Uslenghi et al. (2001) Uslenghi M. & Tommasi L. & Treves A. & Piirola V. & Reig P. 2001, A&A, 372, L1-L4
- Zharikov et al. (2001) Zharikov S. V. & Tovmassian G. H. & Echevarría J. & Cárdenas A. A. 2001, A&A, 366, 834-839
- Zharikov, Tovmassian & Echevarría (2002) Zharikov S. V. & Tovmassian G. H. & Echevarría J. 2002, A&A, 390, L23-L26
Appendix A Supporting Information
Supplementary data are available online at http://uavso.org.ua/data/v2306cyg/. v2306cyg-orbital.txt contains the list of orbital minima timings. v2306cyg-spin.txt contains the list of spin maxima timings. Both are tab-separated text files, the columns are BJD, error estimate, telescope and AAVSO observer code (see Section 2).