Dark Matter and HI in Ultra-Diffuse Galaxy UGC 2162
Abstract
Our GMRT H i observations of the ultra diffuse galaxy (UDG) UGC 2162, projected 300 kpc from the centre of the M 77 group, reveal it to a have an extended H i disk (R 3.3) with a moderate rotational velocity (V 31 km s-1). This Vrot is in line with that of dwarf galaxies with similar H i mass. We estimate an Mdyn of 1.14 109 M⊙ within the galaxy’s RHI 5.2 kpc. Additionally, our estimates of M200 for the galaxy from NFW models are in the range of 5.0 to 8.8 1010 M⊙. Comparing UGC 2162 to samples of UDGs with H i detections show it to have amongst the smallest Re with its MH i/M∗ being distinctly higher and g – i colour slightly bluer than typical values in those samples. We also compared H i and dark matter (DM) halo properties of UGC 2162 with dwarf galaxies in the LITTLE THINGS sample and find its DM halo mass and profile are within the range expected for a dwarf galaxy. While we were unable to to determine the origin of the galaxy’s present day optical form from our study, its normal H i rotation velocity in relation to its H i mass, H i morphology, environment and dwarf mass DM halo ruled out some of the proposed ultra diffuse galaxy formation scenarios for this galaxy.
keywords:
galaxies: ISM - galaxies: interactions - galaxies: kinematics and dynamics - galaxies: individual: UGC 2162 - radio lines: galaxies1 Introduction
Since the discovery of forty seven ultra diffuse galaxies (UDG) in the Coma cluster by van Dokkum et al. (2015a), there have been several further reports of many more UDGs, mostly in galaxy clusters (e.g., Yagi et al., 2016; Wittmann et al., 2017; Toloba et al., 2018). UDGs have M∗ of 107 to 108 M⊙, a central g – band surface brightness () of 24 mag arcsec-2 and an effective radius 111The effective radius of a galaxy is the radius at which half of the total light of the system is emitted. () of 1.5 – 5 kpc. UDGs are found in a range of environments from clusters and groups to in isolation, with their relative abundance increasing from the field to the centres of massive galaxy clusters (van der Burg et al., 2017). This implies a significant role for environment in the evolution at least some of them (Carleton et al., 2019). UDGs also display a wide range of properties from spheroids with red g – i colours ( 0.8) to irregulars with blue blue g – i colours ( 0.3) (Trujillo et al., 2017). While faint, extended, low surface brightness galaxies are not a recent discovery, the Coma UDGs revealed for the first time their relative ubiquity in a dense environment. Moreover, compared to classical LSBs, the Coma UDGs were fainter and often more extended (Yagi et al., 2016; van der Burg et al., 2017).
Despite the relatively large number of reported UDGs, little is known about their properties and formation scenario(s). Currently some of the principal ideas put forward to explain UDG formation are: (1) galaxies with higher than average angular momentum and low star formation (Amorisco & Loeb, 2016) (2) failed massive galaxies where either the environment or strong stellar feedback have supressed star formation (SF) (van Dokkum et al., 2016; Di Cintio et al., 2017) (3) a subset of classical LSBs or are a class of dwarf galaxies following an evolutionary sequence from field to cluster as suggested by Yozin & Bekki (2015); Román & Trujillo (2017); Carleton et al. (2019), i.e., normal dwarfs spirals which have been converted to UDGs by an environmentally aided process/processes (e.g., star formation (SF) quenching, tidal heating, tidal stripping or ram pressure).
In this paper we present resolved Giant Metrewave Radio Telescope (GMRT) H i observations of UGC 2162, a UDG with 24.4 mag asec-2, 1.7 kpc and a g – i colour of 0.330.02 (Trujillo et al., 2017). Table 1 gives a summary of the galaxy’s properties. Trujillo et al. (2017) showed that the stellar component of the galaxy consists of a elongated blue star forming region within a more extensive region of low surface brightness stellar emission. Using a redshift independent distance of 12.31.7 Mpc for UGC 2162 it is claimed to be the nearest UDG (Trujillo et al., 2017), making it an excellent candidate for a resolved H i study. Being located in the IAC stripe82 Legacy Survey region, the galaxy has deep optical images. UGC 2162 is a member of the M 77 group and is projected 294 kpc from the group’s centre. The nearest group member to UGC 2162 with comparable or greater stellar mass is SDSS J023848.50+003114.2 which is projected 48.7 arcmin ( 175 kpc) away and separated in velocity by 277 km s-1.
Section 2 gives details of the GMRT observations, with observational results in section 3. A discussion follows in section 4 with a summary and concluding remarks in section 5. In this paper we adopt the redshift to UGC 2162 of 0.00392 and distance to the galaxy of 12.3 Mpc from Trujillo et al. (2017). We also adopt their angular scale of 1 arcmin 3.6 kpc. All and positions referred to throughout this paper are J2000.0.
| Property222From NED | Units | Value | |
|---|---|---|---|
| Vradial(optical)333From Hyperleda | [km s-1] | 11856 | |
| RA | [h:m:s] | 02:40:23.09 | |
| DEC | [d:m:s] | +01:13:45.3 | |
| Distance444See section 1. | [Mpc] | 12.3 1.7 | |
| 555From Trujillo et al. (2017). | [kpc] | 1.70.2 | |
| (0)666From Trujillo et al. (2017). | [mag arcsec2] | 24.40.1 | |
| D25 major axis | [arcsec] | 52 | |
| D25 major axis | [kpc] | 3.2 | |
| Inclination777From BBarolo fit to medium resolution GMRT H i cube. | [∘] | 55 | |
| Morphology | UDG | ||
| 12+log(O/H)888For the bightest SF knot from a SDSS spectrum Trujillo et al. (2017). | 8.22 0.07 | ||
| 999From Trujillo et al. (2017). | [107 M⊙] | 22 | |
| MHI | [107 M⊙] | 18 |
2 Observations
UGC 2162 was observed at 21 cm using the GMRT on the 8th March, 2018 and the observational parameters are detailed in Table 2. The GMRT data was analysed using the standard reduction procedures with the Astronomical Image Processing System (aips) software package. The flux densities are on the scale of Baars et al. (1977), with uncertainties of 5%. After calibration and continuum subtraction in the uv domain the aips task imagr was used to convert the uv domain data to H i image cubes. Finally integrated H i, velocity field and velocity dispersion maps were extracted from the image cubes using the aips task momnt. To study the H i distribution in detail, image cubes with different resolutions were produced by applying different‘tapers’ to the data with varying uv limits. Details of the final low, medium and high resolution maps are given in Table 2.
| Rest frequency | 1420.4057 MHz |
|---|---|
| Observation Date | 8th March, 2018 |
| Integration time | 10.0 hrs |
| primary beam | 24′ at 1420.4057 MHz |
| Low resolution beam–FWHP | 43.3′′ 39.3′′, PA = 13.4∘ |
| Medium resolution beam–FWHP | 30.7′′ 28.8′′, PA = – 4.5∘ |
| High resolution beam–FWHP | 16.9′′ 12.9′′, PA = 31.7∘ |
| RA (pointing centre) | 02h 40m 23.10s |
| DEC (pointing centre) | 01∘ 13′ 45.01′′ |
3 Observational Results
3.1 H i morphology and H i mass
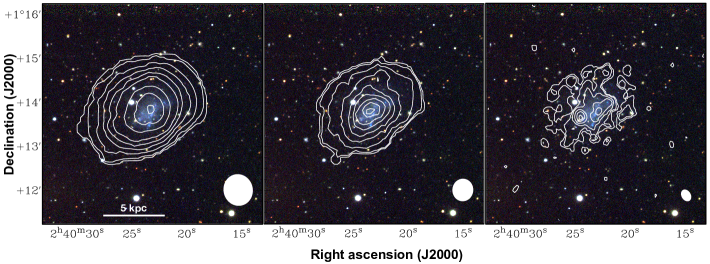
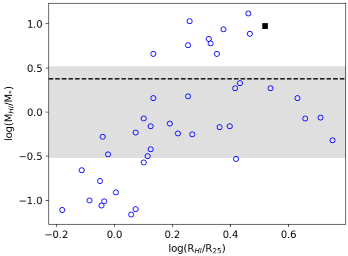
Our UGC 2162 total intensity H i maps at low, medium and high angular resolution are shown in Figure 1, with the beam size and PA for each resolution given in Table 2 and indicated with white ellipses on the maps. At the distance of 12.3 Mpc, the low, medium and high resolution full width half power (FWHP) beams sample the galaxy’s H i disc at 2.6 kpc, 1.8 kpc and 1.0 kpc respectively. While the two lower resolution maps show regular H i morphology, the high resolution map reveals sub-structure, with the two principal H i maxima in that map having column densities of 1.0 to 1.2 1021 atoms cm-2. Overall the outer H i disk morphology at all three resolutions is rather symmetric and shows no signs of extended tails or diffuse edge structures that would signify a recent interaction. From the low resolution H i map’s major axis we estimate the RHI 86 arcsec (5.2 kpc), compared to the R25 = 26 arcsec (1.6 kpc) from Trujillo et al. (2017). Its RHI/R25 is therefore 3.3, i.e. almost twice the RHI/R25 of 1.8 typical of late–type galaxies (Broeils & Rhee, 1997). Comparing the UGC 2162 RHI/R25 to the morphologically unclassified Local Volume H i Survey (LVHIS Wang et al., 2017; Koribalski et al., 2018) sample (limited to galaxies with M∗ 1 108 M⊙), see Figure 3, indicates UGC 2162 lies within the upper range of RHI/R25 for observed galaxies with M∗ 1 108 M⊙. We note that the faint, patchy optical disk revealed by the deep g, r, i IAC Stripe82 composite image, Figure 1 in Trujillo et al. (2017), extends to a radius of 60 arcsec (3.6 kpc), i.e. more than twice the R25.
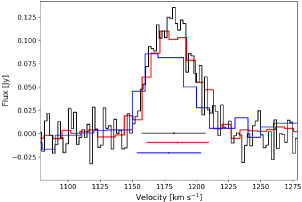
In Table 3 and Figure 2 we compare the properties of the integrated GMRT H i spectrum with those from the 42m Green Bank Telescope (GBT, Springob et al., 2005) and Parkes Telescope Multibeam (HIPASS Meyer et al., 2004) single dish spectra. Both the VHI and W20 derived from the three radio telescopes are in agreement within their uncertainties. While we believe our measurement of the W20 from HIPASS spectrum is correct, Meyer et al. (2004) reported the W20 from the HIPASS spectrum as 89 km s-1 and this is discussed in Section 4.1. The H i flux recovered by the GMRT interferometric observation (SHI = 4.5 Jy km/s) is in good agreement the GBT absorption corrected flux (SHI = 5.1 Jy km/s). Because it has the best signal to noise ratio (S/N) of the available spectra, we use the GBT flux to estimate the galaxy’s H i mass. This gives a MHI = 1.8 108 M⊙ for the galaxy.
| Telescope | Velocity101010Velocity = VHI except for ’Optical’ which is the optical velocity from NED. | W20111111Our measurement from the GBT and HIPASS spectra. | Channel width | (S)/N | SHI |
|---|---|---|---|---|---|
| km s-1 | km s-1 | km s-1 | Jy km/s | ||
| GMRT121212From the GMRT mid-resolution cube. | 11852 | 495 | 6.9 | 5.6 | 4.5 |
| GBT | 11821 | 502 | 2.1 | 8.7 | 5.1131313Self-absorption corrected, integrated flux density from (Springob et al., 2005). |
| HIPASS | 11782 | 534 | 13.4 | 6.4 | 5.4141414From (Meyer et al., 2004). |
| Optical | 11856 |
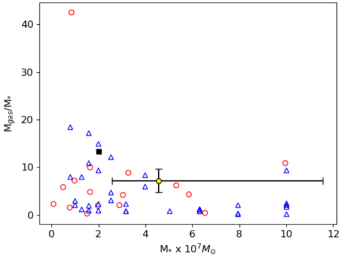
From the IAC Stripe82 deep observations (Trujillo et al., 2017) estimated the UGC 2162 g – band optical diameter D25 52 arcsec (3.2 kpc). Using this optical diameter, the log(MHI/) value for UGC 2162 is 7.24. The average value of log(MHI/) for galaxies of similar morphological type is 6.87 0.17 (Haynes & Giovanelli, 1984), indicating UGC 2162 is H i rich compared to other galaxies of similar size and morphological type. This conclusion is confirmed in Figure 4 which shows Mgas/M∗ compared to M∗ for UGC 2162, the LITTLE THINGS sample of dwarf galaxies151515for which M∗ values available (Oh et al., 2015) and the morphologically unclassified LVHIS sample for galaxies, but limited to members of both samples with M∗ 1 108 M⊙. For consistency with LITTLE THINGS, Mgas for UGC 2162 and LVHIS = 1.4 MHI, with the additional factor to account for molecular gas (0.04) and He (0.36). The figure shows that the Mgas/M∗ ratio for UGC 2162 is 13.3, which is almost a factor of three higher than the median Mgas/M∗ ratio for the LITTLE THINGS dwarfs of 4.7 and the mean of 4.65.0 for LVHIS. The LITTLE THINGS outlier with Mgas/M∗ 40 is the well known super gas rich dwarf DDO154. Figure 4 also shows the mean Mgas/M∗ ratio161616Mgas =MHI 1.4 (7.18) from the 21 UDGs in the NIHAO simulation (Di Cintio et al., 2017). From the figure we see that the UGC 2162 Mgas/M∗ ratio is higher than the mean of the simulated UDGs. (see also Figure 3). Overall our analysis suggests that UGC 2162 falls within the ranges of RHI/R25 and MHI/M∗ observed in galaxies with similar M∗ in the THINGS and LVHIS samples, but displays amongst the highest Mgas/M∗ ratios in its M∗ range.
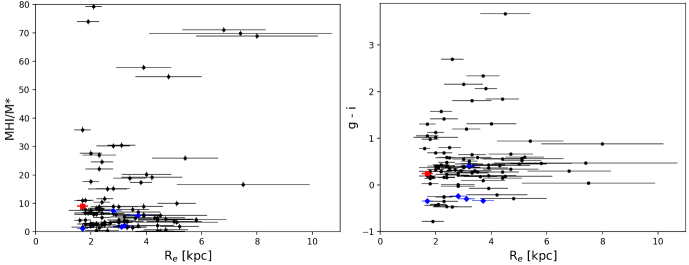
Figure 5 compares the MH i/M∗ v Re and g–i color v Re for UGC 2162 with those from samples of UDGs with H i single dish detections in ALFALFA (Leisman et al., 2017) and H i mapping (Spekkens & Karunakaran, 2018). MH i/M∗ for UGC 2162 and the Spekkens sample was calculated using M∗ from (Trujillo et al., 2017) and Spekkens & Karunakaran (2018) respectively. M∗ was calculated for the Leisman171717The full sample contained 115 UDGs but the we excluded 19 UDGs with MH i/M∗$ 80. The 19 excluded UDGs are outliers in terms of MH i/M∗ with g band magnitudes in most cases 21. These galaxies were excluded because the extreme MH i/M∗ raised questions about the reliability of their SDSS photometry for determining M∗. sample using SDSS model magntudes (g and i band) and parameters from Bell et al. (2003) and Blanton et al. (2003). Additionally, we calculated the SDSS g – i colours for all galaxies from their SDSS model magnitudes, although the UGC 2162 magnitudes were from Trujillo et al. (2017). Magnitudes used for calculating the g – i colours and M∗ for the Leisman sample were corrected for galactic extinction using the Schlafly & Finkbeiner (2011) values from NED extinction calculator. From Figure 5 we see that UGC 2162 has amongst the smallest Re of the UDGs with H i detections. However, its MH i/M∗ of 9.0 while not as extreme as some Leisman UDGs is above that samples typical value. On the other hand UGC 2162’s g – i colour181818Corrected for galaxtic extinction. (0.243) is slightly bluer than most of the Leisman sample, which probably reflects the current enhancement in SFR noted by Trujillo et al. (2017). The H i rich nature of UGC 2162 is also confirmed in comparisison with the simulated UDGs from Di Cintio et al. (2017), see Figure 4. This figure shows UGC 2162 to have a smaller Re and be gas rich compared to an average simulated Di Cintio et al. (2017) UDG.
3.2 H i kinematics
Figure 6 summarises the results from our analysis of UGC 2162 H i kinematics. The upper panel of Figure 6 shows the H i velocity field from medium resolution cube (30.7” 28.9” beam), which has the characteristics of a rotating disc with a moderate rotation velocity and a signature of a warp in the SE. The black contours at the centre of this panel are the two highest H i column density contours from the medium resolution total intensity H i map. These H i contours coincide with the kinematic centre as well as the optical centre of the galaxy. The velocity field of UGC 2162 show no significant sign of recent major interaction. The position velocity (PV) diagram for a slice taken along the H i major axis, position angle (PA) = 307 ∘, is shown in the middle panel of Figure 6 and confirms a rotating disc. A small mass of low density extra-planar H i is seen 15 - 20 arcsec ( 1 kpc) SE of the kinematic centre in the PV diagram. The lower panel of Figure 6 shows the rotation curve extracted from bbarolo (Di Teodoro & Fraternali, 2015) fit to the medium resolution cube. The figure shows a slowly rising rotation curve which is a common feature for dwarf galaxies. The bbarolo best fit gives an inclination of 55.5∘, with Vrot at the outermost fitted ring, r = 67.5 arcsec (4.05 kpc) 25 km s-1. The Mdyn enclosed within each ring fitted with bbarolo is used in section 4.1 to estimate the galaxy’s virial mass (Mvir). We also estimated the Vrot using the H i W20 (adjusted for the inclination from the bbarolo model fit) where Vrot = 0.5 V [km s-1]/sin(i) with V = W20 (50 km s-1) from the GBT spectrum and i = 55.5∘/180. This second method gives Vrot 30.8 km s-1 at the outer edge of the detected H i disk. These values are also used in the section 4.1 analysis.
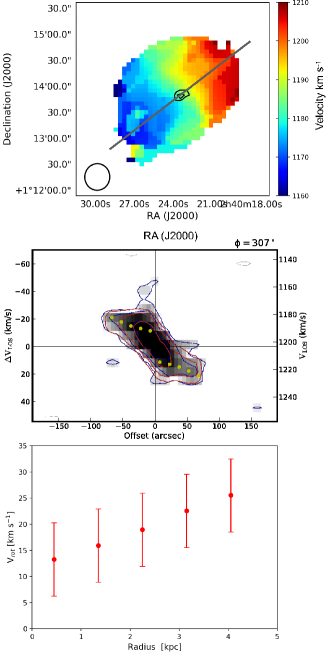
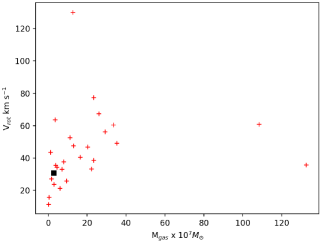
In Figure 7 we compare the Vrot from for UGC 2162 with the Vrot derived from model fits to the VLA H i for the LITTLE THINGS dwarf galaxies by Oh et al. (2015). The plot shows that the UGC 2162 Vrot = 30.8 km s-1, derived from the GBT W20, falls within the range of Vrot for LITTLE THINGS with similar MHI and below the LITTLE THINGS median Vrot of 39.5 km s-1.
A galaxy’s ratio is a measure of the asymmetry in its integrated H i flux density profile (within its W20 velocity range) at velocities above and below the galaxy’s systemic velocity, . Even isolated late–type galaxies display a scatter of ratio, which is well characterised by a half Gaussian, with its mean equal to 1.0 and a 1 dispersion of 0.13. This half Gaussian was obtained from a fit to the distribution of values from a sample of AMIGA191919Analysis of the interstellar Medium of Isolated GAlaxies isolated galaxies (Espada et al., 2011). The value of an deviating by 1 from the mean of that distribution is then 1.13. A study by Scott et al. (2018) indicated that is quite sensitive to recent ( 0.7 Gyr) interactions which impact H i disks. For UGC 2162 = 1.07 0.13, measured from the GBT H i spectrum, which is within the 1 value from the isolated sample. UGC 2162’s H i profile is therefore consistent with a symmetric morphology. Both the H i and the velocity field indicate a relatively unperturbed rotating H i disk which makes it suitable for use in determining the galaxy’s Mdyn and Mvir. Overall UGC 2162’s H i kinematics indicate a moderately rotating disk viewed at an inclination of 55.5∘. A comparison with the LITTLE THINGS sample of dwarf galaxies indicates its Vrot of 30.8 km s-1 falls within the range of Vrot for LITTLE THINGS galaxies with similar MHI, but below the median Vrot for LITTLE THINGS galaxies.
4 Discussion
The main goals of our H i observations of UDGs are to improve knowledge of the nature of their dark matter halos and to constrain UDG formation scenarios. In this section we consider our results for UGC 2162.
4.1 Dark matter halo of UGC 2162
As a key driver of UDG formation and evolution, their DM mass and its distribution has been debated and investigated using models and globular cluster velocity dispersions observations (e.g., van Dokkum et al., 2016; Toloba et al., 2018) as well as single dish H i spectra (e.g. Trujillo et al., 2017; Spekkens & Karunakaran, 2018). Seeing faint UDGs surviving in clusters, van Dokkum et al. (2015a); van Dokkum et al. (2015b) predicted them to be dark matter dominated galaxies. A subsequent velocity dispersion measurement and globular cluster count for DF44 (a Coma cluster UDG, with luminosity Lv 2108 L⊙) indicated a MW size DM halo with Mh 1012 M⊙ (van Dokkum et al., 2016). More recent studies show that, while high dynamical to stellar mass ratios are common in UDGs, e.g. VCC1287, DF17 and 18 Coma UDGs, typically dwarf scale halos are inferred Beasley & Trujillo (2016); Amorisco & Loeb (2016). Zaritsky (2017), using scaling relations, suggested that UDGs may span a range of halo masses between large spirals and dwarf galaxies, though no observations have been carried out to verify these predictions. Additionally, several observational studies of UDGs have used globular cluster velocity dispersions to estimate their DM content (e.g. Beasley et al., 2016; van Dokkum et al., 2018; Toloba et al., 2018). Biases related to the use of globular clusters to determine UDG DM halo masses are discussed in Laporte et al. (2019). However, resolved H i can probe DM halo properties to much larger radii than globular clusters. Therefore, at least for gas rich UDGs H i is better suited to investigating the critical questions of a UDG’s DM mass and its distribution.
The H i rotation curves of massive spiral galaxies are observed to initially rise steeply but quickly become flat and remain flat in the outer regions. In contrast dwarf galaxies’ H i rotation curves are observed to rise more slowly without necessarily flattening out (Di Teodoro & Fraternali, 2015) and this is the trend observed in the UGC 2162 H i rotation curve, see Figure 6. We used the Vrot and radius for each of the 5 model rings fitted by bbarolo to the medium resolution GMRT H i cube together with equation 1 below to calculate the Mdyn enclosed within the radius of each ring:
| (1) |
For UGC 2162 the bbarolo model ring with the largest radius from the H i kinematic centre was at rHI = 67.5 arcsec (4.05 kpc). Using this rings’s H i extent and Vrot = 25.5 km s-1, we estimate the dynamical mass (Mdyn) within the inner 4.05 kpc using equation 1 as 0.6 109 M⊙. Additionally, we calculated Mdyn = 1.14 109 M⊙ enclosed within the RHI 86 arcsec (5.2 kpc), estimated from the low resolution GMRT map and Vrot = 30.8 km s-1 derived in Section 3.2 from the GBT W20. Our Mdyn value (1.14 109 M⊙) enclosed within the 5.2 kpc RHI is only about 25% of the Mdyn = 4.6 109 M⊙ based on a guessed at, but similar, RHI reported in Trujillo et al. (2017). The difference is principally due to their adoption of an inclination corrected Vrot = 64 km s-1 based on a HIPASS W20 = 89 km s-1 from Meyer et al. (2004). The Meyer value is nearly twice the GBT W20 of 50 2 km s-1 we have adopted. But Table 2 shows our re–measurement of the HIPASS W20 is in agreement, within the uncertainties, with both the GBT and GMRT W20 values.
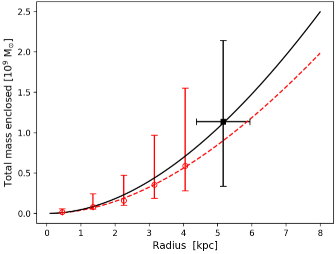
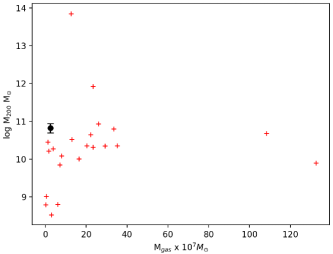
Figure 9 shows, with red open circles, the Mdyn enclosed within the five bbarolo model radii of 7.5", 22.5", 37.5", 52.5" and 67.5" (0.45, 1.35, 2.25, 3.15 and 4.05 kpc) from the H i kinematic centre using equation 1. The Mdyn = 1.14 109 M⊙ enclosed within the RHI (5.2 kpc) is shown in the figure with a black square. The figure also shows Navarro–Frenk–White (NFW) model202020Halotools (Hearin et al., 2017) cumulative masses for DM halos with M200 = 5 1010 M⊙ (red dashed curve) and M200 = 8.8 1010 M⊙ (black solid curve). The respective Vmax from these halo models are 51.1 km s-1 and 64.2 km s-1 with the respective R200s of 228 kpc and 275 kpc. A concentration parameter = 2 was used for both NFW models. The two NFW models fit the Mdyn enclosed within ring radii derived from bbarolo and the low resolution H i map disk edge radius, provide a likely range for the UGC 2162 DM halo properties. Figure 10 shows the infered M200 for UGG 2162 (mean from two NFW halo models) = 6.9 1010 M⊙, which is a factor of three higher than the median M200 (2.1 1010 M⊙) for the LITTLE THINGS dwarf galaxies from model fits carried out by Oh et al. (2015). Additionally, UGC 2162’s rotation curve is consistent with the slowly rising rotation curves observed in dwarf and LSB galaxies (e.g. Oh et al., 2015).
To summarise, we estimate the UGC 2162’s Mdyn is 1.14 109 M⊙ within the RHI (5.2 kpc), derived from the low resolution H i map. Halo model fits to both this and Mdyn derived from bbarolo ring model fits infer M200 in the range 5.0 – 8.8 1010 M⊙, which is slightly higher than the median for LITTLE THINGS galaxies. UGC 2162 also displays a slowly rising H i rotation curve, typical of dwarf galaxies. UDGs encompass a range of different types of galaxies from dark matter dominated (eg. DF44: van Dokkum et al. (2016) to lacking in dark matter (eg. 1052-DF2: Danieli et al. (2019)). In that spectrum of galaxies, a comparison of the physical properties, M200, H i velocity curve profiles and Vrot reported for LITTLE THINGS dwarf galaxies, lead us to conclude that the baryonic component of UGC 2162 is inhabiting a dark matter halo with a mass and profile characteristic of a dwarf galaxy.
4.2 Formation scenario
As noted in Section 1, there are multiple hypotheses in the literature regarding formation of UDGs. It is also not clear if an umbrella term UDG should be used for these galaxies which may be in reality a collection of galaxies of all sizes, morphologies and stages of evolution with the only common factor being their extremely faint central surface brightness. We discuss here possible formation scenarios of the dwarf UDG, UGC 2162.
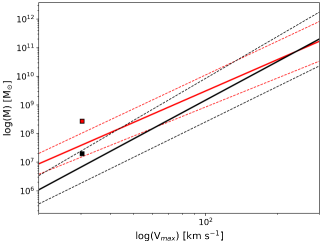
As shown in Figure 4 and described in Section 3.1 the Mgas/M∗ for UGC 2162 is a factor 3 higher than the median ratio for the LIITLE THINGs dwarf galaxies of similar Mgas. We plot in Figure 8 the UGC 2162 bayonic and stellar masses vs Vmax compared to both Baryonic and Stellar Tully–Fisher relations from McGaugh et al. (2000); Torres-Flores et al. (2011). For this plot we made the same assumption about the relation of Mgas to MHI as we did in Section 4.1, i.e. Mgas =1.4 MHI. The plot shows that while UGC 2162’s baryonic mass falls above the upper 1 uncertaintly for Baryonic Tully-Fisher relation (BTFR), its stellar mass is within 1 uncertaintly for the Stellar Tully Fisher relation. No strong conclusion should be drawn based on this as the mass estimates for an individual galaxy usually has large uncertainties. But, this result marginally reinforces the indications that UGC 2162 is gas rich relative to its stellar mass, suggesting that some mechanism has in the past suppressed its SF and star formation effiency (SFE) to much lower levels than its currently elevated star formation rate (SFR) of 0.01 M⊙ yr-1 estimated by Trujillo et al. (2017). Wong et al. (2016) argues that the secular evolution of a combination of disk stability and disk hydrostatic pressure is the primary driver of the observed H i based star formation efficiency (SFEHI). They find angular momentum to have only a secondary effect, concluding that for stable rotating H i disks the scatter in the SFEHI from variation in angular momentum is of the order of a factor of 2. UGC 2612’s SFEHI is a factor of 4 below the average SFEHI of the Wong et al. (2016) HIPASS–selected sample of SF galaxies. This indicates additional mechanisms may have operated over extended periods (Gyrs) to suppress its SFEHI or alternatively it recently acquired a substantial fraction of its current H i mass.
Although UGC 2162 is part of a loose group of galaxies, it is currently fairly isolated with respect to its nearest physical companion of similar or larger mass (SDSS J023848.50+003114.2) projected 175 kpc away. The H i images and kinematics of UGC 2162 show no clear signs of recent major interaction, harassment or environment related effects that could have led to a major gas loss or significantly influence its morphology. On its own the presence of UGC 2162’s H i warp does not necessarily indicate a recent interaction as H i warps are also seen in isolated galaxies which have been free from major tidal interaction for several Gyrs, e.g. (Sengupta et al., 2012; Portas et al., 2011; Scott et al., 2014), where they have been attributed to secular processes and interactions with minor satellites. Based on the projected distance to its nearest neighbour and the relative velocity of 277 km s-1, UGC 2162 could have suffered a tidal interaction 0.3 Gyr ago with its nearest neighbour ( less than the galaxy rotation period212121Trot = 1.45 Gyr = 2 RHI/Vrot where Vrot =0.5W20/sin(i), W20 = 50 km s-1 and i = 55∘), which could conceivably be responsible for both the H i disk warp and currently enhanced SFR. But we argue that if such an interaction did take place, the galaxy’s current state implies that it was most likely a minor flyby that did not sufficiently affect UGC 2162’s morphology to induce its transformation to an UDG. According to the modelling by (Holwerda et al., 2011), HI morphology asymmetries from major merger interactions remain detectable for between 0.4 to 0.7 Gyrs. So presumably for UGC 2162 an encounter with a similar or larger sized or larger group member would remain obvious in the HI morphology for at least that time. In UGC 2162 we do not see any tidal remnants, tidal features or any gas deficiency, which supports our argument against a recent major interaction. Hence, any process that drove UGC 2162 to become a UDG is most likely a long term internal or secular one. Figure 7 compares the Vrot of UGC 2162 to those of LITTLE THINGS dwarfs of similar H i mass and we see that UGC 2162 is a slow rotator for its H i mass, in agreement with the Tully–Fisher analysis.
The estimated halo spin parameter () using Hernandez et al. (2007)’s estimator for spiral galaxies gives a moderate value of 0.1 for UGC 2162. Compared to the higher spin UDGs in Leisman et al. (2017) or Spekkens & Karunakaran (2018), UGC 2162 seems to qualify as a moderate to lower spin galaxy. However, we prefer not to make any claims about halo spin of UGC 2162 as none of the assumptions made to estimate in Hernandez et al. (2007) and Spekkens & Karunakaran (2018) matches UGC 2162’s properties. Instead we prefer to emphasize that most of UGC 2162’s properties strongly resemble those of normal dwarf galaxies (e.g. LITTLE THINGS sample) and more importantly the galaxy does not exhibit an abnormally extended disk compared to its DM halo mass to invoke a high spin halo formation scenario for it. From this we infer that for UGC 2162, we can safely rule out the UDG formation scenario involving high spin halos proposed by Amorisco & Loeb (2016).
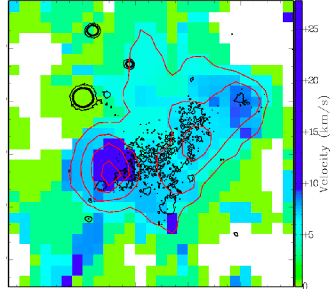
The galaxy shows blue star forming regions near the optical centre and the highest UGC 2162 H i column densities (1.0 – 1.3 1021 cm-2) in the high resolution map approximately coincide with these star forming zones in the SDSS background image (Figure 1). UGC 2162 also has a faint optical disk revealed in the IAC stripe82 g, r, i composite image in Figure 1 of Trujillo et al. (2017) of radius 60 arcsec with a 26 mag arcsec-2 at the disk edge. Fig 11 shows the highest column density contours (in red) from the high resolution H i map overlayed on the high resolution H i velocity dispersion map. The projected positions of the highest density H i and H i velocity dispersion maximum in the Figure coincide and are offset 20 arcsec (1.2 kpc) to the SE of the optical centre. Addionally, there is evidence of diffuse extra-planar H i in the pv diagram (Figure 6) coinciding with the highest H i dispersion zone. This may indicate some moderate to low level SF related outflow, but the highly disruptive past outflows proposed by van Dokkum et al. (2016) and Di Cintio et al. (2017) to explain the origin of UDGs can be ruled out in this case, given the galaxy is currently undergoing a heightened level of SF and its low accumulated stellar mass.
5 Summary and concluding remarks
Overall the H i morphology and kinematics of UDG 2162 indicates a rather symmetric H i disk within a DM halo with a mass and profile typical of dwarf galaxies. However, the H i disk contains a warp and a moderate, currently elevated, SFR of 0.01 M⊙ which might be attributable to an interaction with a fellow group member in last 0.3 Gyr. Comparing UGC 2162 to samples of UDGs with H i detections show it to have amongst the smallest Re with its MH i/M∗ being higher and g – i colour bluer than typical values in those samples. The galaxy is classified as UDG but our investigation could not unambiguously connect its current state to any of the proposed formation scenarios in the literature. On the other hand we could rule out some of the most common proposed scenarios and infer the following: 1) UGC 2162’s DM halo is a dwarf halo typical of normal dwarf galaxies 2) the similarity of UGC 2162’s properties to those of the LITTLE THINGS sample does not support a scenario requiring abnormally high spin 3) the environment and H i content of the galaxy does not indicate a formation scenario depending on a recent interaction or environmental assistance; 4) we did not find evidence of recent or past highly disruptive SF driven outflows. A detailed modelling of the galaxy’s star formation history may throw more light on how this galaxy formed.
6 Acknowledgements
We thank the staff of the GMRT who have made these observations possible. The GMRT is operated by the National Centre for Radio Astrophysics of the Tata Institute of Fundamental Research. TS acknowledge support by Fundação para a Ciência e a Tecnologia (FCT) through national funds (UID/FIS/04434/2013), FCT/MCTES through national funds (PIDDAC) by this grant UID/FIS/04434/2019 and by FEDER through COMPETE2020 (POCI-01-0145-FEDER-007672). TS also acknowledges the support by the fellowship SFRH/BPD/103385/2014 funded by FCT (Portugal) and POPH/FSE (EC). TS additionally acknowledges support from DL 57/2016/CP1364/CT0009. This work was supported by FCT/MCTES through national funds (PIDDAC) by this grant PTDC/FIS-AST/29245/2017. Support for this work was provided by the National Research Foundation of Korea to the Center for Galaxy Evolution Research (No. 2010-0027910) and NRF grant No. 2018R1D1A1B07048314. This research has made use of the NASA/IPAC Extragalactic Database (NED) which is operated by the Jet Propulsion Laboratory, California Institute of Technology, under contract with the National Aeronautics and Space Administration. This research has made use of the Sloan Digital Sky Survey (SDSS). Funding for the SDSS and SDSS-II has been provided by the Alfred P. Sloan Foundation, the Participating Institutions, the National Science Foundation, the U.S. Department of Energy, the National Aeronautics and Space Administration, the Japanese Monbukagakusho, the Max Planck Society, and the Higher Education Funding Council for England. The SDSS Web Site is http://www.sdss.org/.This research made use of APLpy, an open-source plotting package for Python hosted at http://aplpy.github.com. This research made use of APLpy, an open–source plotting package for Python (Robitaille & Bressert, 2012). The Parkes telescope is part of the Australia Telescope which is funded by the Commonwealth of Australia for operation as a National Facility managed by CSIRO.
References
- Amorisco & Loeb (2016) Amorisco N. C., Loeb A., 2016, MNRAS, 459, L51
- Baars et al. (1977) Baars J. W. M., Genzel R., Pauliny-Toth I. I. K., Witzel A., 1977, A&A, 61, 99
- Beasley & Trujillo (2016) Beasley M. A., Trujillo I., 2016, ApJ, 830, 23
- Beasley et al. (2016) Beasley M. A., Romanowsky A. J., Pota V., Navarro I. M., Martinez Delgado D., Neyer F., Deich A. L., 2016, ApJ, 819, L20
- Bell et al. (2003) Bell E. F., McIntosh D. H., Katz N., Weinberg M. D., 2003, ApJS, 149, 289
- Blanton et al. (2003) Blanton M. R., Hogg D. W., Bahcall N. A., Brinkmann J., Britton M., Connolly A. J., Csabai I., Fukugita M., 2003, ApJ, 592, 819
- Broeils & Rhee (1997) Broeils A. H., Rhee M.-H., 1997, A&A, 324, 877
- Carleton et al. (2019) Carleton T., Errani R., Cooper M., Kaplinghat M., Peñarrubia J., Guo Y., 2019, MNRAS, 485, 382
- Danieli et al. (2019) Danieli S., van Dokkum P., Conroy C., Abraham R., Romanowsky A. J., 2019, ApJ, 874, L12
- Di Cintio et al. (2017) Di Cintio A., Brook C. B., Dutton A. A., Macciò A. V., Obreja A., Dekel A., 2017, MNRAS, 466, L1
- Di Teodoro & Fraternali (2015) Di Teodoro E. M., Fraternali F., 2015, MNRAS, 451, 3021
- Espada et al. (2011) Espada D., Verdes-Montenegro L., Huchtmeier W. K., Sulentic J., Verley S., Leon S., Sabater J., 2011, A&A, 532, A117
- Haynes & Giovanelli (1984) Haynes M. P., Giovanelli R., 1984, AJ, 89, 758
- Hearin et al. (2017) Hearin A. P., et al., 2017, AJ, 154, 190
- Hernandez et al. (2007) Hernandez X., Park C., Cervantes-Sodi B., Choi Y.-Y., 2007, MNRAS, 375, 163
- Holwerda et al. (2011) Holwerda B. W., Pirzkal N., Cox T. J., de Blok W. J. G., Weniger J., Bouchard A., Blyth S.-L., van der Heyden K. J., 2011, MNRAS, 416, 2426
- Koribalski et al. (2018) Koribalski B. S., et al., 2018, MNRAS, 478, 1611
- Laporte et al. (2019) Laporte C. F. P., Agnello A., Navarro J. F., 2019, MNRAS, 484, 245
- Leisman et al. (2017) Leisman L., et al., 2017, ApJ, 842, 133
- McGaugh et al. (2000) McGaugh S. S., Schombert J. M., Bothun G. D., de Blok W. J. G., 2000, ApJL, 533, L99
- Meyer et al. (2004) Meyer M. J., et al., 2004, MNRAS, 350, 1195
- Oh et al. (2015) Oh S.-H., et al., 2015, AJ, 149, 180
- Portas et al. (2011) Portas A., et al., 2011, ApJL, 739, L27
- Robitaille & Bressert (2012) Robitaille T., Bressert E., 2012, APLpy: Astronomical Plotting Library in Python, Astrophysics Source Code Library (ascl:1208.017)
- Román & Trujillo (2017) Román J., Trujillo I., 2017, MNRAS, 468, 4039
- Schlafly & Finkbeiner (2011) Schlafly E. F., Finkbeiner D. P., 2011, ApJ, 737, 103
- Scott et al. (2014) Scott T. C., et al., 2014, A&A, 567, A56
- Scott et al. (2018) Scott T. C., Brinks E., Cortese L., Boselli A., Bravo-Alfaro H., 2018, MNRAS, 475, 4648
- Sengupta et al. (2012) Sengupta C., et al., 2012, A&A, 546, A95
- Spekkens & Karunakaran (2018) Spekkens K., Karunakaran A., 2018, ApJ, 855, 28
- Springob et al. (2005) Springob C. M., Haynes M. P., Giovanelli R., Kent B. R., 2005, ApJS, 160, 149
- Toloba et al. (2018) Toloba E., et al., 2018, ApJL, 856, L31
- Torres-Flores et al. (2011) Torres-Flores S., Epinat B., Amram P., Plana H., Mendes de Oliveira C., 2011, MNRAS, 416, 1936
- Trujillo et al. (2017) Trujillo I., Roman J., Filho M., Sánchez Almeida J., 2017, ApJ, 836, 191
- Wang et al. (2017) Wang J., et al., 2017, MNRAS, 472, 3029
- Wittmann et al. (2017) Wittmann C., et al., 2017, MNRAS, 470, 1512
- Wong et al. (2016) Wong O. I., Meurer G. R., Zheng Z., Heckman T. M., Thilker D. A., Zwaan M. A., 2016, MNRAS, 460, 1106
- Yagi et al. (2016) Yagi M., Koda J., Komiyama Y., Yamanoi H., 2016, ApJS, 225, 11
- Yozin & Bekki (2015) Yozin C., Bekki K., 2015, MNRAS, 452, 937
- Zaritsky (2017) Zaritsky D., 2017, MNRAS, 464, L110
- van Dokkum et al. (2015a) van Dokkum P. G., Abraham R., Merritt A., Zhang J., Geha M., Conroy C., 2015a, ApJL, 798, L45
- van Dokkum et al. (2015b) van Dokkum P. G., et al., 2015b, ApJL, 804, L26
- van Dokkum et al. (2016) van Dokkum P., et al., 2016, ApJL, 828, L6
- van Dokkum et al. (2018) van Dokkum P., et al., 2018, ApJL, 856, L30
- van der Burg et al. (2017) van der Burg R. F. J., et al., 2017, A&A, 607, A79