Live Forensics for Distributed Storage Systems
Abstract
We present Kaleidoscope an innovative system that supports live forensics for application performance problems caused by either individual component failures or resource contention issues in large-scale distributed storage systems. The design of Kaleidoscope is driven by our study of I/O failures observed in a peta-scale storage system anonymized as PetaStore. Kaleidoscope is built on three key features: 1) using temporal and spatial differential observability for end-to-end performance monitoring of I/O requests, 2) modeling the health of storage components as a stochastic process using domain-guided functions that accounts for path redundancy and uncertainty in measurements, and, 3) observing differences in reliability and performance metrics between similar types of healthy and unhealthy components to attribute the most likely root causes. We deployed Kaleidoscope on PetaStore and our evaluation shows that Kaleidoscope can run live forensics at 5-minute intervals and pinpoint the root causes of 95.8% of real-world performance issues, with negligible monitoring overhead.
1. Introduction
Large-scale storage services are typically implemented on top of clusters of servers and disk arrays to provide high performance (e.g., load balancers and congestion control) as well as high availability (e.g., RAID, and active-active high availability server pairs). Component failures (khan2011search, ; wan2010s2, ; kbp:12:rec, ; Ford:2010, ; gunawi2018fail, ) and resource contention (cao2017performance, ; kim2017enlightening, ) are chronic problems that lead to I/O timeouts and slowdown in such systems. State-of-the-art solutions focus on reliability failures (e.g., DeepView (Zhang:2018, ) and Panorama (Huang:2018, )) and hence, do not attempt to distinguish between resource contention and component failures in storage systems. We assert that knowing whether a problem is due to resource contention or component/node/subsystem failure is critical in effectively coordinating a recovery strategy. For example, in the case of component failures, an immediate repair action must be taken to avoid failures during fail-over and recovery (ji2019automatic, ; brown2001embracing, ; ma2015raidshield, ). In the case of resource contention, a solution may involve load balancing and throttling of excessive I/O requests generated by applications (as well as restructure the code).
A combination of component failures and contention issues significantly degrades application performance in production settings (see section 3). This paper uses a combination of proactive monitoring and machine learning to jointly address the above issues. We have incorporated the proposed techniques into an automated tool called Kaleidoscope. Our tool has been demonstrated in live traffic on a production system to 1) locate components (e.g., data servers and RAID devices) causing I/O bottlenecks (i.e., I/O slowdown or timeouts), 2) differentiate between a reliability failure and a resource contention issue, and 3) quantify the negligible impact on the system performance while delivering high precision and recall, as discussed later in this section.
To support failure detection and live forensics, Kaleidoscope uses the following novel techniques:
-
•
Proactive monitoring. Kaleidoscope monitors the end-to-end performance of a storage system using Store-Pings, a set of monitor primitives that cover all the storage operations involved in serving a client’s I/O requests (e.g., create, read, write, and delete files). Store-Ping monitors are strategically placed to provide both spatial and temporal differential observability in real time.
-
•
Modeling and inferring component health. The health of a component in a storage system (e.g., a metadata server or a RAID device) is modeled as a stochastic process that accounts for uncertainty (due to performance variability and asynchrony) as well as non-determinism in distributed storage systems. We built a system model by using the factor graph (FG) formalization, which infers component health by ingesting the monitoring data collected by Store-Pings. The inference on the model allows Kaleidoscope to localize unhealthy components in near real-time.
-
•
Methods to determine the cause of I/O failures. A set of statistical methods (including a local outlier factor (Breunig:2000:LID:335191.335388, ) algorithm run using data on server load, disk load, and disk bandwidth utilization) and clustering (taerat2011baler, ) of storage system error logs are used to distinguish between component failures and resource overloads. The statistical methods are based on comparison of reliability and performance metrics (such as the number of active processes on a data server) as they are collected for healthy and unhealthy components. Note that the distinction between healthy and unhealthy components is provided by the FG-based model discussed above.
Deployment.
Kaleidoscope has been deployed on PetaStore, a 36 PB production system, which employs the Lustre file system (lustre, ). Lustre is used by more than 70% of the top 100 supercomputers (lustretop100, ) and is offered by cloud service vendors such as Amazon and Azure (amazonFsx, ; AzurePVFS, ). Its design resembles that of many other object-based POSIX storage systems, such as IBM GPFS (schmuck2002gpfs, ), BeeGFS (heichler2014introduction, ), Ceph (weil2006ceph, ), and GlusterFS (osti_1048672, ).
Monitoring overhead.
Store-Ping-based monitors have been deployed on PetaStore for two years. The monitors measure the completion times of 5,382 I/O requests per minute and cover every I/O path from any client to a RAID device. Since Store-Pings actively collect data at 60-second intervals, we measured the overhead introduced by Store-Ping monitors on the production system and found the overhead to be less than 0.01% on the peak I/O throughput of PetaStore.
Forensic effectiveness.
We used two years of monitoring data collected by Store-Ping monitors to evaluate the effectiveness of Kaleidoscope’s live forensics. The evaluation is based on 843 production issues identified and resolved by the PetaStore operators in this period as the ground truth. Overall Kaleidoscope:
-
•
correctly localizes the component failures (e.g., a specific data server or a RAID device) and resource overloads for 99.3% of cases.
-
•
accurately identifies likely root cause for 95.8% of cases, i.e. disambiguates between resource contention and component failures.
-
•
is configured, in PetaStore, to run data collection at one-minute intervals and produce forensics at 5 minute intervals. Our results indicate that Kaleidoscope can collect and produce forensics using 100 monitors at 30 second interval with marginal impact of 2.42% on the peak throughput.
2. Motivation and Goals
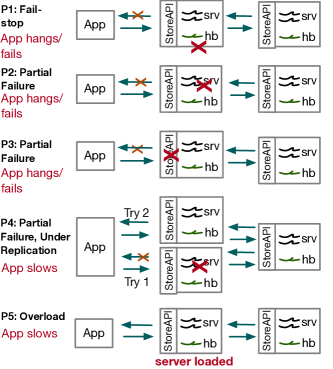
We address the following failure patterns 111(avizienis2004basic, ) provides a taxonomy of failure patterns. that are frequently experienced in large-scale distributed storage systems (Huang:2017, ; bairavasundaram2008analysis, ; Ford:2010, ) such as PetaStore (§3), as illustrated in Figure 1:
-
•
P1: Fail-stop failures of an entire storage component (e.g., crash of data server) (vanRenesse:2009:GFD:1659232.1659238, ; Chandra:1996, ) ;
-
•
P2: Fail-stop failures of a service process or a thread in the storage component (leners2011detecting, );
-
•
P3: Gray failures (Huang:2018, ; Huang:2017, ) that are visible to the application (e.g., an I/O timeout) but not to the failure detectors. They occur because of differential observability;
-
•
P4: Fail-slow failures in which the built-in redundancy masks the failures from applications, but results in increased I/O response time (muntz1990performance, ; wu2009workout, ; Wu:2007:PUF:1362622.1362687, ; 1410735, );
-
•
P5: Fail-slow failures due to high loads or contention in which the storage system takes more time to service an I/O request because of contention but does not lead to I/O timeout (6337777, ; Kraft2013, ).
Our goal is to detect those issues and provide live forensic support to localize unhealthy components and pinpoint root causes. In large-scale storage systems (§3.2), failures with the above different patterns often manifest through similar symptoms known as I/O failures; an I/O request is considered to have "failed" if it has not been serviced within an expected amount of time. The difficulty of distinguishing causes from symptoms often results in a lengthy troubleshooting process and significantly prolongs failure recovery. (different failure patterns require different recovery strategies.)
| Detection method | Failure Patterns | ||||
|---|---|---|---|---|---|
| P1 | P2 | P3 | P4 | P5 | |
| Basic heartbeat | ✓ | ✗ | ✗ | ✗ | ✗ |
| Service-aware heartbeat | ✓ | ✓ | ✗ | ✓ | ✗ |
| Client-view observation | D | D | D | ✗ | ✗ |
| Kaleidoscope | ✓ | ✓ | ✓ | ✓ | ✓ |
2.1. The State of the Art
In the following, we show that the state-of-the-art approaches are fundamentally limited in dealing with the aforementioned failure patterns that commonly occur in the field, especially in distributed storage systems. table 1 summarizes three different classes of existing approaches and compares them with our Kaleidoscope approach. We focus on failure detection in the rest of this section, but we would like to note that Kaleidoscope is beyond a failure detector; it provides end-to-end live forensics to pinpoint root causes.
We classify existing failure detection methods into three categories: (1) basic heartbeats (vanRenesse:2009:GFD:1659232.1659238, ; Hayashibara:2004, ) in which a dedicated heartbeat process running on each component indicates the status (UP or DOWN) of the component; (2) service-aware heartbeats (1405971, ; Leners:2015:TUD:2741948.2741976, ; leners2011detecting, ; 794001, ) in which the heartbeat process validates the liveness and functional correctness of the services 222Any basic heartbeat can be converted to service-aware heartbeats.; and (3) client view observations (Zhang:2018, ; Huang:2018, ) in which failures are detected based on the observations of the clients.
As shown in Table 1, heartbeat-based methods are insufficient. Ideally, service-aware heartbeats can report the precise status of a component; however, it is hard to check the fine-grained functionality of each component, since they are typically implementation-specific. Moreover, a component could depend on many other components, making it hard to scale. Client-view observation can close the gaps of differential observability, but it cannot deal with failure patterns that have not manifested as external, client-perceivable issues such as Patterns 4 and 5. On the other hand, our study in §3.2 shows that Patterns 4 and 5 are among the biggest threats to availability and performance in large-scale distributed storage systems. Kaleidoscope is designed to address all the failure patterns in Table 1.
We argue that the common practices of failure detection (as discussed above) do not consider the inter-relation between reliability and performance. However, as we demonstrate in this paper, the ability to differentiate between component failures and resource overloads is of vital importance.
2.2. Principles
To meet the requirements of proactive failure detection and live forensics, we employed several design principles that are crucial to the success of Kaleidoscope:
-
•
Observability. We focus on enhancing observability to achieve fast failure detection and live forensics from both the client’s and the server’s views. The client-view helps us detect user-perceived I/O failures, while the server-veiw helps us pinpoint the root causes on the server side. The view points are both spatial (across clients) and temporal (in time series).
-
•
Dealing with uncertainty. Failure detection and forensics have to take into account the uncertainty introduced by the complexity of the production environment (e.g., random path selection) and noise associated with measurements (e.g., transient delay in I/O packets).
-
•
Automation. We aim to create a fully automated and unsupervised system that can work with massive and imperfect production data. Tools are less useful if they require manual classification and reasoning.
-
•
Localization support. We aim to localize the unhealthy components that lead to the detected I/O failures. We find that aggregation of the client-side observations offers great opportunities for effective localization, because a misbehaving component often affects multiple clients.
-
•
Identifying root causes. We find a strong need to pinpoint the root cause of I/O failures in real time, because recovery strategies are based on root causes. Distinguishing a) I/O failures caused by component failures and b) resource overloads would be particularly useful.
-
•
Low overhead. Fault tolerance and forensics cannot affect or interfere with the performance of the normal workloads.
3. Understanding Failures
Kaleidoscope is driven by insights from the daily operations of a petascale distributed storage system anonymized as PetaStore and the analysis of production failures at PetaStore.
3.1. PetaStore
PetaStore is designed for large-scale, high-performance computing with I/O intensive workloads, such as machine learning and large-scale simulations. PetaStore consists of 6 management servers, 6 metadata servers, 420 data servers, and 582 I/O forwarding nodes (LNET nodes). The storeage servers in PetaStore are connected via an internal Infiniband network, serving 28,000+ computing nodes (as clients).
PetaStore uses the Lustre distributed file system to manage 36 PB disk space across 17,280 disk devices. The disks are arranged in grid RAID (holland1992parity, ), and referred as object storage devices (OSDs).
Lustre implements a loadable Linux kernel module installed in every computing node for POSIX compliance. The computing nodes are diskless: all I/O operations go by RPC to the LNET nodes, and the LNET nodes control the storage access with direct connections. LNET nodes act as virtual switches connecting two different network fabrics: a proprietary network connecting compute nodes, and an Infiniband network connecting storage servers.
PetaStore employs the following reliability mechanisms.
High availability (HA)
PetaStore’s HA features are based on server mirroring and data replication, including:
-
•
active-active HA pairs for data servers;
-
•
active-passive HA pairs for both metadata and management servers;
-
•
active-passive for RAID disk devices (OSDs).
When a server failure is detected by the partner server, the partner server in the HA pair kills the failed server, mounts the failed server’s OSDs, and takes over the failed server’s load (to prevent data inconsistencies due to “split brains”).
Imperative recovery
A fail-over triggers a soft restart on the clients that are maintaining connections with the failed server; after that the management server updates a status table mounted at each client. With imperative recovery, the management server actively informs the clients about the failure to force the clients to reload the table and reconnect to the target nodes, instead of waiting for an RPC timeout.
Transaction-based recovery.
PetaStore makes the failover process transparent to storage clients by using transaction-based recovery. Each client maintains a transaction log. If a server fails, the clients automatically reconnect to the new server and replay transactions that were not committed prior to the failure, in order to recover the lost state.
RAID.
PetaStore uses RAID for disk reliability. The metadata and management servers are equipped with RAID 1+0 disk volumes, and the data servers are equipped with multiple RAID 6 volumes (for storing data blocks) and one RAID 1 volume shared between the HA pairs (for journaling and state maintenance). Each volume has two or more hot spares.
3.2. Failure Characteristics
Next, we provide characterization of storage-related failures, which include storage component failures and I/O request failures, observed in PetaStore in 23 months between Jan. 1, 2017 and Nov. 30, 2018.
3.2.1. Component Failures
PetaStore-related failures cause service disruption and unavailability. For example, in 2018, such failures accounted for 64.4% (1,175,082 node-hours) of total lost node-hours. The total lost node-hours in 2018 was only 0.74% (1,825,870 node-hours) of total possible operational hours (of 246,369,160). 0.74% is substantial for large-scale data center due to loss of large amounts of compute time; in this case, roughly contributing to 32 million core-hours. table 2 gives a fine-grained categorization of the storage-related failures in three different failure domains, as follows.
Client.
An I/O failure can be caused by failures of a Lustre client module. A typical failure mode of a Lustre client module is to hang or crash because of software bugs. Software bugs can impact multiple clients at the same time. In the past, a bug in the lock management running on the clients has led to simultaneous failures of hundreds of clients.
Networks.
Network failures lead to unreachability of storage server; thus leading to I/O failures. We categorize network failures into three sub-domains: 1) failures of compute-side networks that connect compute nodes, 2) failures of storage networks that connect storage servers, and 3) failures of LNET nodes. There were 262, 7, and 6 failures in those categories respectively. In PetaStore, failures of a network component (e.g., switches) require updating routing paths.
| Domain | Failed component | # Incidents |
|---|---|---|
| Client | Lustre client daemons | 74 |
| Network | Compute-side network links/switches | 262 |
| Network | LNET nodes | 6 |
| Network | Storage ToR switch and links | 7 |
| Storage | OS/Software | 11 |
| Storage | Server HW (CPU/Memory/Fan/PSU/…) | 17 |
| Storage | Disk drive failures | 295 |
Storage servers.
We find that failures in the domain of the storage servers tend to be more severe and long-lasting, than client/network failures. In total, fail-stop failures led to five system-wide outages and multiple partial outages that affected a subset of applications. Although most of the storage server failures were handled through the HA features, we found that certain fail-over procedures took significantly more time to fail-over than usual (several minutes and even hours), leading to partial or complete unavailability of the storage system. (two such procedures are described in §3.4.) PetaStore experienced 295 disk failures. Most of them were handled by RAID; however, in 6 of 295 cases, disk-drive failures triggered software bugs (5 cases) or there was 1 RAID array failure. In those 6 cases, PetaStore experienced partial system outages: hundreds of applications could not connect to the storage system during the failure.
Only a very small percentage (0.057%) of component failures cause system-wide outages. The vast majority of component failures lead to partial system outages or performance issues.
3.3. I/O Failures
We define an I/O failure as a failure of an I/O request to be serviced in the expected time (according to service-level agreements). From the application’s point of view, a late I/O response is no different from a failed I/O response—both of them cause the application I/O to timeout. In PetaStore, I/O requests are expected to complete within one second.
3.3.1. I/O Failures Caused by Component Failures
We find that the most common manifestation of component failures is performance degradation that leads to I/O failures. For example, disk failure is transparently tolerated by the RAID array; however, disk failures trigger RAID resyncs on hot-spare disks to protect the RAID array from future failures. Such a resync or periodic scrubbing of a RAID array takes away a certain amount of bandwidth for an extended period of time, ranging from 4 to 12 hours, and that leads to an increase in completion time of I/O requests.
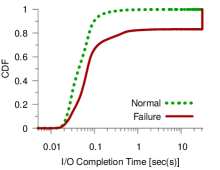
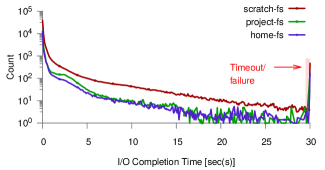
Using Kaleidoscope, we find that I/O requests during fail-stop component failures (those that do not lead to outages) increase the average completion time of I/O requests by as much as compared to the average I/O completion time in failure-free scenarios. Similarly, the 99th percentile of completion times of I/O requests is as high as 31 seconds (I/O requests timeout) due to fail-stop failures. Figure 4 shows the difference between I/O request completion times under component failures and without failures (labeled as “normal”).
Component failures have significant performance impact in terms of I/O completion time.
3.3.2. I/O Failures Caused by Resource Overloads
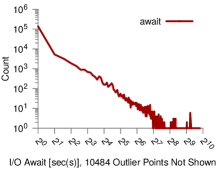
We find that resource overloads are a frequent root cause of I/O failures. For a quantitative study, we used disk service time, returned by iostat as await, as a measure of the load on disk devices. await measures the average time from the beginning to the end of requests, including device queuing and the actual time to service the I/O request on the disk device. await is different from I/O completion time, which includes the traversal time between the client and the disk device. Note that anomalies in disk service time could have different causes, such as disk errors, extreme I/O requests that content for blocks on a specific disk, and high load that exhausts hyper-threads.
fig. 4 shows a histogram of disk service time (await) in seconds returned by iostat using an event-driven measurement (which is triggered only when loadavg (loadavg, ) exceeds 50, to avoid intrusive behavior). We can see from fig. 4 that such anomalies occur frequently. Specifically, we found 14,081 such unique events by clustering the per-disk continuous data points in time with service times longer than 1 second.
Extreme IO.
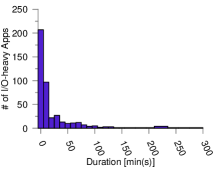
Extremely high number of I/O requests create high load on the server and lead to high disk contention. Such unintentional extreme usage of storage systems cause performance and stability problems. fig. 4 shows a histogram of the durations of extreme I/O requests by applications to the indexing server. The durations of high I/O requests are generally small (lasting less than 10 seconds); however, there is a long tail of applications that send high I/O requests for hours, as seen in Figure 4. For example, in one case, an application caused high load on the metadata server. The application opened and closed 75,479,396,602 files in a span of 4 hours, and issued 20,000 I/O requests per second. During that time, the loadavg increased from 60 to as high as 350. The 50th and 99th percentile durations of extreme I/O were found to be 12 and 227 minutes, respectively.
High load.
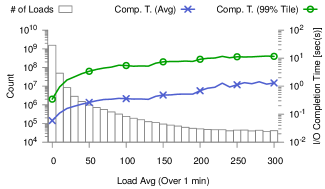
I/O request completion time increases with the load on the storage servers. High load conditions are caused by a flood of I/O requests on a storage server either 1) by one application (cf. extreme IO), or 2) by multiple applications that are competing for a shared resource. Figure 5 shows the histogram of load across all servers; this graph also shows the average completion time and the 99th percentile completion time of I/O requests (i.e., latency) at different storage server load values. Overall, we can see a strong relationship between an increase in load and the completion time of I/O requests. At high load (loadavg of 350), the average I/O request completion time increases to 1 second, and the 99th percentile I/O request completion time increases to 10 seconds. The mean I/O completion time increased under high load (i.e., loadavg ).
Resource overloads (due to extreme I/O behavior or high load) are a frequent root cause of I/O failures.
3.4. Long Tail of Zero-day Failures
At the PetaStore scale, failures with recurring patterns have all been addressed by building specific solutions over time. For example, imperative recovery (§3.1) has been deployed in response to slow recovery and timeout of I/O transactions, and preemptive disk replacement has been adopted to prevent concurrent disk failures and reduce recovery time. On the other hand, we have found a long tail of failures that do not have common patterns and are hard to anticipate; we call them zero-day failures (analogous to zero-day vulnerabilities) (Mogul:2017, ).
We analyzed issue tickets and found that there were four new issues on average per month. The following describes two cases of zero-day failures, which by definition are rare.
Failures of failure recovery.
PetaStore has experienced multiple failures of failure recovery throughout its lifetime. The failures inevitably led to unavailability of the largest partition on PetaStore for several hours. The management server (MGS) detected that the active metadata server (MDS-A) was not responding because of a software bug that had led to a hang. Ten minutes later, after several retries MGS declared the MDS-A as unreachable. 22 minutes after MGS had detected a problem in the MDS-A, and launched the fail-over procedure by which the active standby MDS-B mounted MDS-A volumes and triggered imperative recovery. During the mounting process, the RAID array was found to have errors which triggered a background reconstruction process that used a hot spare. Because of the RAID reconstruction, the recovery of client transactions timed out, causing client eviction. 150 minutes later, the RAID array reconstruction, combined with high I/O requests, overloaded MDS-B and caused the whole storage partition to become unavailable. During the 4 hours of this case, the whole file system partition provided a degraded service for about an hour and was unreachable for the remaining 3 hours. During that outage, jobs running on 8,346 compute nodes were interrupted.
Failures of LNET nodes.
LNET nodes serve as bridge devices between computing nodes and storage servers. A request from a client to an OSD (a RAID disk device) can be served by any one of 4 LNET nodes. For any pair of <client, OSD>, the group of 4 LNET nodes are fixed and chosen in round robin when routing a request. A failure of an LNET node is detected through heartbeats. However, in this case, an LNET node was found to drop requests passing through it, causing I/O failures. The LNET node appeared to be alive and healthy and sending heartbeats to the rest of the components. Upon investigation, it was found that the LNET had suffered a software error that caused it to drop I/O requests. The incident was captured via an application’s own performance monitoring system. The I/O bandwidth (in MB/sec) for the applications served by the failed LNET node decreased by 25+% for multiple hours.
Many high-impact zero-day failures can be prevented if the faulty or unhealthy components can be detected and the corresponding potential causes can be diagnosed earlier, before they lead to user-visible impact.
4. Design and Implementation
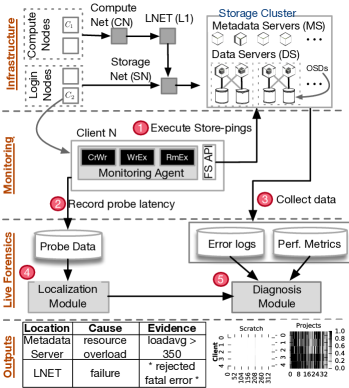
Figure 6 shows the overall architecture of Kaleidoscope and how it fits to a large-scale distributed storage system like PetaStore. Kaleidoscope has three main components: 1) proactive monitoring modules for failure detection, 2) failure localization based on modeling of the health of every storage component (e.g., metadata server and data server) using the monitoring data, and 3) a diagnosis module that pinpoints the root causes of unhealthy storage components that affect the performance of I/O requests.
Kaleidoscope is a fully automated system. Its design follows the principle in §2.2. A key emphasis of its design is the need to be practical and useful for real-world production storage systems like PetaStore. Its success has been proven by its deployment at PetaStore since 2017. Kaleidoscope has been used by PetaStore operators to quickly identify failing components, perform preemptive replacement, and help users rewrite application code to avoid extreme I/O.
4.1. Monitoring
Kaleidoscope proactively monitors a storage system from the viewpoint of both the clients and the storage components. The component view alone is insufficient to reveal and identify partial, gray failures manifested in complex performance anomalies, while the client view alone is insufficient to reveal the root causes inside the storage subsystem.
4.1.1. Store-Pings
We designed Store-Pings, a set of primitives for measuring the availability and I/O performance of distributed storage systems. Store-Pings are analogous to but different from the ICMP-based network ping. A Store-Ping is a specific I/O request that traverses all necessary storage components to complete the I/O request. The API of a Store-Ping is:
store_ping(ost, *io_op, kwargs)
where *io_op is a function pointer to an I/O operation, and kwargs is the argument for *io_op. Store-Pings use direct I/O requests to avoid any caching effect into the client memory, thus ensuring the I/O request’s traversal of the disks on the data servers.
We designed three types of Store-Pings, CrWr, WrEr, and RmEx, which represent three different I/O requests:
-
•
CrWr: create and write a file
-
•
WrEx: write to an existing file
-
•
RmEx: remove an existing file
The three types of Store-Pings test all the storage subsystems involved in ensuring correct and successful I/O operations. CrWr and RmEx test the functionality of the metadata servers, whereas WrEx tests the functionality of the data servers (and, correspondingly, RAID disks). For example, a CrWr requires two different backend operations to complete: (1) creation of a file by a metadata server on a random data server (and the corresponding RAID disks) and adding of the file entry to the metadata index, and (2) opening and writing of a file on the data server (and the corresponding RAID disks). The payload of a write request is as small as 64 bytes.
Store-Pings assume that a monitor can pin files onto a specific OSD (and hence the data server). File pinning can be easily supported, as the metadata server has all the data chunk information. Thus, a file uniquely identifies a data server for a monitor, and that also helps to minimize variation in latency measurements (avoiding concurrent Store-Pings from other monitors). This functionality is used to deterministically test the data servers by using WrEx I/O requests. Store-Pings do not require pinning of any other nodes (e.g., metadata servers).
4.1.2. Store-Ping-Based Monitors
A monitor continuously executes Store-Pings to measure the availability and performance of storage components. However, in order to monitor all storage components (LNETs, metadata servers, data servers, and OSDs), Kaleidoscope needs to select the number of Store-Ping monitors and their placement in the compute network. Store-Ping monitors should be enabled only on a subset of clients ( out of clients where ) to reduce the overhead of the monitoring system and its impact on existing I/O requests. Thus, selection of the number of Store-Ping monitors, , and their placements can be formulated as a constraint optimization problem: the monitors should achieve the highest coverage (observability) under the monitoring overhead budget.
In this work, we use network tomography principles (castro2004network, ) in which the aim is to find unhealthy components in a given network topology graph by running tests on subsets of components, with each test (which is a completion of an I/O request sent by Store-Pings) indicating whether any component in the subset is unhealthy. The subsets of components that can be tested together are limited by the set of measurement paths , which are in turn limited by the topology, probing mechanism, and placement of monitors. Specifically, the placement of monitors in Kaleidoscope is guided by the “sufficient identifiability condition” (Ma:2014:NFL:2663716.2663723, ), which states that in a network graph consisting of both monitor and non-monitor nodes, any set of up to failed nodes is identifiable if for any non-monitor and failure set with (), there is a measurement path going through but no node in . Such a method ensures spatial differential observability. These principles put a restriction on the minimum number of concurrent failures (in our case, unhealthy components), , that can be detected in the storage system.
4.1.3. Component-Side Monitoring
Store-Pings can be used to infer the health of storage components based on client-view observations; however, it does not provide any information about the root cause of unhealthy components. Kaleidoscope uses a comprehensive component monitoring system (Integrated System Console (6968671, )) to collect status data on different components, including I/O statistics (loadavg and I/O requests per second of data servers, and I/O wait time and utilization of disks) and logs (error logs and syslogs) of each storage server.
4.2. Failure Localization
Kaleidoscope infers the health state of a storage component based on Store-Ping monitoring. It addresses the challenges of 1) measurement noises due to asynchronous and variability in I/O measurements, and 2) non-determinism due to path redundancy and randomness in routing/balancing. Our experience tells us that threshold or voting-based methods are ineffective, because of the non-linearity that originates in measurement noise and non-determinism.
Kaleidoscope models health as a stochastic process that accounts for measurement noise and non-determinism. The modeling is based on factor graphs (FG) (koller2009probabilistic, ), a generalization of probabilistic graphical models. FGs model the relationship between component health (random variables) using domain-guided factor functions (how a component’s health leads to I/O failures). Factor functions encode 1) the stochastic nature of measurement noise and variability, and 2) non-determinism due to path redundancy. FGs only needs small samples and outperforms supervised machine learning (e.g., regression (Zhang:2018, ; tan2019netbouncer, )) with domain-guided factor functions.
In this section, we formalize the modeling and explain the procedure of using the model to infer the health of the components, including metadata servers, data servers, I/O forwarding servers (LNETs), and the storage network.
Modeling.
We define the health of a component as the probability that it will successfully serve an I/O request, denoted by . is sampled from a beta distribution, , to incorporate uncertainty, where and determine the shape of the distribution.333Beta distributions are continuous distribution commonly used as a prior for Bernoulli random variables. It drastically reduces the computation time for inference. At any epoch (i.e., at the time of inference), and are updated based on historical information up to the current epoch.
Store-Ping-based monitoring provides measurements on path availability between the two members of each <client, OSD> pair. We use the random variable to denote the number of observed successful Store-Pings on a path (a <client, OSD> pair), and we model using a binomial distribution, i.e., , where denotes the availability of the path and denotes the number of Store-Pings sent by the monitoring system through .
We leverage the fact that, for a Store-Ping to be successful, every component on the I/O path must be both available and reachable from the client. When a Store-Ping takes a unique path from a client to a OSD, the path availability can be determined solely by the product of individual component’s health: .
However, because of the redundancy in a distributed system (e.g., the HA pair-based failover), a Store-Ping destined for an OSD may take a different path. Thus, the path availability cannot be expressed in terms of each component’s own availability, but also depend on the availability of the other redundant components. For example, an I/O request to an OSD can be routed through one of two data servers connected to it. Hence, a destination OSD is not reachable if both of the two data servers connecting to it are not available or the OSD itself is not available. , the probability of reachability of the OSD, can be determined as:
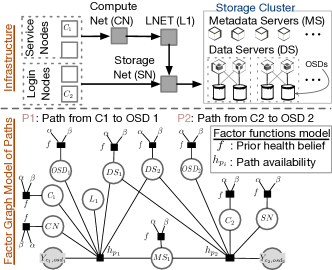
where and denote the health of data servers in the HA pair associated with the OSD (denoted by ). In this equation, and determine the probability distribution of the and to be not healthy respectively, and their product determines the probability distribution of both being in unhealthy state. The probability distribution, when multiplied by the probability distribution of the OSD is health, gives the reachability of the OSD. From fig. 7, between client and is given by:
Thus, the path availability must explicitly model such redundancies (e.g., LNETs and HA-pairs) while estimating the availability of a path.
The model described above can be represented using a factor graph that models the interactions between different random variables (shown as circles) and functional relationships known as Factor Functions (shown as dark boxes).
Figure 7 shows a part of the FG that models 1) the health of components that lie on the path of <, > and <, >, 2) path availability for these components, and 3) OSD availability. The components , , , and form an HA group (§3.1). The circles in the FG represent random variables (e.g., a component’s health). The factor functions, represented by squares, encapsulate the relationships among the random variables. The singleton factor functions encapsulates the prior belief of the health of the component, which is given by the Beta distribution (see above). The multivariate factor function models the number of successful Store-Pings on a path, which is given by the binomial distribution (see above).
Inference.
With HCFG, we can calculate the health of each component in the system. The expected health of a component can be estimated as . Observations () and the prior belief of the health of components ( and for each ) are needed at epoch . is measured by the number of observed successful Store-Pings during a specified interval, and and are obtained from the inference result at the previous epoch.
We solve the inference task using the Monte Carlo Markov Chain (MCMC) algorithm (neal1993probabilistic, ). MCMC is a technique that can be used to estimate the expectation of a statistic from a complex distribution (in this case, ) by generating a large number of samples from the model and directly estimating the statistic.
4.3. Failure Diagnosis
After identifying an unhealthy component, Kaleidoscope further pinpoints the causes, including component failures (section 3.3.1) or resource overloads (section 3.3.2). Kaleidoscope pinpoints the corresponding error logs for component failures, and the corresponding load metrics for resource overloads.
The root cause analysis is based on a statistical method. Our key insight is that unhealthy components and their healthy counterparts behave differently. For example, we expect all data servers that belong to the same file system to generate similar error logs over a time window. However, when a server is unhealthy that group it generates unique patterns of error logs.
Attributing the cause to overloads.
We collect the following monitoring data (§4.1.3) to identify resource overloads as the cause:
-
•
loadavg on the data and metadata servers which captures the load on a server at 5-minute intervals;
-
•
await time of disk devices, which captures the average service time (in milliseconds) taken by a disk device to serve an I/O request; and
-
•
utilization of disk devices, which captures the bandwidth saturation of a disk device.
Kaleidoscope runs a local outlier factor (LOF) anomaly detection algorithm (Breunig:2000:LID:335191.335388, ) on a homogeneous group of storage components. The LOF is based on the concept of a local density, where locality is given by k-nearest neighbors, whose distance is used to estimate the density. By comparing the local density of an object to the local densities of its neighbors, one can identify regions of similar density, and points that have a substantially lower density than their neighbors, and thus are considered to be outliers. We chose LOF because storage components within a homogeneous group may have different modes of operation. Such modes are not indicative of any degradation. For example, in the production data, we found cases when data servers had low loadavg (<10) and data servers had high loadavg (>64). However, if there is a data server whose loadavg is significantly higher than both of those modes of operation, that is indicative of the problem. A similar methodology is adopted for disk devices by using the await and utilization metric.
Attributing the causes to component failures.
Component failures are attributed based on log analysis. Kaleidoscope collects error logs from all the components of the storage subsystem (§4.1.3). The error logs generated by the unhealthy components are compared to the error logs of healthy components, , where represents the log set, represents unhealthy components, and represents healthy components. If , then is provided as evidence, and the unhealthy status is attributed to component failures. Note that Kaleidoscope processes the raw logs and curates them into a normalized form that captures the triggering events of the logs by filtering out time- and node-specific metadata. It does so using regular expression based log processing tools (taerat2011baler, ) based on filters provided by production facilities for the Lustre file system. Despite its simplicity, we find that the statistics-based log analysis is very effective and scalable in pinpointing the log entries that indicate the failure causes, as shown in our evaluation.
Note that Kaleidoscope could report the likely causes of IO failures to be marked as both component failures (by logs) and resource overloads (by metrics).
4.4. Implementation and Deployment
Kaleidoscope has been deployed in PetaStore. We placed monitors on clients that (1) have different underlying system stacks (e.g., kernel versions), (2) are physically located on different networks, and (3) execute different services (e.g., scheduling, user login, and data moving). Specifically, we placed monitors on all the service nodes (64 nodes) that provide scheduling and other services, import/export (I/E) nodes that help move bulk data into and out of the storage system (25 nodes), and login nodes (4 nodes) that users use to launch applications. The I/E nodes and login nodes are located on the storage network, whereas the service nodes are located on the proprietary compute network fabric. However, in production, at any given time, Store-Pings are executed from (1) all login nodes, (2) 1 out of 64 service nodes chosen randomly, and (3) 1 out of 25 I/E nodes444I/E nodes are the import export nodes that are used to move data in and out of the PetaStore. chosen randomly. This probing plan not only satisfies our minimal probing plan for inferring storage system health, but also provides reliability of monitoring infrastructure itself. That is, in case of a client-failure another client can be chosen as a monitor.
Store-pings are executed every minute for each OSD, data server and metadata server. For data and metadata servers, the Store-Pings use the same Lustre APIs used for writing to disk, but instead create/read/write to the memory of the server. This results in 72 CrWr (6 clients 6 metadata servers and 6 metadata OSDs), 72 RmEx (6 clients 6 metadata servers and 6 metadata OSDs) and 5,184 WrEx (6 clients 432 data servers and 432 OSDs) requests/minute. To get deterministic measurement paths for Store-Pings between the two members of each monitor, OSD pair, we use setstripe of Lustre to create a unique file on each OSD for a client.
The Store-Ping-based monitoring is implemented in Python and scheduled using Jenkins (jenkins, ). The Store-Pings are configured to run at one minute intervals with a timeout of 30 seconds for each I/O request. The failure localization module is implemented using PyMC3 (10.7717/peerj-cs.55, ), a Python-based probabilistic programming language. The failure localization module uses samples collected over five minutes; thus, it uses data from 26,640 I/O requests for inference. Finally, the diagnosis methodology was implemented in Python using the Scipy (jones2014scipy, ) and Baler (taerat2011baler, ) libraries.
5. Evaluation
We evaluated Kaleidoscope using 843 production issues resolved by the PetaStore operators over a span of two years (Dec. 1, 2016 to Nov. 30, 2018.). Each of the 843 issues has a report with manual categorizations that we refer to as the ground truth. As Kaleidoscope has been deployed for more than two years, we used Kaleidoscope to do live forensics (triage and root-cause analysis) for each of the issues. As discussed in §5.1, Kaleidoscope reports far more issues than the 843 found but it is up to the operators to decide whether to investigate a particular issue, based on its severity, job priority, and communications with customers.
5.1. Overall Results
Table 3 presents the effectiveness of Kaleidoscope in triaging the failing components (§4.2) and pinpointing their root causes (§4.3). We can see that Kaleidoscope can localize the unhealthy components, caused by failures or overload, for 99.3% of the production issues (837 out of 843). Only six out of 843 were not detected by Kaleidoscope. We find none of the six issues had any impact on the I/O completion time. All six issues belonged to disk drive failures. Those failures were recorded and flagged for repairs to avoid RAID failures.
Among the 843 production issues, 346 were caused by component failures and 497 were caused by resource overload, as discussed in §3.3.1 and §3.3.2, respectively. As shown in Table 3, Kaleidoscope was able to correctly identify the root causes of 98.3% of the issues caused by component failures. In addition to correctly associating the root cause of and issue to a failure, it presented system managers with the error logs corresponding to the failure. For overload issues, Kaleidoscope was able to correctly associate the root causes of 94.2% of the issues (468 of 497) while incorrectly attributing the remaining 29 issues to component failures. The reason is that the 29 overload issues coincidently had random noises in the logs, which confused Kaleidoscope.
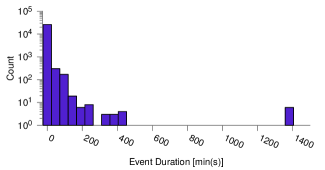
In addition to the 843 known issues, Kaleidoscope found another 25,753 I/O failure events. Figure 8 shows the histogram of the durations of these I/O failures. As shown in the figure, 6073 of 26,596 I/O failures lasted for more than 5 minutes; 1,773 lasted for more than 20 minutes; and 1,026 lasted for 30+ minutes. We find that the 843 reported cases mostly fall into the range of 20–30 minutes. Typically, operators focus only on issues that last for 30 minutes.
Our interactions with PetaStore’s operators told us that the Store-Ping-based monitoring helped them understand the tail latency and performance variation in real time. Operators can detect performance regression by comparing the measurements from different points of time. Figure 9 shows the latency measurement histogram (plotted as a line with every 20 points on the graph) for the WrEx Store-Pings. (We omit RmEx and CrWr because of the page limit.) We can see that 99% of WrEx completed within one second (SLO), and only 0.14% failed with a timeout. With Kaleidoscope, it is efficient to nail down to the anomalies and perform live forensics (e.g., the load-related resource overload condition discussed in section 3.2).
| True Positive | False Negative | Total | |
|---|---|---|---|
| Component Triage (Total: 843) | |||
| 837 (99.3%) | 6 (0.7%) | 843 | |
| Root-cause Analysis (Total: 843) | |||
| (Failure) | 340 (98.3%) | 6 (1.7%) | 346 |
| (Overload) | 468 (94.2%) | 29 (5.8%) | 497 |
5.2. False Positives and Incorrect Diagnosis
It is challenging to measure the false positives of Kaleidoscope, as there are no ground truth data; an issue tagged by Kaleidoscope as not being resolved could come from different reasons (e.g., low priority jobs).
To estimate the false-positive ratio, we randomly selected 100 issues reported by Kaleidoscope: 50 from the “component failure” category and 50 from the “overload” category. Kaleidoscope was able to localize all cases correctly. However, it failed to identify the root causes of four (out of 100) cases. Our further investigation showed that the false positives were due to the propagation delay between the occurrence of the internal faults at the server side and their manifestation as I/O failures. Such time misalignments are expected in a production system, and Kaleidoscope currently does not model them.
5.3. Monitoring Overhead
We use the IOR benchmark (ior, ) to measure the monitoring overhead in a worst-case scenario. The measurement uses stress testing to max out the throughput offered by PetaStore. IOR was running on 4,320 compute nodes during this measurement. table 4 shows the monitoring overhead introduced by Store-Pings when (a) 100 monitors were running at 30 second interval and (b) 6 monitors were running at one-minute interval. Store-Pings decreased mean throughput only by in PetaStore’s production settings. However, scaling to 100 monitors and increasing the frequency by 2 would decreases the throughput by less than . Note that the average throughput in production is significantly below the peak throughput under the stress test. We also measured the time difference between the launch of Store-Pings for a given interval and found that all Store-Pings were launched within 10 seconds of each other and 98.4% were launched within 3 seconds of each other.
| Kaleidoscope | 100 monitors | 6 monitors | ||
|---|---|---|---|---|
| Mean | Std | Mean | Std | |
| Off | 100 | 0.15 | 100 | 0.13 |
| On | 97.58 | 0.32 | 99.99 | 0.12 |
5.4. Simulation
Before deploying Kaleidoscope in production, we built a trace-based simulator based on PetaStore’s topology to extensively evaluate the localization and root cause analysis.We ran 1,000 simulation experiments. In each experiment, the simulator injected faults based on the distributions of completion time characterized in §3.2 to simulate both component failures and overload.
In 1,000 simulation experiments, when the simulator injected exactly two faults (one component failure and one overload), Kaleidoscope detected these cases with no false positives. We then increased the number of simultaneous faults to 20 for failures and overloads. With 40 faults, in the worst case, Kaleidoscope generated 4 false positives and found all the injected faults (recall of 1.0). Kaleidoscope performed particularly well in the simulations because the simulated faults have immediate manifestation and less noise.
5.5. Kaleidoscope in Action
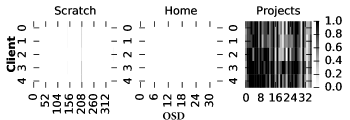
We use real I/O failures to illustrate Kaleidoscope in action. fig. 10 uses a heatmap to depict a failure impact on data servers. Each heatmap shows the ratio of operations that took longer than 1 second to the total number of operations issued during 5 minutes interval by a given client (y-axis) to each data server from Scratch, Home, and Projects domains (x-axis). Scratch, Home, and Projects are three file systems in PetaStore. Clients 0, 1, and 2 are the login nodes on Ethernet network, client 3 gives an aggregated view of all 25 IE nodes on Infiniband network, and client 4 provides an aggregated view of all 64 service nodes on compute network.
fig. 10(a) shows a case of two failures that occur concurrently in the storage system: (i) a load issue on scratch data server 208 and (ii) an outage of projects file system metadata server. The heat map in fig. 10(a) shows that both scratch and home data servers are healthy for most part with exception of the scratch data server 208. Data server-208 is unhealthy as all clients have trouble completing I/O requests within 1s. The heatmap for projects file system indicates a wide-spread outage that could be caused by network-wide issue, metadata server outage, or concurrent outage on all 36 LNET nodes connecting clients to projects file system. As Kaleidoscope shows that scratch and home data servers are functioning properly, network-wide issue is improbable as they all share the same network. It is also highly unlikely that 36 LNET concurrently fail. Therefore, by elimination, we conclude that the observed outage would only be caused by an issue with: (i) projects file system metadata server or (ii) the 2 LNETs serving the metadata server.
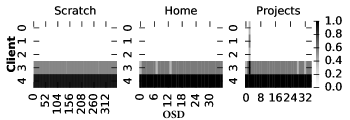
The heatmap in fig. 10(b) shows that all requests from aggregated view of client 4 are failing (or took longer than 1s) across all data servers. The ratio of 1.0 across all data servers is a clear indication of a network-wide outage. In case of IE nodes (i.e., Client 3), one of the clients is having trouble accessing the OSDs across all data servers as indicated by the grayish pattern on the heatmap. From the heatmap alone it is unclear whether the issue was caused by a bad LNET node or the client itself. However, it is possible to diagnose the problem by looking at the topology of the system to rule out contribution of LNET or client for failing I/O requests.
In both cases, Kaleidoscope provides correct localization and diagnosis. Kaleidoscope provides only relevant visualizations after localization between OSD and clients as the evidence, instead of generating visualizations for all possible combinations (e.g., LNET and clients).
6. Discussion and Limitations
Kaleidoscope is designed with an emphasis on practicality and scalability, without a desire to be 100% accurate. As we show in §5.2, Kaleidoscope occasionally introduces false positives and incorrectly diagnoses due to not modeling the propagation delay between the cause and the impact. We show that the false positive ratio is very low, and our interactions with PetaStore operators confirm its usefulness.
One potential caveat is that Kaleidoscope assumes that Store-Pings experiences the same I/O behavior as real applications, which may not hold in all cases. On the other hand, using Kaleidoscope ML-components retrospectively on trace-data generated by Store-Ping monitors show that ML-methods captured majority of the failure and resource contention problems (see section 5).
Note that different applications may require different requirements of I/O completion time. For example, some applications are more tolerable to slow I/O response. Kaleidoscope does not understand application-level semantics but uses a system-wide threshold based on the service-level agreement (one second for PetaStore). An alternative we considered was an approach that inserts Store-Pings in the I/O path of the applications by automatic binary instrumentation or source code analysis. However, we find that this is not feasible in data center settings such as PetaStore, in which we have little control over applications, not to mention the concerns of correctness and performance overhead.
In the deployment at PetaStore, Kaleidoscope detects errors at the granularity of meta-data servers, data servers, LNET and object store devices. It cannot detect finer grained faults such as section errors (Bairavasundaram:2007, ; Schroeder:2010, ). It currently can only localize a network outage related I/O failure, instead of the specific network router, due to the randomness in network routing decisions. This is a deployment decision rather than a fundamental limitation of the methodology. To have more insights into the network, one can enhance the probes in Kaleidoscope based on network tomography (Zhang:2018, ; Tan:2019, ; Arzani:2018, ; Guo:2015, ; Geng:2019, ). Note that doing this brings benefits over existing network tomography (Zhang:2018, ; Tan:2019, ; Arzani:2018, ; Guo:2015, ; Geng:2019, ) as Kaleidoscope provides more and stronger capability (e.g., disambiguiting loads and failures) as discussed in §2.
7. Related Work
A number of efforts have been made to characterize and understand failures of individual hardware components (e.g., disks (Schroeder:2007, ; Schroeder:2010, ; Pinheiro:2007, ; Bairavasundaram:2007, ; Bairavasundaram:2008, ; Bairavasundaram:2008:2, ), memory (Narayanan:2016, ; Meza:2015, ; Schroeder:2016, ; Schroeder:2009, ; Sridharan:2015, ), and others (Jiang:2008, )) as well as file systems (Ganesan:2017, ; Rubio:2009, ; Lu:2013, ; Alagappan:2016, ; Prabhakaran:2005, ; Gunawi:2008, ; Pillai:2014, )). Compared with failure studies of individual storage system components, little prior work analyzed reliability of distributed file and storage systems. Ford et al. (Ford:2010, ) characterizes the availability of Google’s storage systems, with a focus on correlated failures. Our study is fundamentally different and complementary to the prior work. Our study characterizes the manifestation of both component failures and resource overload as performance issues.
Kaleidoscope is built upon the wealth body of work on failure detection (Leners:2011, ; Leners:2015, ; Huang:2018, ; Hayashibara:2004, ; Chandra:1996, ; Aguilera:2002, ; Huang:2017, ). In §2.1, we discuss the failure patterns that cannot be handled by the state-of-the-art failure detection methods. Panorama (Huang:2018, ) enhances observability to detect gray failures by inserting failure reporting code at observation points in the software programs. Kaleidoscope shares the same insight as Panorama that the ability of observing the system from the viewpoint of the clients is a necessity for monitoring complex distributed systems. On the other hand, we show that certain failure patterns cannot be detected by Panorama-like approach if they do not trigger exceptions in the client code. Kaleidoscope proactively probes the system to build observability with the goal of preventing client-perceived issues in the first place.
Active measurement has been used for networks monitoring and fault localization (Zhang:2018, ; Guo:2015, ; Tan:2019, ). Pingmesh (Guo:2015, ) asks every server in a data center to ping each other and uses the aggregated ping data for network latency analysis. NetBouncer (Tan:2019, ) leverages the IP-in-IP protocol supported by modern switches to actively probe selected network paths to pinpoint the faulty links and devices. Deepview (Zhang:2018, ) leverages monitoring data to diagnose virtual disk failures by triaging the root causes into compute, network, or storage tiers (it treats the entire storage cluster as a black box). Kaleidoscope fundamentally differs from the aforementioned methods in at least two aspects: 1) Kaleidoscope is the first effort for monitoring large-scale distributed file systems and the underlying storage infrastructure; 2) Kaleidoscope is able to differentiate reliability issues and performance issues—as discussed in §2.1, none of the network monitoring approach considers resource overload and contention; and 3) Kaleidoscope goes beyond a failure localization tool but can further pinpoint the root causes inside the unhealthy components.
8. Conclusion
Our study shows that reliability and performance are inter-related as component failures and resource contention both lead to I/O timeouts or slowdown which is hard to disambiguate. This paper advocates the need for identifying and diagnosing resource overload and reliability failures jointly to effectively coordinate recovery strategy. We build Kaleidoscope and deploy it on a peta-scale production system. Our evaluation and experience show that Kaleidoscope is effective in providing live forensic support for large-scale distributed systems with negligible overhead.
9. Acknowledgement*
We thank Larry Kaplan (Cray) and Gregory Bauer (NCSA) for having many insightful conversations.
This material is based upon work supported by the U.S. Department of Energy, Office of Science, Office of Advanced Scientific Computing Research, under Award Number 2015-02674. This work is partially supported by NSF CNS 13-14891, and an IBM faculty award.
This research is part of the Blue Waters sustained-petascale computing project, which is supported by the National Science Foundation (awards OCI-0725070 and ACI-1238993) and the state of Illinois. Blue Waters is a joint effort of the University of Illinois at Urbana-Champaign and its National Center for Supercomputing Application.
References
- (1) getloadavg - Linux man page. https://linux.die.net/man/3/getloadavg.
- (2) Jenkins CI/CD. https://jenkins.io/. Accessed: 2019-02-06.
- (3) . Lustre filesystem. http://lustre.org/. Accessed: 2019-02-06.
- (4) LUSTRE Community BOF: Lustre in HPC and Emerging Data Markets: Roadmap, Features and Challenges. https://sc18.supercomputing.org/proceedings/bof/bof_pages/bof176.html.
- (5) Parallel file system I/O Benchmark. https://github.com/LLNL/ior.
- (6) Aguilera, M. K., Lann, G. L., and Toueg, S. On the Impact of Fast Failure Detectors on Real-Time Fault-Tolerant Systems. In Proceedings of the 16th International Symposium on Distributed Computing (DISC’02) (Toulouse, France, Oct. 2002).
- (7) Alagappan, R., Ganesan, A., Patel, Y., Pillai, T. S., Arpaci-Dusseau, A. C., and Arpaci-Dusseau, R. H. Correlated Crash Vulnerabilities. In Proceedings of the 12th USENIX Symposium on Operating Systems Design and Implementation (OSDI’16) (Savannah, GA, November 2016).
- (8) Amazon. Amazong fsx for lustre. https://aws.amazon.com/fsx/lustre/. Accessed: 2017-12-06.
- (9) Arzani, B., Ciraci, S., Chamon, L., Zhu, Y., Liu, H., Padhye, J., Loo, B. T., and Outhred, G. 007: Democratically Finding the Cause of Packet Drops. In Proceedings of the 15th USENIX Symposium on Networked Systems Design and Implementation (NSDI’18) (Renton, WA, USA, Apr. 2018).
- (10) Avizienis, A., Laprie, J., Randell, B., and Landwehr, C. Basic concepts and taxonomy of dependable and secure computing. IEEE Transactions on Dependable and Secure Computing 1, 1 (2004), 11–33.
- (11) Azure Customer Advisory Team . Parallel Virtual File Systems on Microsoft Azure. https://azure.microsoft.com/mediahandler/files/resourcefiles/parallel-virtual-file-systems-on-microsoft-azure/Parallel_Virtual_File_Systems_on_Microsoft_Azure.pdf. Accessed: 2019-04-01.
- (12) Bairavasundaram, L. N., Arpaci-Dusseau, A. C., Arpaci-Dusseau, R. H., Goodson, G. R., and Schroeder, B. An analysis of data corruption in the storage stack. ACM Transactions on Storage (TOS) 4, 3 (2008), 8.
- (13) Bairavasundaram, L. N., Goodson, G. R., Pasupathy, S., and Schindler, J. An analysis of latent sector errors in disk drives. In Proceedings of the 2007 ACM SIGMETRICS International Conference on Measurement and Modeling of Computer Systems (SIGMETRICS’07) (San Diego, California, USA, June 2007).
- (14) Bairavasundaram, L. N., Goodson, G. R., Schroeder, B., Arpaci-Dusseau, A. C., and Arpaci-Dusseau, R. H. An Analysis of Data Corruption in the Storage Stack. In Proceedings of the 6th USENIX Conference on File and Storage Technologies (FAST’08) (San Jose, CA, Feb. 2008).
- (15) Bairavasundaram, L. N., Rungta, M., Agrawal, N., Arpaci-Dusseau, A. C., Arpaci-Dusseau, R. H., and Swift, M. M. Analyzing the Effects of Disk-Pointer Corruption. In Proceedings of the 2008 IEEE International Conference on Dependable Systems and Networks (DSN’08) (Anchorage, Alaska, June 2008).
- (16) Boyer, E. B., Broomfield, M. C., and Perrotti, T. A. Glusterfs one storage server to rule them all.
- (17) Breunig, M. M., Kriegel, H.-P., Ng, R. T., and Sander, J. Lof: Identifying density-based local outliers. SIGMOD Rec. 29, 2 (May 2000), 93–104.
- (18) Brown, A., and Patterson, D. A. Embracing failure: A case for recovery-oriented computing (roc). In High Performance Transaction Processing Symposium (2001), vol. 10, pp. 3–8.
- (19) Cao, Z., Tarasov, V., Raman, H. P., Hildebrand, D., and Zadok, E. On the performance variation in modern storage stacks. In 15th USENIX Conference on File and Storage Technologies (FAST 17) (2017), pp. 329–344.
- (20) Castro, Rui and Coates, Mark and Liang, Gang and Nowak, Robert and Yu, Bin. Network tomography: Recent developments. Statistical science (2004), 499–517.
- (21) Chandra, T. D., and Toueg, S. Unreliable Failure Detectors for Reliable Distributed Systems. Journal of the ACM 43, 2 (Mar. 1996), 225–267.
- (22) Chen, C., Chen, Y., and Roth, P. C. Dosas: Mitigating the resource contention in active storage systems. In 2012 IEEE International Conference on Cluster Computing (Sep. 2012), pp. 164–172.
- (23) Felber, P., Defago, X., Guerraoui, R., and Oser, P. Failure detectors as first class objects. In Proceedings of the International Symposium on Distributed Objects and Applications (Sep. 1999), pp. 132–141.
- (24) Ford, D., Labelle, F., Popovici, F. I., Stokely, M., Truong, V.-A., Barroso, L., Grimes, C., and Quinlan, S. Availability in Globally Distributed Storage Systems. In Proceedings of the 9th USENIX Symposium on Operating Systems Design and Implementation (OSDI’10) (Vancouver, BC, Canada, Oct. 2010).
- (25) Ganesan, A., Alagappan, R., Arpaci-Dusseau, A. C., and Arpaci-Dusseau, R. H. Redundancy Does Not Imply Fault Tolerance: Analysis of Distributed Storage Reactions to File-System Faults. In Proceedings of the 15th USENIX Conference on File and Storage Technologies (FAST’17) (Santa Clara, CA, Feb. 2017).
- (26) Geng, Y., Liu, S., Yin, Z., Naik, A., Prabhakar, B., Rosenblum, M., and Vahdat, A. SIMON: A Simple and Scalable Method for Sensing, Inference and Measurement in Data Center Networks. In Proceedings of the 16th USENIX Symposium on Networked Systems Design and Implementation (NSDI’19) (Boston, MA, USA, Feb. 2019).
- (27) Gunawi, H. S., Rubio-González, C., Arpaci-Dusseau, A. C., Arpaci-Dusseau, R. H., and Liblit, B. EIO: Error Handling is Occasionally Correct. In Proceedings of the 6th USENIX Conference on File and Storage Technologies (FAST’08) (San Jose, CA, USA, Feb. 2008).
- (28) Gunawi, H. S., Suminto, R. O., Sears, R., Golliher, C., Sundararaman, S., Lin, X., Emami, T., Sheng, W., Bidokhti, N., McCaffrey, C., et al. Fail-slow at scale: Evidence of hardware performance faults in large production systems. ACM Transactions on Storage (TOS) 14, 3 (2018), 23.
- (29) Guo, C., Yuan, L., Xiang, D., Dang, Y., Huang, R., Maltz, D., Liu, Z., Wang, V., Pang, B., Chen, H., Lin, Z.-W., and Kurien, V. Pingmesh: A Large-Scale System for Data Center Network Latency Measurement and Analysis. In Proceedings of the 2015 ACM SIGCOMM Conference (SIGCOMM’15) (London, United Kingdom, Aug. 2015).
- (30) Hayashibara, N., Défago, X., Yared, R., and Katayama, T. The Accrual Failure Detector. In Proceedings of the 23rd IEEE International Symposium on Reliable Distributed Systems (SDRS’04) (Florianópolis, Brazil, Oct. 2004).
- (31) Heichler, J. An introduction to BeeGFS, 2014.
- (32) Holland, M., and Gibson, G. Parity declustering for continuous operation in redundant disk arrays. Tech. rep., CARNEGIE-MELLON UNIV PITTSBURGH PA SCHOOL OF COMPUTER SCIENCE, 1992.
- (33) Huang, P., Guo, C., Lorch, J. R., Zhou, L., and Dang, Y. Capturing and Enhancing In Situ System Observability for Failure Detection. In Proceedings of the 13th USENIX Symposium on Operating Systems Design and Implementation (OSDI’18) (Carlsbad, CA, USA, Oct. 2018).
- (34) Huang, P., Guo, C., Zhou, L., Lorch, J. R., Dang, Y., Chintalapati, M., and Yao, R. Gray Failure: The Achilles’ Heel of Cloud-Scale Systems. In Proceedings of the 16th Workshop on Hot Topics in Operating Systems (HOTOS’17) (Whistler, BC, Canada, May 2017).
- (35) Ji, X., Yang, B., Zhang, T., Ma, X., Zhu, X., Wang, X., El-Sayed, N., Zhai, J., Liu, W., and Xue, W. Automatic, application-aware i/o forwarding resource allocation. In 17th USENIX Conference on File and Storage Technologies (FAST 19) (2019), pp. 265–279.
- (36) Jiang, W., Hu, C., Zhou, Y., and Kanevsky, A. Are Disks the Dominant Contributor for Storage Failures?: A Comprehensive Study of Storage Subsystem Failure Characteristics. In Proceedings of the 6th USENIX Conference on File and Storage Technologies (FAST’08) (San Jose, CA, Feb. 2008).
- (37) Jones, E., Oliphant, T., and Peterson, P. SciPy: Open source scientific tools for Python.
- (38) Kalbarczyk, Z., Iyer, R. K., and Wang, L. Application fault tolerance with armor middleware. IEEE Internet Computing 9, 2 (March 2005), 28–37.
- (39) Khan, O., Burns, R., Plank, J. S., Pierce, W., and Huang, C. Rethinking erasure codes for cloud file systems: Minimizing I/O for recovery and degraded reads. In FAST-2012: 10th Usenix Conference on File and Storage Technologies (San Jose, February 2012).
- (40) Khan, O., Burns, R. C., Plank, J. S., and Huang, C. In search of i/o-optimal recovery from disk failures. In HotStorage (2011).
- (41) Kim, S., Kim, H., Lee, J., and Jeong, J. Enlightening the i/o path: a holistic approach for application performance. In 15th USENIX Conference on File and Storage Technologies (FAST 17) (2017), pp. 345–358.
- (42) Koller, D., Friedman, N., and Bach, F. Probabilistic graphical models: principles and techniques. MIT press, 2009.
- (43) Kraft, S., Casale, G., Krishnamurthy, D., Greer, D., and Kilpatrick, P. Performance models of storage contention in cloud environments. Software & Systems Modeling 12, 4 (Oct 2013), 681–704.
- (44) Leners, J. B., Gupta, T., Aguilera, M. K., and Walfish, M. Taming uncertainty in distributed systems with help from the network. In Proceedings of the Tenth European Conference on Computer Systems (New York, NY, USA, 2015), EuroSys ’15, ACM, pp. 9:1–9:16.
- (45) Leners, J. B., Gupta, T., Aguilera, M. K., and Walfish, M. Taming Uncertainty in Distributed Systems with Help from the Network. In Proceedings of the 10th European Conference on Computer Systems (EuroSys’15) (Bordeaux, France, Apr. 2015).
- (46) Leners, J. B., Wu, H., Hung, W.-L., Aguilera, M. K., and Walfish, M. Detecting failures in distributed systems with the falcon spy network. In Proceedings of the Twenty-Third ACM Symposium on Operating Systems Principles (2011), ACM, pp. 279–294.
- (47) Leners, J. B., Wu, H., Hung, W.-L., Aguilera, M. K., and Walfish, M. Detecting Failures in Distributed Systems with the Falcon Spy Network. In Proceedings of the 23rd ACM Symposium on Operating Systems Principles (SOSP’11) (Cascais, Portugal, Oct. 2011).
- (48) Lu, L., Arpaci-Dusseau, A. C., Arpaci-Dusseau, R. H., and Lu, S. A Study of Linux File System Evolution. In Proceedings of the 11th USENIX Conference on File and Storage Technologies (FAST’13) (San Jose, CA, Feb. 2013).
- (49) Ma, A., Traylor, R., Douglis, F., Chamness, M., Lu, G., Sawyer, D., Chandra, S., and Hsu, W. Raidshield: characterizing, monitoring, and proactively protecting against disk failures. ACM Transactions on Storage (TOS) 11, 4 (2015), 17.
- (50) Ma, L., He, T., Swami, A., Towsley, D., Leung, K. K., and Lowe, J. Node Failure Localization via Network Tomography. In Proceedings of the 2014 Conference on Internet Measurement Conference (New York, NY, USA, 2014), IMC ’14, ACM, pp. 195–208.
- (51) Meza, J., Wu, Q., Kumar, S., and Mutlu, O. A Large-Scale Study of Flash Memory Failures in the Field. In Proceedings of the 2015 ACM SIGMETRICS International Conference on Measurement and Modeling of Computer Systems (SIGMETRICS’15) (Portland, Oregon, USA, June 2015).
- (52) Mogul, J. C., Isaacs, R., and Welch, B. Thinking about Availability in Large Service Infrastructures. In Proceedings of the 16th Workshop on Hot Topics in Operating Systems (HOTOS’17) (Whistler, BC, Canada, May 2017).
- (53) Muntz, R. R., and Lui, J. C. Performance analysis of disk arrays under failure. Computer Science Department, University of California, 1990.
- (54) Narayanan, I., Wang, D., Jeon, M., Sharma, B., Caulfield, L., Sivasubramaniam, A., Cutler, B., Liu, J., Khessib, B., and Vaid, K. SSD Failures in Datacenters: What? When? And Why? In Proceedings of the 9th ACM International on Systems and Storage Conference (SYSTOR’16) (Haifa, Israel, June 2016).
- (55) Neal, R. M. Probabilistic inference using markov chain monte carlo methods.
- (56) Pillai, T. S., Chidambaram, V., Alagappan, R., Al-Kiswany, S., Arpaci-Dusseau, A. C., and Arpaci-Dusseau, R. H. All File Systems Are Not Created Equal: On the Complexity of Crafting Crash-Consistent Applications. In Proceedings of the 11th USENIX Symposium on Operating Systems Design and Implementation (OSDI’14) (Broomfield, CO, Oct. 2014).
- (57) Pinheiro, E., Weber, W.-D., and Barroso, L. A. Failure Trends in a Large Disk Drive Population. In Proceedings of the 5th USENIX Conference on File and Storage Technologies (FAST’07) (San Jose, CA, Feb. 2007).
- (58) Prabhakaran, V., Arpaci-Dusseau, A. C., and Arpaci-Dusseau, R. H. Model-Based Failure Analysis of Journaling File Systems. In Proceedings of the 2005 IEEE International Conference on Dependable Systems and Networks (DSN’05) (Yokohama, Japan, June 2005).
- (59) Rubio-González, C., Gunawi, H. S., Liblit, B., Arpaci-Dusseau, R. H., and Arpaci-Dusseau, A. C. Error Propagation Analysis for File Systems. In Proceedings of the 30th Annual ACM SIGPLAN Conference on Programming Language Design and Implementation (PLDI’09) (Dublin, Ireland, June 2009).
- (60) Salvatier, J., Wiecki, T. V., and Fonnesbeck, C. Probabilistic programming in python using pymc3. PeerJ Computer Science 2 (Apr. 2016), e55.
- (61) Schmuck, Frank B and Haskin, Roger L. GPFS: A Shared-Disk File System for Large Computing Clusters. In FAST (2002), vol. 2.
- (62) Schroeder, B., Damouras, S., and Gill, P. Understanding latent sector errors and how to protect against them. In Proceedings of the 8th USENIX Conference on File and Storage Technologies (FAST’10) (San Jose, CA, USA, Feb. 2010).
- (63) Schroeder, B., and Gibson, G. A. Disk Failures in the Real World: What Does an MTTF of 1,000,000 Hours Mean to You? In Proceedings of the 5th USENIX Conference on File and Storage Technologies (FAST’07) (San Jose, CA, Feb. 2007).
- (64) Schroeder, B., Lagisetty, R., and Merchant, A. Flash Reliability in Production: The Expected and the Unexpected. In Proceedings of the 14th USENIX Conference on File and Storage Technologies (FAST’16) (Santa Clara, CA, USA, Feb. 2016).
- (65) Schroeder, B., Pinheiro, E., and Weber, W.-D. DRAM Errors in the Wild: A Large-scale Field Study. In Proceedings of the 2009 ACM SIGMETRICS International Conference on Measurement and Modeling of Computer Systems (SIGMETRICS’09) (Seattle, WA, USA, June 2009).
- (66) Semeraro, B. D., Sisneros, R., Fullop, J., and Bauer, G. H. It takes a village: Monitoring the blue waters supercomputer. In 2014 IEEE International Conference on Cluster Computing (CLUSTER) (Sep. 2014), pp. 392–399.
- (67) Sridharan, V., DeBardeleben, N., Blanchard, S., Ferreira, K. B., Stearley, J., Shalf, J., and Gurumurthi, S. Memory Errors in Modern Systems: The Good, The Bad, and The Ugly. In Proceedings of the 20th International Conference on Architectural Support for Programming Languages and Operating Systems (ASPLOS’15) (Istanbul, Turkey, Mar. 2015).
- (68) Taerat, N., Brandt, J., Gentile, A., Wong, M., and Leangsuksun, C. Baler: deterministic, lossless log message clustering tool. Computer Science-Research and Development 26, 3-4 (2011), 285.
- (69) Tan, C., Jin, Z., Guo, C., Zhang, T., Wu, H., Deng, K., Bi, D., and Xiang, D. Netbouncer: active device and link failure localization in data center networks. In Proceedings of the 16th USENIX Conference on Networked Systems Design and Implementation (2019), USENIX Association, pp. 599–613.
- (70) Tan, C., Jin, Z., Guo, C., Zhang, T., Wu, H., Deng, K., Bi, D., and Xiang, D. NetBouncer: Active Device and Link Failure Localization in Data Center Networks. In Proceedings of the 16th USENIX Symposium on Networked Systems Design and Implementation (NSDI’19) (Boston, MA, USA, Feb. 2019).
- (71) van Renesse, R., Minsky, Y., and Hayden, M. A gossip-style failure detection service. In Proceedings of the IFIP International Conference on Distributed Systems Platforms and Open Distributed Processing (London, UK, UK, 1998), Middleware ’98, Springer-Verlag, pp. 55–70.
- (72) Wan, J., Wang, J., Yang, Q., and Xie, C. S2-raid: A new raid architecture for fast data recovery. In 2010 IEEE 26th Symposium on Mass Storage Systems and Technologies (MSST) (2010), IEEE, pp. 1–9.
- (73) Weil, S. A., Brandt, S. A., Miller, E. L., Long, D. D., and Maltzahn, C. Ceph: A scalable, high-performance distributed file system. In Proceedings of the 7th symposium on Operating systems design and implementation (2006), USENIX Association, pp. 307–320.
- (74) Wu, M., Sun, X.-H., and Jin, H. Performance under failures of high-end computing. In Proceedings of the 2007 ACM/IEEE Conference on Supercomputing (New York, NY, USA, 2007), SC ’07, ACM, pp. 48:1–48:11.
- (75) Wu, S., Jiang, H., Feng, D., Tian, L., and Mao, B. Workout: I/o workload outsourcing for boosting raid reconstruction performance. In FAST (2009), vol. 9, pp. 239–252.
- (76) Xin, Q., Miller, E. L., Schwarz, S. J. T. J. E., and Long, D. D. E. Impact of failure on interconnection networks for large storage systems. In 22nd IEEE / 13th NASA Goddard Conference on Mass Storage Systems and Technologies (MSST’05) (April 2005), pp. 189–196.
- (77) Zhang, Q., Yu, G., Guo, C., Dang, Y., Swanson, N., Yang, X., Yao, R., , Chintalapati, M., Krishnamurthy, A., and Anderson, T. Deepview: Virtual Disk Failure Diagnosis and Pattern Detection for Azure. In Proceedings of the 15th USENIX Symposium on Networked Systems Design and Implementation (NSDI’18) (Renton, WA, USA, Apr. 2018).