High Fidelity Imaging of the Inner AU Mic Debris Disk: Evidence of Differential Wind Sculpting?
Abstract
We present new high fidelity optical coronagraphic imagery of the inner 50 au of AU Mic’s edge-on debris disk using the BAR5 occulter of the Hubble Space Telescope Imaging Spectrograph (HST/STIS) obtained on 26-27 July 2018. This new imagery reveals that “feature A”, residing at a projected stellocentric separation of 14.2 au on SE-side of the disk, exhibits an apparent “loop-like” morphology at the time of our observations. The loop has a projected width of 1.5 au and rises 2.3 au above the disk midplane. We also explored TESS photometric observations of AU Mic that are consistent with evidence of two starspot complexes in the system. The likely co-alignment of the stellar and disk rotational axes breaks degeneracies in detailed spot modeling, indicating that AU Mic’s projected magnetic field axis is offset from its rotational axis. We speculate that small grains in AU Mic’s disk could be sculpted by a time-dependent wind that is influenced by this offset magnetic field axis, analogous to co-rotating Solar interaction regions that sculpt and influence the inner and outer regions of our own Heliosphere. Alternatively, if the observed spot modulation is indicative of a significant mis-alignment of the stellar and disk rotational axes, we suggest the disk could still be sculpted by the differential equatorial versus polar wind that it sees with every stellar rotation.
1 Introduction
AU Mic is a nearby (9.8 pc; Gaia Collaboration et al. 2018), M1Ve star that is a member of the 233 Myr old Pic moving group (Mamajek & Bell, 2014). Since the discovery and early observations of the spatially resolved, edge-on debris disk associated with the system (Kalas et al., 2004; Liu, 2004) that is gas poor (Roberge et al., 2005), subsequent high contrast imaging has probed the structure of disk in scattered light from projected stellocentric radii of 10 au (Wang et al., 2015) to 210 au (Schneider et al., 2014), as well as distances in between (Metchev et al., 2005; Krist et al., 2005; Graham et al., 2007; Fitzgerald et al., 2007; Boccaletti et al., 2015, 2018). Along with longer wavelength mm observations, these data suggest the general architecture of AU Mic’s debris system might be similar to the asteroid belt and Kuiper Belt in our own Solar System. AU Mic has a ‘birth ring’ of material near 43 au that forms micron-sized particles from collisions between larger bodies (see e.g. Strubbe & Chiang 2006; Graham et al. 2007; MacGregor et al. 2013; Matthews et al. 2015), as well as an extended halo comprised of approximately micron-sized grains (Matthews et al., 2015). While it has been suggested that the inner (< 30 au) disk is devoid of small, micron-sized grains (Strubbe & Chiang, 2006), recent observations suggest at least some small grains still exist here (Lomax et al., 2018). Early searches for planets in the system yielded null results (Hebb et al., 2007; Metchev et al., 2005); however, Plavchan+ (2019, submitted) presents the observational detection of the inner planetary population in the system.
AU Mic is particularly notable in that it is the first spatially resolved debris disk where dynamical processes in the disk are being resolved on year timescales. Boccaletti et al. (2015) analyzed multi-epoch imagery of the disk and discovered at least five spatially resolved features on the SE-side of the disk that clearly change location as a function of time, with measured projected tangential speeds of some features indicating they are moving on unbound, non-Keplerian trajectories. Follow-up studies have identified additional moving features on both the SE- and NW-sides of the disk, and revealed that these features also exhibit vertical (perpendicular to the disk mid-plane) motion (e.g. Boccaletti et al. 2018 and Grady et al 2019, submitted). More recently, Lomax et al. (2018) noted a change in the color of the disk between 30-45au from being “increasingly bluer with stellocentric distance” (Krist et al., 2005; Metchev et al., 2005; Fitzgerald et al., 2007) to a constant, smaller blue color, suggesting a reduction in the relative number of small grains at these stellocentric distances that could be causally correlated to the passage of fast-moving features seen in broad-band scattered light imagery.
The mechanism(s) driving the observed variability in AU Mic’s debris disk remain hotly debated within the literature. Sezestre et al. (2017) suggest the moving dust features are either generated by resonance with a parent body that orbits at 82 au or at a recent large collision that generated a large population of smaller bodies, which are then dispersed by the stellar wind. Chiang & Fung (2017) proposed that the moving features in AU Mic’s disk are caused by the interaction between the star’s wind and repeated “dust avalanche” events. These avalanches are triggered in a zone marked by the intersection of AU Mic’s primary debris ring and a proposed secondary ring of dust left behind by the catastrophic disruption of an object up to the size of the Kuiper Belt Object Varuna (radius 450km; Lellouch et al. 2013). Both Chiang & Fung (2017) and Daley et al. (2019) discuss some of the potential challenges to this avalanche scenario. Chiang & Fung (2017) also predicts a vertical velocity component in moving features caused by the star’s magnetized wind exerting a Lorentz force on the dust grains, potentially regulated by the stellar magnetic activity cycle. These dynamical models assume significantly different wind properties: Sezestre et al. (2017) adopt a constant wind that induces a mass-loss rate that is 50x Solar, whereas Chiang & Fung (2017) adopt a variable wind that induces a mass-loss rate that is 500x-5000x Solar (see also Boccaletti et al. 2018). While Augereau & Beust (2006) and Schüppler et al. (2015) detail why AU Mic’s mass-loss rate is expected to be larger than that of the Sun; this mass-loss rate has not been observationally confirmed (e.g. Wood et al. 2005). Sezestre et al. (2017) note that these dramatically different mass-loss rates have profound impacts on the grain blowout sizes that would be in operation.
In this paper, we present new white-light optical coronagraphic imagery of the inner region of AU Mic’s disk obtained with the Hubble Space Telescope Imaging Spectrograph (HST/STIS) in 2018 using the BAR5 occulter. We describe the acquisition and reduction of these data in Section 2. We highlight the new morphologies of AU Mic’s disk revealed by these data, including dramatic apparent loop-like structures seen in projection, in Section 3. We explore some of the potential mechanisms that could create these morphological features in the context of preliminary analysis of new constraints on the star’s activity as enabled by NASA/TESS data in Section 4.
2 HST BAR5 Coronagraphic Imagery
Coronagraphic observations of AU Mic and associated point spread function (PSF) template star HD 191849 were obtained with the HST/STIS BAR5 occulter, a 015-wide rectangular bar, in GO-15219 (J. Wisniewski PI). The 50CORON imaging mode used provided an unfiltered spectral passband of pivot wavelength 0.575 m with FWHM = 0.433 m, an image scale of 50.77 mas pixel-1, and spatial resolution of 72 mas.
Observations of AU Mic were obtained in three sequential orbits on 26-27 July 2018 using a sub-array readout that sampled the inner 25 (100 pixels) of the disk. The major axis of the disk was oriented approximately orthogonal to the long axis of the BAR5 occulter in the second orbit, and the telescope was rolled by 6.5∘ in the first and third orbits. Within each orbit, 20-21 images of 16.6 second duration were obtained at each of three cross-BAR5 dither positions offset by (-1/4, 0, +1/4) pixels orthogonally with respect to the midline of the occulter. HD 191849 was observed immediately thereafter using two sequential orbits, using the same cross-BAR5 dither technique, as a PSF reference. 22-26 images per dither location were obtained using 11.5 second per image integrations. We also obtained a single-orbit observation of AU Mic on 22 Sept 2018 with the disk aligned along the long axis of the BAR5 occulter, using the same dither and integration scheme described above. These disk-obscured images provide perfect color-matching to explore alternate methods to achieve better PSF subtraction.
These data were reduced and calibrated using the same procedures and techniques as outlined in Schneider et al. (2018). Following bias, dark, and flat field correction using the temporally nearest calibration data, we located the position of the occulted star in each image using the "X marks the spot" diffraction spike fitting method of Schneider et al. (2014). Within each orbit, all images observed with the same dither position were then median combined and cleaned of cosmic-rays. Image co-registration, and later PSF subtractions, were done with sinc-apodized bi-cubic sub-pixel interpolation using the IDL-based, IDP3 software (Stobie & Ferro, 2006). The relative brightness and (x,y) position of the PSF star HD 191849 were treated, and iteratively adjusted, as free parameters to minimize the variance in difference image pixels not dominated by disk flux.
We found that while chromatic residuals were fully mitigated with our disk-obscurred BAR5 observation of AU Mic on 22 Sept 2018, using this orbit as a PSF template led to substantial PSF subtraction residuals caused by differential wavefront errors induced by the non-contemporaneous (e.g. 2 month separation) of this observation from our 3 sequential orbits that resolved AU Mic’s disk. We therefore adopt and use our sequentially contemporaneous observations of HD 191849 as the PSF reference for our final disk imagery. Following PSF-subtraction, our multi-roll images were re-oriented to a common orientation and median combined after masking known imaging artifacts.
3 Analysis
3.1 HST Imaging Results
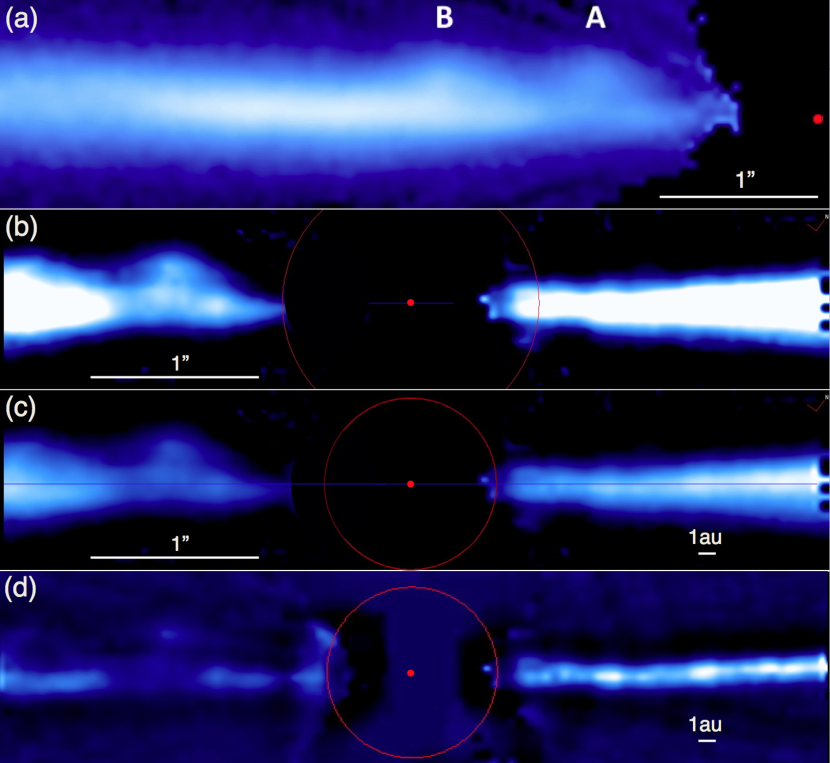
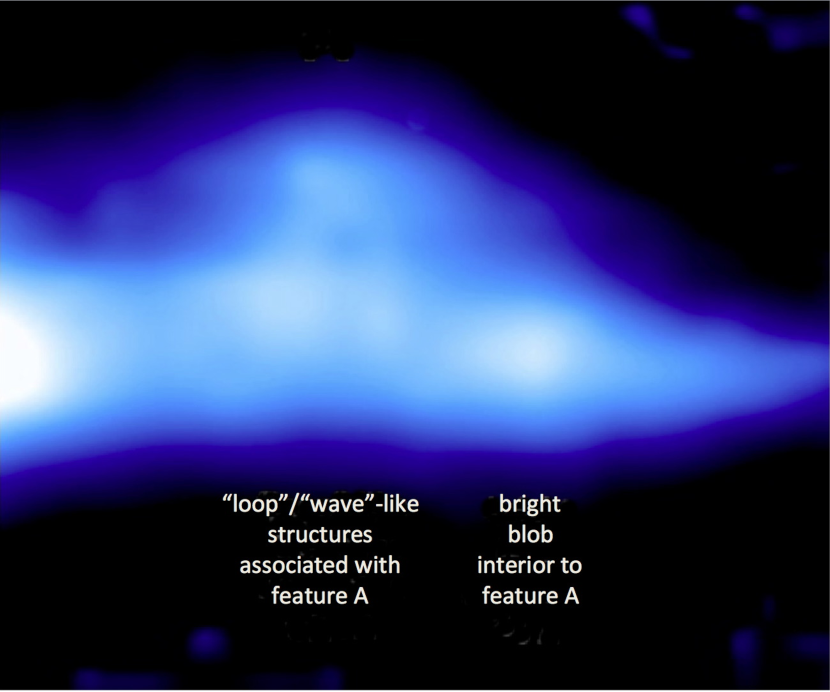
We display our resultant PSF-subtracted imagery of AU Mic taken with STIS’ BAR5, after 1/r2 intensity scaling, in panels b-d of Figure 1, along with 2017-epoch WedgeA0.6 imagery of the inner disk from Grady et al (2019, submitted) in panel a. The superlative sub-pixel dithering of our BAR5 data provide an enhanced view of the morphology of feature A in the disk, compared to 2017-epoch WedgeA0.6 data. In particular, Figure 1 (panels b-c) and Figure 2 reveals feature A has a distinctive “loop-like” appearance. It is not possible to determine whether the “loop-like” morphology of feature A remains coherent as the feature moves within the disk, due to the single-epoch nature of these high resolution data. As feature A is moving radially at 1.7 STIS pixels yr-1 (i.e. 1.2 resolution elements yr-1; Grady 2019, submitted), annual observations are commensurate with resolvable motions of this sub-structure. HST GO-15907 is pursuing these observations and could enable discrimination of the potential role of projection. Moreover, a larger portion of the disk will be read-out in these planned observations, allowing us to determine whether other known moving features in the disk exhibit loop-like morphologies similar to that found for feature A.
To further explore new information encoded within these high-resolution BAR5 imagery, we applied a high-pass filter to these data (panel d, Figure 1). We fit two 1-dimensional Guassians to the loop-like structure to quantify its size and projected location. These fits reveal the loop-like structure has a projected width of 1.5 au and rises to a projected height above the midplane of 2.3 au. The centroid of these fits also imply the loop-like structure resides at a projected stellocentric radial distance of 14.2 au from the host star.
3.2 TESS Photometry
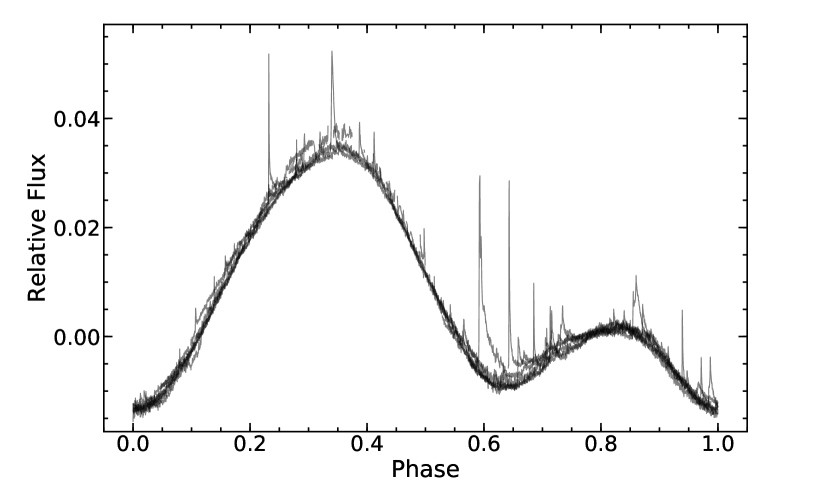
AU Mic was observed at 2 minute cadence in Sector 1 (25 July 2018 - 22 August 2018) by the Transiting Exoplanet Survey Satellite (TESS) (Ricker et al., 2015). We find the data exhibit a 4.86 day periodicity arising from starspot-induced stellar activity, as seen in the phase-folded light curve shown in Figure 3. This best-fit periodicity is very similar to that derived from Lomb-Scargle fitting (4.875 days) (Lomb, 1976; Scargle, 1982). Two large, persistent spot complexes are clearly visible from the phase-folded light curve for 60% and 40% of the rotational period of the star respectively.
3.3 Starspot Modeling
Extracting robust information about the surface distribution of star spots and spot complexes from traditional spot modeling is often not possible as there exists a degeneracy between the stellar inclination and spot latitude (Walkowicz et al., 2013). One can break this degeneracy in special cases, such as transiting planetary systems (Morris et al., 2017) or systems where the evolution of multiple spots can place weak constraints on their location (Davenport et al., 2015). AU Mic is well known to have a spatially resolved, edge-on debris disk; hence, it represents another case where we have good confidence about the stellar inclination axis, assuming the disk’s rotational axis is co-aligned. This assumption is supported by Watson et al. (2011), who report the inclination of the disk (90∘) to be the same as stellar rotational axis (90), and is consistent with the small level of mutual inclination between the disk and stellar rotational axis () found by Greaves et al. (2014). Even in debris disk systems that have resolved disks and directly imaged planets with evidence of mutual misalignment, such as beta Pic b, the amplitude of this misalignment is small (3 ∘).
Walkowicz et al. (2013) showed that the fraction of time that spots are visible in a system whose stellar inclination is seen edge-on, i.e. i = 90∘, is a nearly uniform 55% of its rotational period, that rises to 60% near polar latitudes. Figure 3 demonstrates that the smaller amplitude spot complex in AU Mic’s phase-folded light curve persists for 40% of the star’s rotational period, which is not expected for standard edge-on systems (Walkowicz et al., 2013). Resolving this discrepancy demands relaxing the fundamental assumption of Walkowicz et al. (2013) that the rotational and magnetic field axes are co-aligned.
We utilize the starspot modeling software STSP developed by L. Hebb (2019, in preparation), as described in detail within Davenport et al. (2015), to model the TESS data. This software generates synthetic light curves for a star having a pre-defined number of static spots (or spot complexes), and computes spot properties (latitude, longitude, radius) from a comparison between computed synthetic fluxes and observed fluxes using a Markov Chain Monte Carlo routine based on Foreman-Mackey et al. (2013). We used 50 parameter space walkers, with 20,000 steps in the MCMC chain.
We further explored the possibility of a mis-aligned B field in the system via a proxy, namely by varying the star’s “rotation axis” using a grid of MCMC runs from 90∘ (i.e. edge-on) to 30∘ in steps of . Finding evidence of a preferred non-edge-on orientation via this modeling (given the evidence we have that the stellar rotational axis is co-aligned with the edge-on disk) serves as a proxy for the potential B field mis-alignment. Full 20,000 step MCMC explorations were independently run for each inclination, and the best (lowest ) solution from the converged portion of the chains was considered. This grid found the rotation axis is weakly constrained from the starspot data alone, with the best model of being only slightly preferred () over the edge-on solution. The STSP models more strongly rule out highly inclined scenarios of and . Thus, since we know the system inclination is likely edge-on from our spatially resolved imagery, the STSP results support the suggestion that the effective B field of AU Mic is mis-alignment with its rotational axis. Further quantifying the detailed topology of AU Mic’s B field via Zeeman-Doppler Imaging is strongly encouraged.
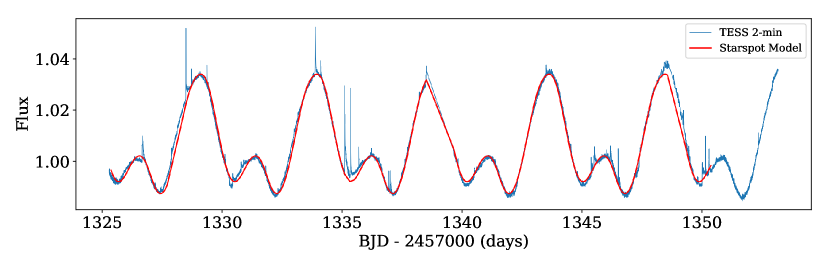
The resultant best fit synthetic spot modeling light curve is shown in Figure 4 (red), along with the underlying TESS data (blue). The most likely relative latitude/longitude distribution of the two spot complexes in AU Mic are depicted in the bottom panels of Figure 4. We find the separation of the spots in latitude is significant, with one spot near the equator (9∘) and the second spot at higher latitutde (44∘). The spots are separated by in longitude.
4 Discussion
4.1 Origin of AU Mic’s Loop-like Disk Structure
Multi-epoch ground-based near-IR coronagraphic imagery of AU Mic’s disk (Boccaletti et al., 2018), confirmed by higher photometric fidelity multi-epoch space-based optical coronagraphic imagery (Grady et al 2019, submitted) has revealed evidence that the projected distribution of disk material evolves on both the projected vertical and radial directions. The detailed vertical evolution of these structures has been hard to quantify, given the sparse sampling of available high fidelity observations. The vertical extension and evolution of these features necessarily requires the presence of non-radial forces. Chiang & Fung (2017) suggested, for example, that the star’s magnetized wind could exhibit a Lorentz force on grains and produce the vertical unduluations observed in spatially resolved imagery if the polarity of the stellar magnetic field reverses periodically. The striking projected structure that our new HST imagery has revealed for feature A (Figures 1 - 2), i.e. a “loop-like” morphology, is suggestive that material is actively being lifted both above the midplane and back down towards the midplane on short time-scales (i.e. significantly shorter than what could be caused by a change in the stellar magnetic field polarity). One potential way to produce such morphologies on this time-scale is if the disk is sculpted by a time-variable stellar wind. As discussed below, we suggest that a mis-alignment between the stellar B field and disk rotational axis (that is co-aligned with the stellar rotational axis) and/or a mis-alignment between the stellar rotational axis (co-aligned with the B field axis) and disk rotational axis could lead to the disk seeing different amounts of polar vs equatorial wind over time, producing morphological structure within the disk.
4.2 Evidence of Mis-aligned B Field and Potential Ramifications
We have shown in Section 3.3 that AU Mic’s edge-on debris disk allows a plausible way to break the spot latitude vs. stellar inclination degeneracy and place constraints on the latitude of spots in the system (Figure 4). Walkowicz et al. (2013) aptly demonstrated that the fraction of time that spots are visible in a system whose stellar inclination is seen edge-on, i.e. i = 90∘, is a nearly uniform 55% of its rotational period, that rises to 60% near polar latitudes. AU Mic’s phase-folded light curve (Figure 3) clearly violates this expectation, as its weaker amplitude spot is visible for 40% of its rotational phase. Since we know AU Mic’s stellar rotational axis with high confidence from its resolved disk (and studies that indicate minimal mis-alignment between the disk and stellar rotational axis, see e.g. Watson et al. 2011; Greaves et al. 2014), this implies that it must have an offset magnetic field axis. Indeed, our spot modeling in Section 3.3 supported this offset magnetic field interpretation. Offset magnetic field axes have been proposed in other dM systems like GJ 1243 (Davenport et al., 2015), and other astrophysical systems like magnetically confined disks surrounding massive B-type stars (Townsend et al., 2005; Townsend & Owocki, 2005).
We consider the potential implications of AU Mic having a magnetic field axis that is offset from its rotational axis, and in particular the implications that this could have on its extended debris disk. Vidotto et al. (2014) found that non-axisymmetric surface magnetic fields can lead to more asymmetric mass fluxes. A common feature of the two leading dynamical models to explain the super-Keplerian motion of moving features in AU Mic’s disk is that both invoke the system’s stellar wind to disperse dust grains (Sezestre et al., 2017; Chiang & Fung, 2017). We speculate that small grains in AU Mic’s disk could be sculpted by a time-dependent wind, that could not only be enhanced by potentially large coronal mass ejections (Boccaletti et al., 2015) but also be influenced by the system having an offset B field axis. A potential analogy in the Sun are the interactions between the fast Solar wind, that exits through coronal holes, and the slower Solar wind, which creates stream interaction regions that co-rotate with the Sun (Richardson, 2018). The effects of these Solar interaction regions have been observed by the Voyager 1 and 2 and Pioneer 10 missions, including at stellocentric separations from the Sun (16 au) similar to the current projected location of feature A in AU Mic (Burlaga et al., 1984; Burlaga, 1988; Gazis et al., 1999; Richardson, 2018). These time-dependent interaction regions create large-scale spiral density features that affect both the radial and vertical distribution of material in the Heliosphere. If analogous interaction regions exist around AU Mic, this could serve as one mechanism that could contribute to shaping the projected radial and vertical evolution of dust grains in AU Mic’s disk, as diagnosed by spatially resolved imagery. Although beyond the scope of this Letter, detailed dynamical modeling of such co-rotating interaction regions in the AU Mic system should be pursued. It could also be interesting to explore the magnetic field structure of other M-type debris disks that exhibit potential spiral-like structures, such as TWA 7 (Olofsson et al., 2018), to help assess whether they exhibit similarities to the AU Mic system.
4.3 Alternate Forms of Mis-alignment and Potential Ramifications
Our spot modeling (Section 3.3) and the associated interpretation of these results (Section 4.2) utilized previous research and observational properties of the system that indicated co-alignment of AU Mic’s stellar and disk rotational axes. We remark that if we relax this co-alignment prior, the observed phase-dependence of AU Mic’s spot coverage (two spot complexes visible for 60% and 40% of the rotational period respectively) would demand mis-alignment between the edge-on disk and the stellar rotational axis. In such a scenario, our available data would not place constraints on the relative orientation of the B field. However, this mis-alignment would expose the disk to seeing different amounts of the equatorial versus more polar wind with each rotation of the star. We thus suggest that small grains in AU Mic’s disk could be similarly sculpted by such a time-dependent wind.
4.4 Using Edge-on Disks to Break Starspot Modeling Degeneracies
The advent of high precision, high cadence, long duration photometric datasets from space-based missions like Kepler and TESS provide a unique opportunity to identify and characterize stellar activity arising from spot modulation across a large sample of low mass stars. We remark that our work with AU Mic reveals another unique way to break the degeneracy between stellar inclination and spot latitudes. Much like the special case of transiting planetary systems, whereby the presence of a transit allows one to deduce the stellar inclination angle with high precision (Morris et al., 2017), the subset of circumstellar disk systems that offer detailed inclination angle information (e.g. as measured from spatially resolved imaging for both edge-on, face-on, and intermediate inclination systems, or as inferred from photometric behavior like so-called “dipper” systems, which could suggest a likely near edge-on inclination (Cody et al., 2014)) could provide another way to break key degeneracies in spot modeling. In particular, leveraging system inclinations from disk properties could enable one to map the detailed distribution of starspots and the prevalence of offset magnetic field axes from a large statistical sample of stars observed by Kepler/TESS.
References
- Augereau & Beust (2006) Augereau, J.-C., & Beust, H. 2006, A&A, 455, 987
- Boccaletti et al. (2015) Boccaletti, A., Thalmann, C., Lagrange, A.-M., et al. 2015, Nature, 526, 230
- Boccaletti et al. (2018) Boccaletti, A., Sezestre, E., Lagrange, A.-M., et al. 2018, A&A, 614, A52
- Burlaga (1988) Burlaga, L. F. 1988, J. Geophys. Res., 93, 4103
- Burlaga et al. (1984) Burlaga, L. F., McDonald, F. B., Ness, N. F., et al. 1984, J. Geophys. Res., 89, 6579
- Chiang & Fung (2017) Chiang, E., & Fung, J. 2017, ApJ, 848, 4
- Cody et al. (2014) Cody, A. M., Stauffer, J., Baglin, A., et al. 2014, AJ, 147, 82
- Daley et al. (2019) Daley, C., Hughes, A. M., Carter, E. S., et al. 2019, ApJ, 875, 87
- Davenport et al. (2015) Davenport, J. R. A., Hebb, L., & Hawley, S. L. 2015, ApJ, 806, 212
- Fitzgerald et al. (2007) Fitzgerald, M. P., Kalas, P. G., Duchêne, G., Pinte, C., & Graham, J. R. 2007, ApJ, 670, 536
- Foreman-Mackey et al. (2013) Foreman-Mackey, D., Hogg, D. W., Lang, D., & Goodman, J. 2013, PASP, 125, 306
- Gaia Collaboration et al. (2018) Gaia Collaboration, Brown, A. G. A., Vallenari, A., et al. 2018, A&A, 616, A1
- Gazis et al. (1999) Gazis, P. R., McDonald, F. B., Burger, R. A., et al. 1999, Space Sci. Rev., 89, 269
- Graham et al. (2007) Graham, J. R., Kalas, P. G., & Matthews, B. C. 2007, ApJ, 654, 595
- Greaves et al. (2014) Greaves, J. S., Kennedy, G. M., Thureau, N., et al. 2014, MNRAS, 438, L31
- Hebb et al. (2007) Hebb, L., Petro, L., Ford, H. C., et al. 2007, MNRAS, 379, 63
- Kalas et al. (2004) Kalas, P., Liu, M. C., & Matthews, B. C. 2004, Science, 303, 1990
- Krist et al. (2005) Krist, J. E., Ardila, D. R., Golimowski, D. A., et al. 2005, AJ, 129, 1008
- Lellouch et al. (2013) Lellouch, E., Santos-Sanz, P., Lacerda, P., et al. 2013, A&A, 557, A60
- Liu (2004) Liu, M. C. 2004, Science, 305, 1442
- Lomax et al. (2018) Lomax, J. R., Wisniewski, J. P., Roberge, A., et al. 2018, AJ, 155, 62
- Lomb (1976) Lomb, N. R. 1976, Ap&SS, 39, 447
- MacGregor et al. (2013) MacGregor, M. A., Wilner, D. J., Rosenfeld, K. A., et al. 2013, ApJ, 762, L21
- Mamajek & Bell (2014) Mamajek, E. E., & Bell, C. P. M. 2014, MNRAS, 445, 2169
- Matthews et al. (2015) Matthews, B. C., Kennedy, G., Sibthorpe, B., et al. 2015, ApJ, 811, 100
- Metchev et al. (2005) Metchev, S. A., Eisner, J. A., Hillenbrand, L. A., & Wolf, S. 2005, ApJ, 622, 451
- Morris et al. (2017) Morris, B. M., Hebb, L., Davenport, J. R. A., Rohn, G., & Hawley, S. L. 2017, ApJ, 846, 99
- Olofsson et al. (2018) Olofsson, J., van Holstein, R. G., Boccaletti, A., et al. 2018, A&A, 617, A109
- Richardson (2018) Richardson, I. G. 2018, Living Reviews in Solar Physics, 15, 1
- Ricker et al. (2015) Ricker, G. R., Winn, J. N., Vanderspek, R., et al. 2015, Journal of Astronomical Telescopes, Instruments, and Systems, 1, 014003
- Roberge et al. (2005) Roberge, A., Weinberger, A. J., Redfield, S., & Feldman, P. D. 2005, ApJ, 626, L105
- Scargle (1982) Scargle, J. D. 1982, ApJ, 263, 835
- Schneider et al. (2014) Schneider, G., Grady, C. A., Hines, D. C., et al. 2014, AJ, 148, 59
- Schneider et al. (2018) Schneider, G., Debes, J. H., Grady, C. A., et al. 2018, AJ, 155, 77
- Schüppler et al. (2015) Schüppler, C., Löhne, T., Krivov, A. V., et al. 2015, A&A, 581, A97
- Sezestre et al. (2017) Sezestre, É., Augereau, J.-C., Boccaletti, A., & Thébault, P. 2017, A&A, 607, A65
- Stobie & Ferro (2006) Stobie, E., & Ferro, A. 2006, in Astronomical Society of the Pacific Conference Series, Vol. 351, Astronomical Data Analysis Software and Systems XV, ed. C. Gabriel, C. Arviset, D. Ponz, & S. Enrique, 540
- Strubbe & Chiang (2006) Strubbe, L. E., & Chiang, E. I. 2006, ApJ, 648, 652
- Townsend & Owocki (2005) Townsend, R. H. D., & Owocki, S. P. 2005, MNRAS, 357, 251
- Townsend et al. (2005) Townsend, R. H. D., Owocki, S. P., & Groote, D. 2005, ApJ, 630, L81
- Vidotto et al. (2014) Vidotto, A. A., Jardine, M., Morin, J., et al. 2014, MNRAS, 438, 1162
- Walkowicz et al. (2013) Walkowicz, L. M., Basri, G., & Valenti, J. A. 2013, ApJS, 205, 17
- Wang et al. (2015) Wang, J. J., Graham, J. R., Pueyo, L., et al. 2015, ApJ, 811, L19
- Watson et al. (2011) Watson, C. A., Littlefair, S. P., Diamond, C., et al. 2011, MNRAS, 413, L71
- Wood et al. (2005) Wood, B. E., Redfield, S., Linsky, J. L., Müller, H.-R., & Zank, G. P. 2005, ApJS, 159, 118