The gas kinematics, excitation, and chemistry, in connection with star formation, in lenticular galaxies.
Abstract
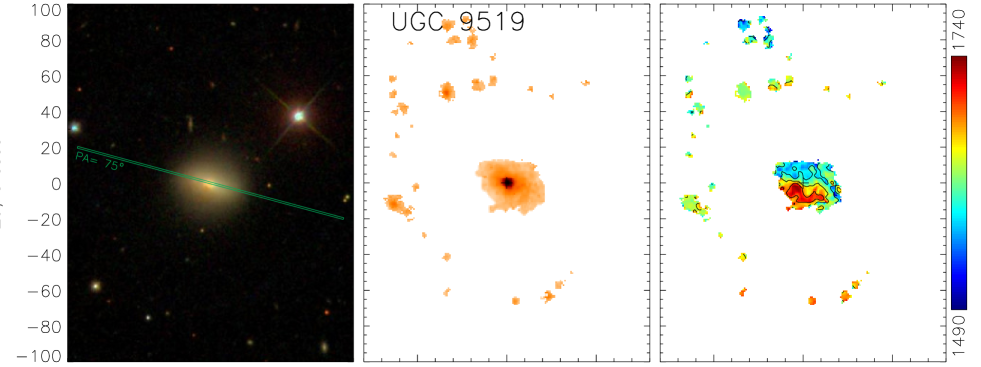
We present results of long-slit and panoramic spectroscopy of extended gaseous disks in 18 nearby S0 galaxies, mostly in groups. The gas in our S0s is found to be often accreted from outside that is implied by its decoupled kinematics: at least 5 galaxies demonstrate strongly inclined large-scale ionized-gas disks smoothly coupled with their outer HI disks, 7 galaxies reveal circumnuclear polar ionized-gas disks, and in NGC 2551 the ionized gas though confined to the main galactic plane however counterrotates the stellar component. The ionized-gas excitation analysis reveals the gas ionization by young stars in 12 of 18 S0 galaxies studied here; the current star formation in these galaxies is confined to the ring-like zones coinciding with the UV-rings. The gas oxygen abundance estimates in the rings are closely concentrated around the value of 0.7 and do not correlate either with the ring radius nor with the metallicity of the underlying stellar population. By applying the tilted-ring analysis to the 2D velocity fields of the ionized gas, we have traced the orientation of the gas rotation-plane lines of nodes along the radius. We have found that current star formation proceeds usually just where the gas lies strictly in the stellar disk planes and rotates there circularly; the sense of the gas rotation does not matter (the counterrotating gas in NGC 2551 forms stars currently). In the galaxies without signs of current star formation the extended gaseous disks are either in steady-state quasi-polar orientation (NGC 2655, NGC 2787, NGC 3414, UGC 9519), or are acquired recently through the highly inclined external filaments provoking probably shock-like excitation (NGC 4026, NGC 7280). Our data imply crucial difference of the external-gas accretion regime in S0s with respect to spiral galaxies: the geometry of the gas accretion in S0s is typically off–plane.
1 Introduction
Lenticular galaxies were introduced as a distinct morphological type in the latest version of the ‘Hubble fork’ – the galaxy morphology scheme by Hubble (1936); they were considered by Edwin Hubble as a transition type between ellipticals and spirals and by definition had large-scale stellar disks but lacked spiral arms and intense star formation. Since the global structures of lenticular and spiral galaxies were very similar (see e.g., Laurikainen et al., 2010), and the only prominent difference was red color of the disks and absence of noticeable star formation regions within them, an idea had been formulated rather early that lenticular galaxies were former spirals devoid of gas (‘they show no trace of gas or anything of the sort’, Baade, 1975). However further observations in the 21 cm line had shown that S0 galaxies could be rather rich in neutral hydrogen (see e.g., van Driel & van Woerden, 1991). The origin of this gas and reasons of the frequent absence of current star formation in the gas-rich S0s remain unclear up to now.
Although lenticular galaxies typically have lower ratio of cold gas mass to their luminosity than spiral galaxies (Knapp, Turner, and Cunniffe, 1985), it has been found that neutral and even molecular gas is present perhaps in most of them (Welch & Sage, 2003; Sage & Welch, 2006; Welch, Sage, & Young, 2010), though less than half of gas-rich S0 galaxies with extended cold-gas disks experience current star formation of HII-region type (Pogge & Eskridge, 1993). The kinematics of ionized gas in S0s is often decoupled from that of their stellar disks that had allowed to Bertola, Buson, and Zeilinger (1992) to conclude that at least 40% of emission-line S0s acquired their gas from some external sources rather recently. Later a factor of environment was found to be important: the study by Davis et al. (2011) and by Serra et al. (2012) showed that among Virgo cluster S0s the gaseous and stellar components revealed almost always strict kinematical alignment while the non-Virgo S0s, those in groups and in the field, demonstrated decoupled gas kinematics in 50% of all cases. By following this logic, we have studied strongly isolated S0s which represent the extreme case of sparse environment. We observed them with the long-slit spectrographs by aligning our slits with the photometric major axes (which are thought to trace the orientation of the stellar-disk lines of nodes in the case of intrinsically round stellar disks.). Our results (Katkov, Sil’chenko, and Afanasiev, 2014, 2015) have confirmed that without external forces to remove the gas, lenticular galaxies demonstrate extended ionized-gas disks in more than 70% of all cases, and about half of them reveal gas counter-rotation with respect to their stellar components. If the gas has been accreted by S0s from outside, such statistics implies that the directions of gas inflow are distributed isotropically. However, in the case of strongly isolated S0s the problem of searching for external gas source (donors) remains unsolved.
Another interesting question which has intrigued us since then is the incidence of star formation in gas-rich S0s. In our sample of isolated S0s (Katkov et al., 2014, 2015) we found that both the gas ionized by young stars and the gas excited by shocks could be met in the disks, and it was not the amount of the gas that governed this dichotomy. By comparing the projections of the gas and star rotation velocities onto the line of sight along the spectrograph slit (aligned with the stellar-disk major axis), we have suspected that star formation proceeds when the gas lies strictly in the planes of stellar disks, independently on the gas spin direction – coincident with the stellar-component spin or antiparallel to it. However, we cannot determine exactly the orientation of the gas rotation plane by observing it only with the long slit; panoramic spectroscopy is needed. In this paper we just present the results of our complex study of the ionized gas in 18 S0s for which we have undertaken both long-slit spectroscopy and velocity mapping with the scanning Fabry-Perot interferometer (FPI) by using the facilities of the Russian 6-m telescope of the Special Astrophysical Observatory of Russian Academy of Sciences (SAO RAS).
2 Sample
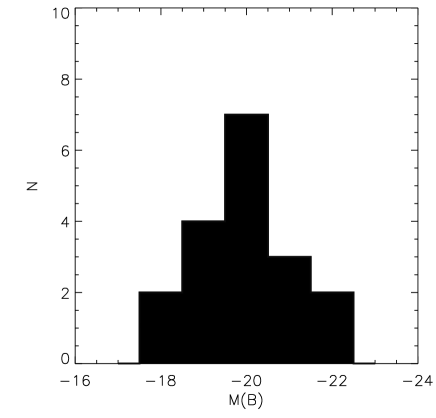
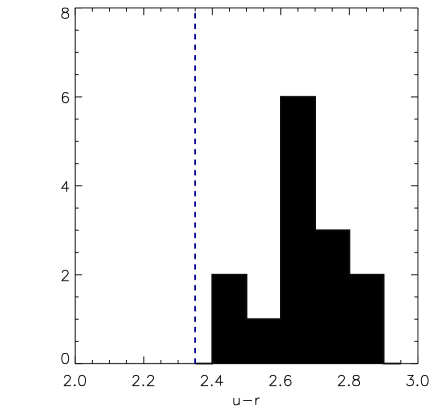
The sample includes 18 S0 and S0/a galaxies with rather extended gaseous disks detected in optical-band emission lines; the presence of such disks is either known from our previous works, e.g. Sil’chenko, Moiseev, and Afanasiev (2009), Ilyina, Sil’chenko, and Afanasiev (2014), Proshina, Kniazev, and Sil’chenko (2019), or is suspected from extended ultraviolet signal reported in Gil de Paz et al. (2007). To select the targets suitable to be studied with the scanning Fabry-Perot interferometer, we have firstly undertaken long-slit spectroscopy to trace emission lines toward their full extension; and so on our sample of nearby S0s is biased toward gas-rich objects. The sample is not representative over neither galaxy characteristics; it is not volume- or magnitude-limited. However, the absolute-magnitude range of the galaxies under consideration covers full range of S0 luminosities, which is from to according to van den Bergh (2009) (Fig. 1, left), and the galaxies are homogeneously red belonging all to the red sequence (Fig. 1, right). The list of their integrated properties assembled over literature is given in Table 1. The majority of our galaxies, 13 of 18, demonstrate rings of various size including those seen in the far ultraviolet, according to the GALEX data, so betraying possible recent star formation. Interestingly, our ringed S0s are mostly unbarred.
| Name | Type | ,′′ | Environment3 | , | , | |||
| (NED1) | (LEDA2) | (NED) | (SDSS/DR9) | (LEDA) | (NED) | (EDD4) | (Young et al., 2011) | |
| IC5285 | S0/a2 | –21.97 | –24.32 | 0.84 | 39.5 | 4 | 37.5 | |
| NGC252 | (R)SA(r)0: | –21.42 | –25.13 | 0.78 | 49 | 4 | 28 | 6.2914 |
| NGC774 | S0 | –20.17 | –23.69 | 0.86 | 39 | 4 | ||
| NGC2551 | SA(s)0/a | –20.04 | –23.02 | 1.04 | 47.5 | 4 | 12 | |
| NGC2655 | SAB(s)0/a | –21.22 | –24.26 | 0.89 | 117 | 4 | 11.4 | 1.35 |
| NGC2697 | SA(s)0: | –18.66 | –22.26 | 0.726 | 49 | 3 | 5.9 | 1.8 |
| NGC2787 | SB(r)0 | –18.45 | –23.34 | 0.95 | 97 | 5 | 9.87 | 0.188 |
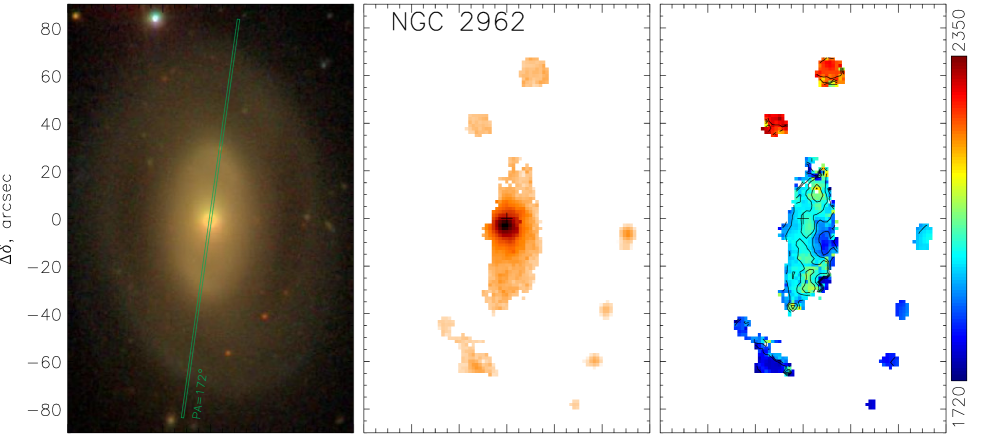
| NGC2962 | (R)SAB(rs)0 | –20.08 | –23.64 | 0.87 | 69 | 4 | 11.0 | |
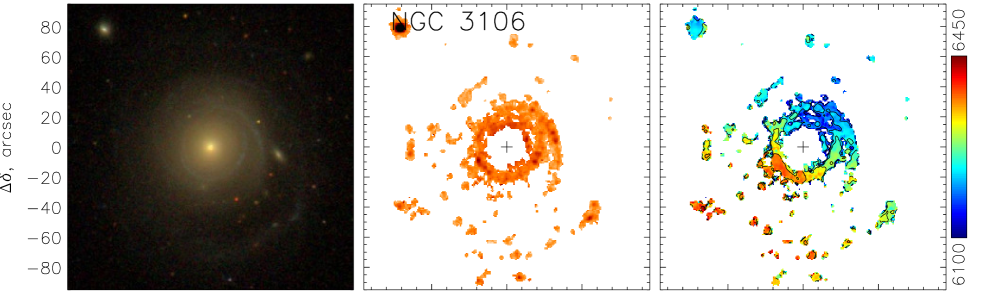
| NGC3106 | S0 | –21.70 | –24.62 | 0.73 | 27 | 4 | 1089 | |
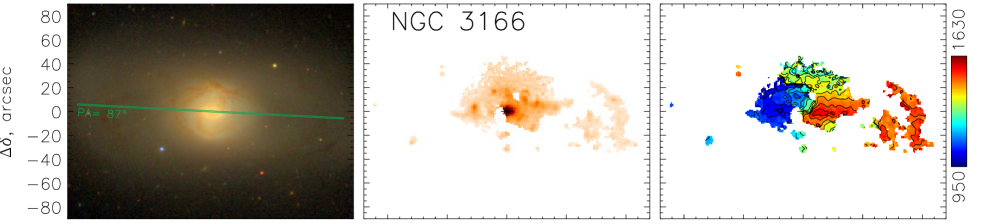
| NGC3166 | SAB(rs)0/a | –20.30 | –24.34 | 0.81 | 134 | 4 | 4.57 | 1.710 |
| NGC3182 | SA(r)0/a2 | –19.81 | –22.84 | 0.77 | 57 | 4 | 0.0811 | 2.14 |
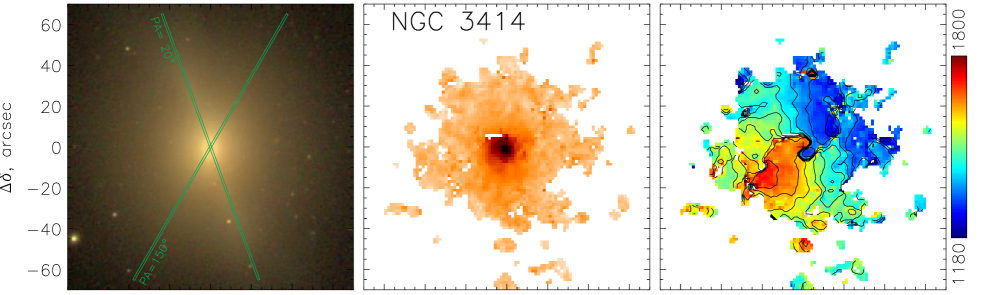
| NGC3414 | S0pec | –20.03 | –23.39 | 0.76 | 81 | 4 | 1.911 | |
| NGC3619 | (R)SA(s)0: | –19.63 | –23.57 | 0.86 | 117 | 2 | 10.011 | 1.9 |
| NGC4026 | S0 | –19.11 | –23.16 | 0.80 | 131 | 2 | 3.211 | 0.887 |
| NGC4324 | SA(r)0 | –19.12 | –23.43 | 0.76 | 88.5 | 1 | 16.8 | 0.5 |
| NGC7280 | SAB(r)0 | –18.84 | –22.41 | 0.74 | 60 | 4 | 0.8311 | |
| UGC9519 | S02 | –18.09 | –21.49 | 0.82 | 24 | 3 | 18.611 | 5.9 |
| UGC12840 | (R)SAB(s) | –21.15 | –24.14 | 0.76 | 36 | 5 | 5512 | 6.213 |
| 1NASA/IPAC Extragalactic Database, http://ned.ipac.caltech.edu . | ||||||||
| 2Lyon-Meudon Extragalactic Database, http://leda.univ-lyon1.fr . | ||||||||
| 3Environments: 1 – cluster member, 2 – rich-group member, 3 – loose-group member, 4 – loose-group center, 5 – field. | ||||||||
| 4Extragalactic Distance Database, http://edd.ifa.hawaii.edu . | ||||||||
| 5Ueda et al. (2014). | ||||||||
| 6Proshina et al. (2019). | ||||||||
| 7Roberts et al. (1991). | ||||||||
| 8Welch & Sage (2003). | ||||||||
| 9Eder et al. (1991). | ||||||||
| 10Wiklind & Henkel (1989). | ||||||||
| 11Serra et al. (2012). | ||||||||
| 12Haynes et al. (2011). | ||||||||
| 13Lisenfeld et al. (2011). | ||||||||
| 14O’Sullivan et al. (2018). | ||||||||
 |
 |
| Galaxy | Date | Grism | Sp. range, Å | Exposure, s | PA(slit), | Seeing, ′′ |
|---|---|---|---|---|---|---|
| IC 5285 | 04.10.2015 | VPHG1200R | 5700–7500 | 93 | 1.3 | |
| NGC 252 | 19.11.2011 | VPHG1200@540 | 3700–7200 | 82 | 1.5 | |
| NGC 774 | 08.10.2015 | VPHG2300G | 4800–5500 | 170 | 3.6 | |
| NGC 2551 | 14.12.2014 | VPHG1200@540 | 3700-7200 | 13 | 1.5 | |
| NGC 2551 | 06.10.2015 | VPHG1200R | 5700–7500 | 55 | 2.6 | |
| NGC 2655 | 15.12.2014 | VPHG1200@540 | 3700-7200 | 0 | 1.3 | |
| NGC 2655 | 15.12.2014 | VPHG1200@540 | 3700-7200 | 102 | 1.3 | |
| NGC 2787 | 30.03.2009 | VPHG2300G | 4800–5500 | 109 | 1.5 | |
| NGC 2787 | 30.03.2009 | VPHG2300G | 4800–5500 | 72 | 1.5 | |
| NGC 2787 | 14.04.2012 | VPHG1200@540 | 3700-7200 | 108 | 4.0 | |
| NGC 2962 | 20.02.2017 | VPHG1200@540 | 3700-7200 | 172 | 2.5 | |
| NGC 3166 | 28.04.2006 | VPHG2300G | 4800–5500 | 87 | 2.8 | |
| NGC 3166 | 19.02.2017 | VPHG1200@540 | 3700-7200 | 87 | 2.5 | |
| NGC 3182 | 31.03.2014 | VPHG1200@540 | 3700-7200 | 153 | 4.0 | |
| NGC 3414 | 30.03.2009 | VPHG1800R | 6200–7200 | 20 | 1.5 | |
| NGC 3414 | 31.03.2009 | VPHG1800R | 6200–7200 | 150 | 1.3 | |
| NGC 3414 | 10.04.2010 | VPHG2300G | 4800–5500 | 150 | 3.0 | |
| NGC 3619 | 28.02.2014 | VPHG1200@540 | 3700-7200 | 50 | 3.1 | |
| NGC 4026 | 04.04.2009 | VPHG1800R | 6200–7200 | 178 | 2.8 | |
| NGC 4026 | 18.04.2012 | VPHG1200@540 | 3700-7200 | 176 | 2.5 | |
| NGC 7280 | 12.10.2009 | VPHG2300G | 4800–5500 | 76 | 1.7 | |
| NGC 7280 | 13.10.2009 | VPHG2300G | 4800–5500 | 40 | 1.9 | |
| NGC 7280 | 05.10.2016 | VPHG1800R | 6200–7200 | 40 | 1.0 | |
| NGC 7280 | 05.10.2016 | VPHG1800R | 6200–7200 | 76 | 1.4 | |
| UGC 9519 | 20.04.2012 | VPHG1200@540 | 3700-7200 | 75 | 2.0 | |
| UGC 12840 | 14.11.2014 | VPHG1200@540 | 3700-7200 | 15 | 1.1 |
3 Observations
3.1 Long-slit spectroscopy
Our long-slit spectral observations were made with the multi–mode focal reducer SCORPIO (Afanasiev & Moiseev, 2005) and its improved version SCORPIO-2 (Afanasiev & Moiseev, 2011) installed at the prime focus of the SAO RAS 6m telescope. Both devices have the same slit size (61 in length and 1″ in width) with a scale along the slit of 036/px, while for a similar spectral resolution SCOPRIO-2 provides a twice larger spectral range. With the SCOPRIO-2 we exposed the full optical spectral range, namely 3700–7200 Å, by using the volume-phase holographic grating VPHG1200@540 provided spectral resolution of about 5 Å, whereas with the SCORPIO we probed separately the narrower spectral ranges, 4800–5500 Å, 6200–7200 Å, or 5700–7500 Å, with the grisms VPHG2300G, VPHG1800R, and VPHG1200R providing the resolution of about 2, 2.5, and 5 Å, correspondingly. The log of the observations is presented in Table 2, the positions of the spectrograph slit against the galaxies images are shown in the Fig. 4.
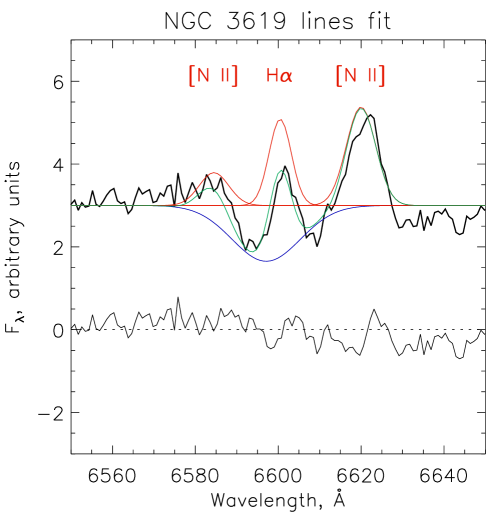
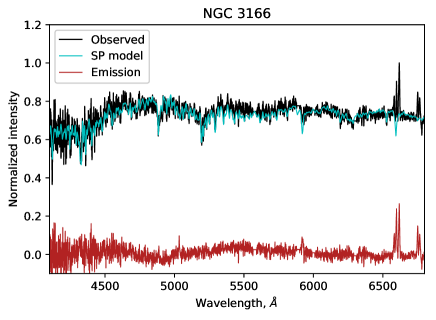
The data were reduced by a standard way using the IDL software package developed in SAO RAS. It is at the edges of the slit that we derived the sky background to subtract it from the galaxy spectra, by applying the linear or polynomial (with the degree of 2–3) fit of the sky background distribution along the slit at every wavelength. Inhomogeneties of the optics transmittance and variations of the spectral resolution along the slit were taken into account by using the high signal-to-noise acquisitions of the twilight spectra. The stellar kinematics was analysed by cross–correlating binned spectra with spectra of K-giant stars observed the same nights as the galaxies; the description of this technique and references on the original papers are presented in our previous papers, e.g. Sil’chenko et al. (2009). The emission lines, namely, the H, [NII]6583, and [OIII]5007 first of all, were used to derive ionized-gas kinematics, by measuring baricenter positions of the lines; in the central bins where the stellar continuum is strong we applied gauss-analysis to take into account effects of underlying Balmer absorption lines and also TiI under [OIII]5007. For the latter purpose, we binned the spectra along the slit to reach signal-to-noise ratio higher than 50-70, and then made gauss-analysis of the line complexes [NII]6548,6583+H(emission)+H(absorption), H(emission)+H(absorption), [OIII]5007(emission)+TiI5007(absorption)+TiI5015(absorption). With this analysis we are also able to derive the equivalent width of H line (EWHα) and the flux ratios of the strong emission lines: [NII]6583 to H, [OIII]5007 to H, [SII]6717 to [SII]6731, and [SII] to H, which can be used to diagnose the gas excitation mechanisms with the BPT-diagrams (Baldwin, Phillips, and Terlevich, 1981) and to determine the gas oxygen abundances for the emission-line regions where the gas is excited by young stars. The example of the emission/absorption lines decomposition near the center of NGC 3619 is shown in Fig. 2. The sensitivity variations along the wavelength range were corrected by observing spectrophotometric standard stars the same nights as the galaxies.
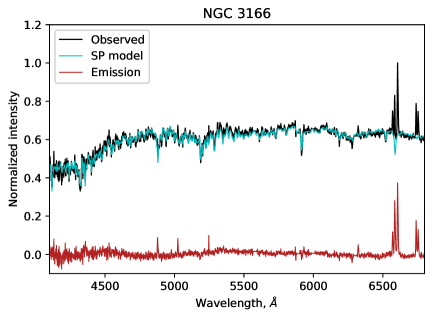
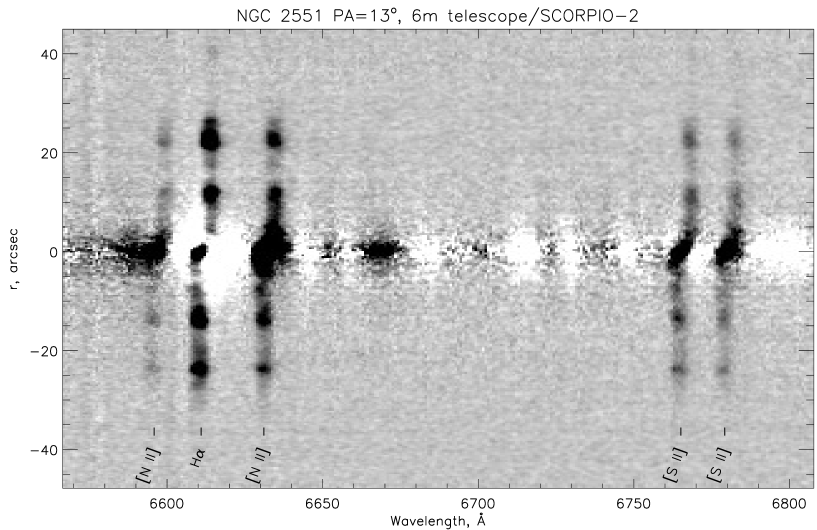
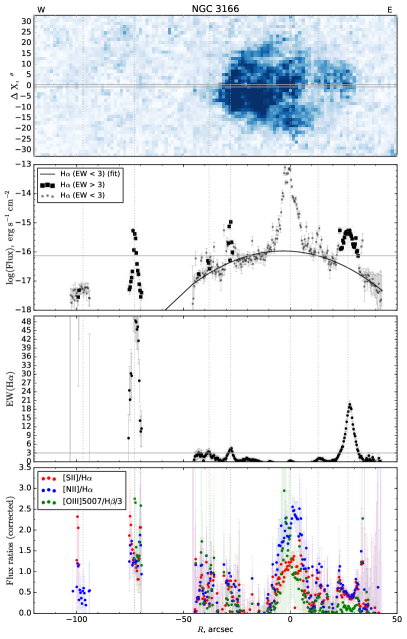
As it will be noted further, we study the distribution of the above mentioned emission lines along the slits in more details for two galaxies – NGC 2551 and NGC 3166. Their spectra demonstrate very extended emission of diffuse ionized gas together with compact bright clumps. For this particular analysis we consider the spatial distribution of the line flux ratios measured by fitting single Gaussians to the observed lines at each position along the slit after subtracting the spectra of stellar population models obtained with the ULySS software Koleva et al. (2009), as is shown in Fig. 3.
 |
 |
3.2 Observations with the scanning Fabry-Perot interferometer
Scanning Fabry-Perot interferometer (FPI) allows to make 3D–spectroscopic study of the ionized-gas kinematics over large field of view, whereas the narrow interfringe spectral range contains usually only a single emission line selected by a band–pass filter with FWHM of about 15–30 Å. Using the information from the long–slit spectroscopy we have preliminarily chosen spectral lines in which the most extended ionized gas emission could be expected: H, [NII], or [OIII]. The targets were observed at the SAO RAS 6m telescope with the SCORPIO-2 in the FPI mode by using the interferometer providing spectral resolution of FHWM= 1.7 Å (km s-1 ) and full spectral range (interfringe) of Å around redshifted [NII] or H line, whereas in the [OIII] emission line these parameters were FHWM= 2.0 Å (km s-1 ) and Å. During the scanning process, we have consecutively obtained few tens of interferograms fixing different gaps between the FPI plates covering uniformly the interfringe: 40 frames in the H or 30 frames in the [OIII] spectral ranges. The field of view was 61. The galaxy NGC 3166 was observed with a previous version of the focal reducer SCORPIO in the H emission line using FPI providing FHWM= 2.5 Å (km s-1 ) and Å, the number of interferograms was 32. The log of the observations including exposures times and mean seeing values is presented in Table 3. The data were reduced using the software package described in details by Moiseev (2002) and by Moiseev & Egorov (2008).
Briefly, the used procedures included standard steps for CCD data reduction (bias subtraction, flat-field corrections, sigma clipping of cosmic-ray hits) and some specific steps: removing interference rings relating with airglow lines using an azimuthal averaging of brightness in each frame with masked galaxies and stars (see Moiseev, 2002); correction of atmospheric transparency as well as seeing variations and astrometric shifts of individual interferograms basing on the PSF-photometry of foreground stars; phase-shift correction (wavelength calibration) basing on the scanning of some selected lines in the spectra of He-Ne-Ar lamp exposed every evening and morning before and after the observational night. After the primary reduction the observed data are combined into data cubes, where to each spaxel of the field of view a 30, 32, or 40-channel spectrum is attributed.
The data cubes were rotated to the ‘standard’ orientation (north at the top). The astrometry grid was created using the Astrometry.net project web-interface111http://nova.astrometry.net/ (Lang et al., 2010). The optical continuum and monochromatic images in the emission lines, the line-of-sight velocity fields and velocity dispersion maps were created from the one-component Voigt profile fitting of the spectra as described in Moiseev & Egorov (2008). All the velocities presented in the paper are heliocentric.
| Galaxy | Date | Emission line | Exposure, s | Seeing,″ |
|---|---|---|---|---|
| IC 5285 | 08.12.2015 | H | 2.6 | |
| NGC 252 | 15.12.2017 | H | 2.4 | |
| NGC 774 | 13.11.2014 | H | 1.0 | |
| NGC 2551 | 08.12.2015 | H | 2.1 | |
| NGC 2655 | 07.12.2015 | [OIII] | 2.0 | |
| NGC 2697 | 01.03.2016 | [OIII] | 4.0 | |
| NGC 2697 | 02.03.2016 | H | 3.0 | |
| NGC 2787 | 09.12.2012 | [NII] | 1.7 | |
| NGC 2962 | 29.02.2016 | H | 2.2 | |
| NGC 3106 | 09.12.2015 | H | 1.4 | |
| NGC 3166 | 14.02.2007 | H | 1.3 | |
| NGC 3182 | 28.02.2014 | H | 3.0 | |
| NGC 3414 | 15.02.2016 | [OIII] | 2.5 | |
| NGC 3619 | 28.02.2014 | [OIII] | 3.1 | |
| NGC 4026 | 03.04.2014 | [OIII] | 1.8 | |
| NGC 4324 | 29.02.2016 | H | 1.8 | |
| NGC 7280 | 18.11.2014 | [OIII] | 1.1 | |
| UGC 9519 | 29.02.2016 | [NII] | 1.6 | |
| UGC 9519 | 03.05.2016 | H | 1.9 | |
| UGC 12840 | 11.12.2015 | H | 1.2 |
3.3 Ancillary data
By wishing to expand our gas velocity fields and to reach physical interpretation of what we see, for our analysis we involve some additional data on our galaxies which can be retrieved in open data archives. In particular, we use SAURON IFU [OIII] emission-line data collected in the frame of the ATLAS-3D survey (Cappellari et al., 2011) to refine gas velocity fields in the centers of the galaxies, and we expand our gas velocity fields into the outermost parts of the galaxies by attaching interferometric HI data (GMRT observations from the archive of http://wow.astron.nl presented also in Serra et al. 2012 and Lee-Waddell et al. 2012). The star formation regions distributions over the galactic disks are studied with the GALEX images (Gil de Paz et al., 2007) obtained in the far- and near-ultraviolet bands (FUV and NUV). The general structure of the galactic disks is considered with the photometric data in the optical bands retrieved from the SDSS (http://www.sdss3.org) and PanSTARRS (https://ps1images.stsci.edu/cgi-bin/ps1cutouts) archives, and also with the NIR images of the galaxies in 3.6 mkm and 4.5 mkm bands which have been obtained and made public in the frame of the Spitzer-telescope galaxy survey S4G (Sheth et al., 2010). Finally, four of our galaxies were observed with the IFU PMAS/PPAK in the frame of the CALIFA survey (Garcia-Lorenzo et al., 2015; Sánchez et al., 2012, 2016), and for these galaxies we have also used the fully reduced datacubes taken from the CALIFA archive, http://califa.caha.es.
4 Results
4.1 Kinematics

 |
 |
 |
 |
 |
 |
 |
 |
 |
 |
 |
 |
 |
 |
 |
 |
 |
 |
1st row – IC 5285 (major axis ), NGC 774 (major axis), NGC 2551 (∘ ),
2nd row – NGC 2655(major axis), NGC 2655 (minor axis), NGC 2787(major axis),
3rd row – NGC 2787 (∘ ), NGC 2962 (major axis), NGC 3166 (major axis),
4th row – NGC 3182 (major axis), NGC 3414 (major axis), NGC 3414 (∘ ),
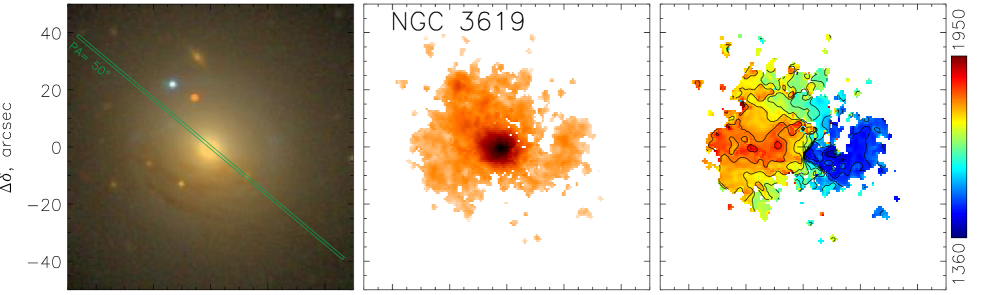
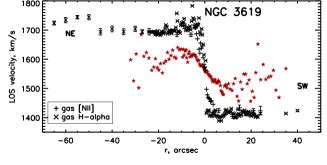
5th row – NGC 3619 (major axis), NGC 4026 (major axis), NGC 7280 (major axis),
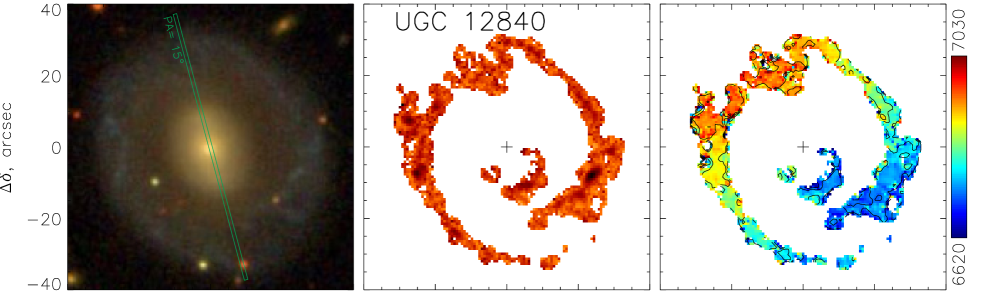
6th row – NGC 7280 (∘ ), UGC 9519 (major axis), UGC 12840 (major axis).
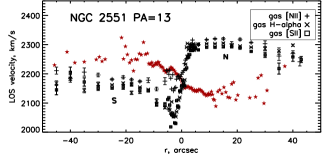
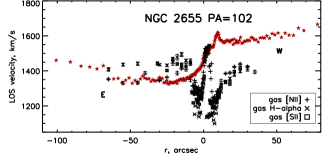
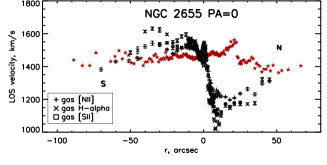
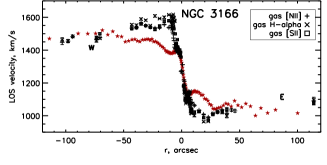
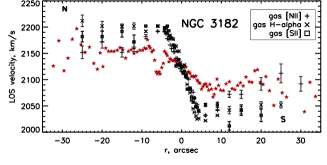
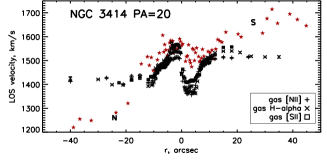
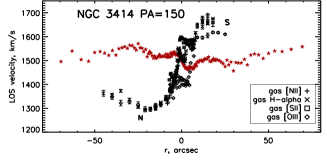
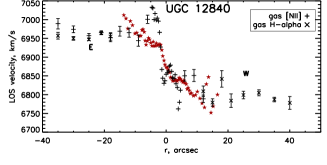
When only a single emission line is measured (mainly [OIII]5007), it is plotted by squares, and the stellar component rotation – by black stars; when several emission lines are independently measured, they are plotted by various black signs, and the stellar component is indicated by red stars. The abscissa zero corresponds to the brightest-continuum bin along the slit (to the galactic nucleus).
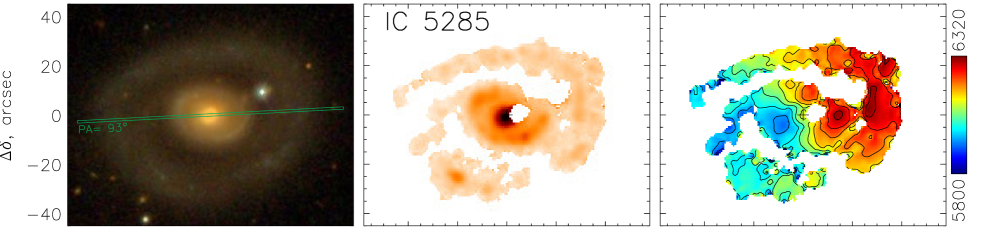
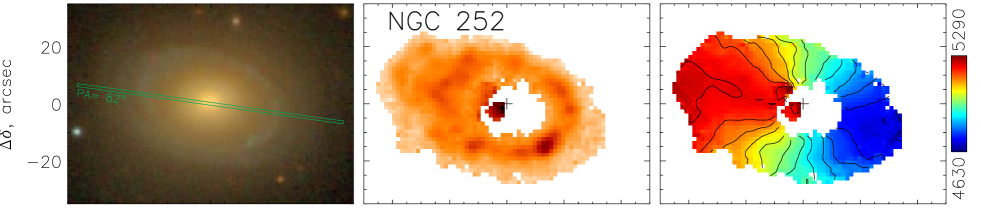
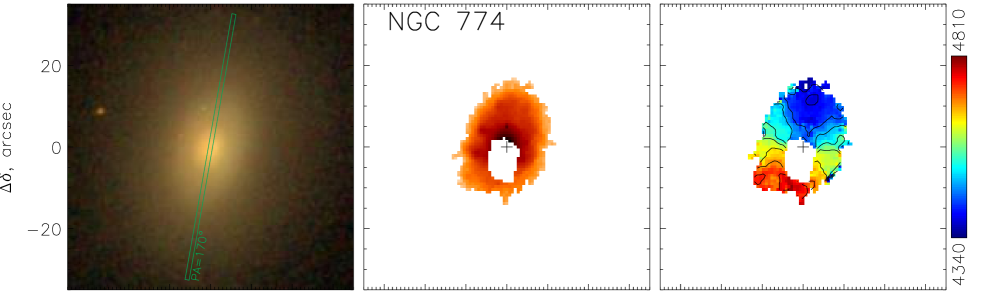
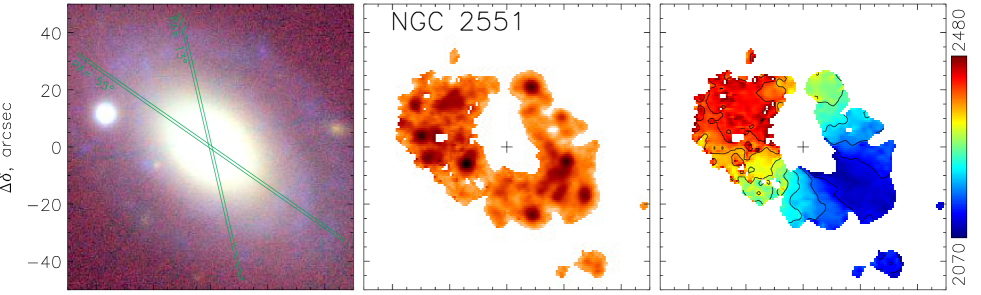
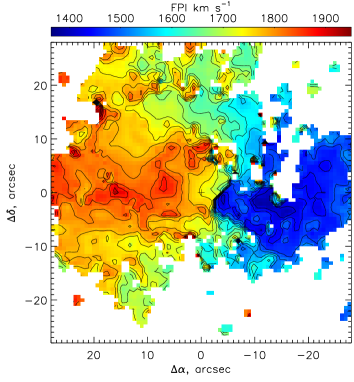
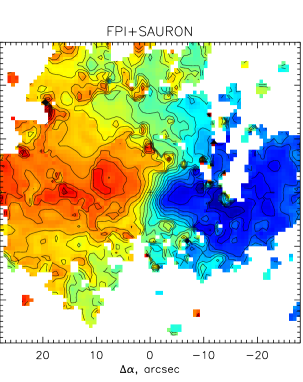
The Figs. 4 and 6 present the results respectively of our panoramic and long-slit spectroscopy with the 6m telescope. The optical continuum centers are posed to the coordinate zero points, (0,0) at the both axes. The maps are smoothed severely to reach the outermost parts of the gaseous disks – to the typical angular resolution of 2″–3″, so the circumnuclear regions are somewhat poorly resolved. However in some galaxies a certain turn of the kinematical major axis (defined as the direction of maximum line-of-sight velocity gradient) in the very center is seen: in NGC 3166, NGC 3414, and NGC 7280.
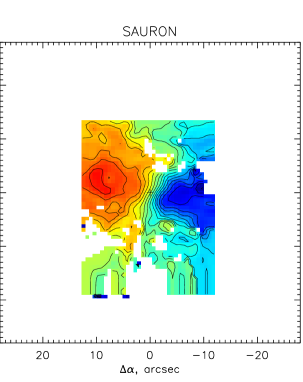
In the central regions of about half of the galaxies their spectral stellar-absorption features are rather deep forcing the faint ionized-gas emission lines to sink. In those cases the observed gas kinematics can be strongly affected because the small spectral range of the FPI observations does not allow us to distinguish the contributions of the nebular and stellar components into the integrated spectrum. In these cases we could not detect emission lines with the expected velocities in the circumnuclear regions which are blanked in the FPI maps presented in the Fig. 4. Usually the blanked regions locate asymmetrically relative the galaxy nucleus (see IC 5285, NGC 774, etc.), because these regions correspond to the maximal contribution of the bulge luminosity against the distant side of the disk. This situation is invert to the well-known effect of finding more prominent dust lanes at the nearest side of a galaxy disk. As concerning the [OIII] data, central parts of some emission-line velocity fields are available from the surveys undertaken with the SAURON spectrograph (Bacon et al., 2001; Cappellari et al., 2011). So for NGC 3619 and NGC 4026 we have succeeded to combine the [OIII] velocity fields derived from the SAURON data cubes and from our FPI data. Namely, we replaced the central pixels in FPI maps with the SAURON fields if the velocity difference exceeds the limit of about km s-1 . In the resulting fields the nuclear points (where stellar absorption features are significant) possesses to the SAURON data, while the outer regions retain the FPI measurements with a better spectral resolution. Figure 5 illustrates this procedure for NGC 3619. The final ‘combined’ velocity fields were involved further in our analysis described below.
The long-slit cross-sections have been mostly obtained with the slit orientation along the photometric major axis which coincides with the stellar-disk line-of-nodes orientation in the case of an intrinsically round stellar disk. The round intrinsic shape of stellar galactic disks is statistically confirmed more than once, both from photometric (Rix & Zaritsky, 1995; Andersen et al., 2001) and kinematical (Franx & de Zeeuw, 1992; Cappellari, 2016) arguments. However in some our galaxies where the kinematical major axes for the gaseous disks derived from the panoramic spectroscopy have been found to deviate strongly from the stellar-disk lines of nodes (photometric major axes), we have observed two long-slit spectra with different slit orientations, both being presented in Fig. 6; those galaxies are NGC 2655, NGC 2787, NGC 3414, and NGC 7280. Below we give some comments on the individual galaxies.
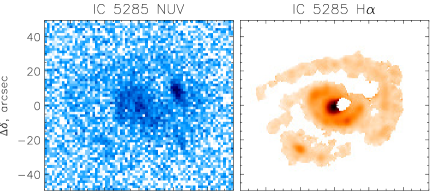
IC 5285. This luminous S0/a galaxy looks a double-ringed one in continuum, with the outer ring being completely detached from the main disk. Interestingly, being mapped in the emission line H , instead of the outer ring, it reveals a pair of gaseous spirals started from the tips of the inner ring (Fig. 4). Perhaps, the inner ring borders a triaxial bulge because the major axis of the inner ring is turned with respect to the kinematical major axis; evident non-circular gas motions are seen in the center of the galaxy. In general, the gaseous disk corotates the stellar component (Fig. 6).
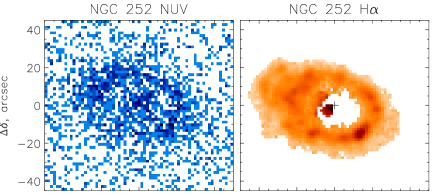
NGC 252. The galaxy was reported as a ringed one by Kostyuk (1975). Later we noted a UV-ring with a radius about and reported gas excitation by young stars in the ring (Ilyina et al., 2014). Now in Fig. 4 we present an H disk extended up to (15 kpc) from the center and rotating with a very high speed, about 350 km s-1 . The stars corotate (Ilyina et al., 2014); the lower visible stellar rotation velocity is perhaps due to asymmetric drift – the stellar disk of NGC 252 may be rather dynamically hot. In the very center, at , low-excitation emission line [NII]6583 demonstrates lower rotation velocities than the H (Fig. 6); it implies the possible presence of a triaxial potential though morphologically the galaxy is classified as unbarred, SA0.
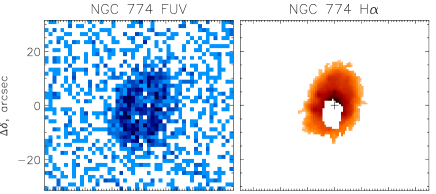
NGC 774. It is another S0 galaxy with a UV-ring (Gil de Paz et al., 2007); it must possess even current star formation because recently a core-collapse supernova is detected within the ring (SN2006ee, to SE from the center). The ionized gas is asymmetrically distributed over the central part of the galaxy, within , or 6 kpc (Fig. 4); beyond the borders of the gaseous disk the stellar rotation velocity curve falls visibly almost to zero (Fig. 6).
NGC 2551. In this galaxy the UV-ring is very bright and clumpy both in the FUV and in the NUV, and also is rather wide, from to (2–5 kpc) (Gil de Paz et al., 2007). The extended ionized-gas disk which is coincident radially with the UV-ring (Fig. 4) counterrotates as a whole with respect to the stellar disk (Sil’chenko et al., 2009). Earlier we published the long-slit cross-section along the disk major axis (Sil’chenko et al., 2009); now we present a cross-section under to the line of nodes (Fig. 6), confirming the gas counterrotation, and also the falling character of the stellar rotation curve.
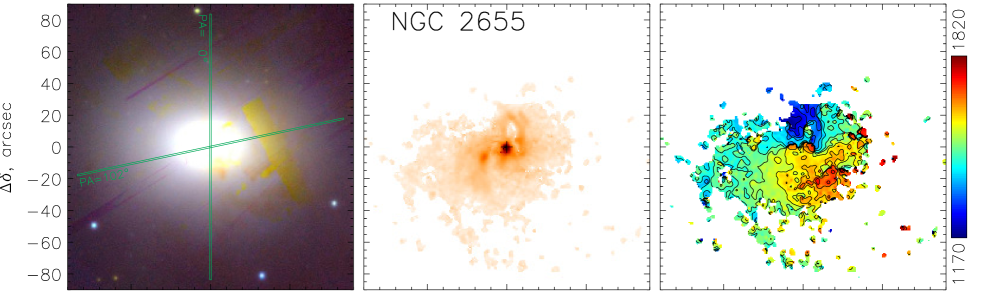
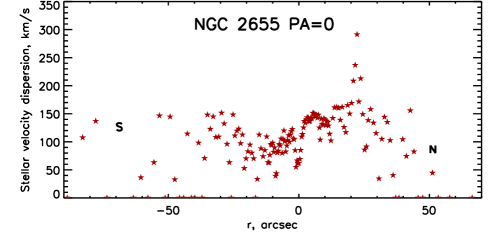
NGC 2655. This galaxy is an object of our long-standing interest. Many years ago we started its spectral study with three long-slit cross-sections (Sil’chenko & Burenkov, 1990); then we noted that the central part of NGC 2655, (0.8 kpc), had quite decoupled gaseous kinematics. Our first interpretation was that it might be an effect of an active nucleus. Later we had made panoramic spectroscopy with the IFU MPFS of the 6m telescope, and had changed our opinion: in the center of NGC 2655 we had detected an inner gaseous disk with polar rotation (Sil’chenko & Afanasiev, 2004) that had then been supported by a dust lane perpendicular to the isophote major axis (Sil’chenko & Afanasiev, 2004). This interpretation was later confirmed by discovery of a strongly warped extended HI disk around NGC 2655 (Sparke et al., 2008). However now, after inspecting the full LOS velocity field of the ionized-gas component (Fig. 4) and two orthogonal long-slit cross-sections along the major and the minor axes of the isophotes (Fig. 6), we are again forced to change our opinion. The general blue-red asymmetry of the gas LOS velocity field is seen in the east-west direction that is fully consistent with the orientation of the photometric major axis (stellar-disk line of nodes). The visible effect of the orthogonal turn of the kinematical major axis near the center is produced by a compact velocity anomaly just to the north and to the west from the nucleus. But when we inspect the long-slit cross-sections made under good seeing conditions (Fig. 6), we understand that any rotation cannot be the reason of this anomaly: the line-of-sight velocity of the gas drops by some 400 km s-1 to the north of the nucleus without any mirrored behavior in the south direction. Interestingly, just in the same place the stellar velocity dispersion rises enormously (Fig. 7) betraying the presence of a secondary stellar component with strongly different velocity on our line of sight. Evidently, at to the north of the nucleus and along the circumnuclear dust lane to the west of it we see the consequence of minor merging – the remnant of a gas-rich dwarf satellite destroyed by gravitational tides and close in projection to the center of NGC 2655.
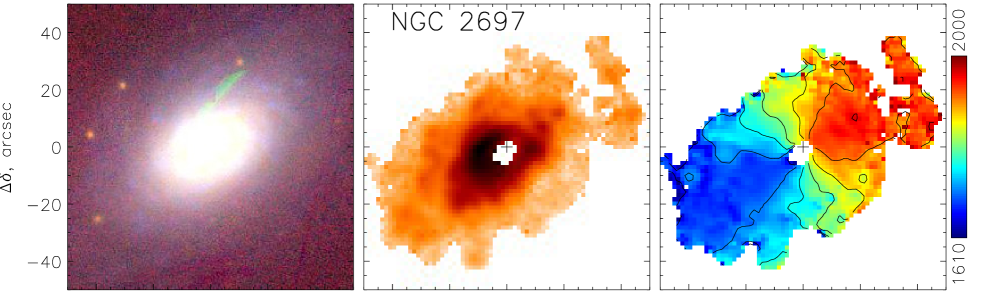
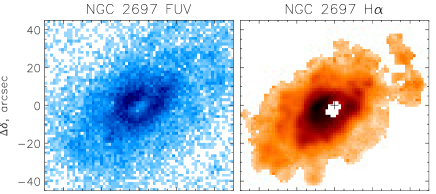
NGC 2697. It is a rather low-luminosity S0 galaxy for which no SDSS data were found. We have made our own photometry which results are to be presented elsewhere (Proshina et al., 2019); in the same paper we analyze also the long-slit kinematics. Here we note only a well-sampled ionized-gas velocity field (Fig. 4) demonstrating regular circular gas rotation.
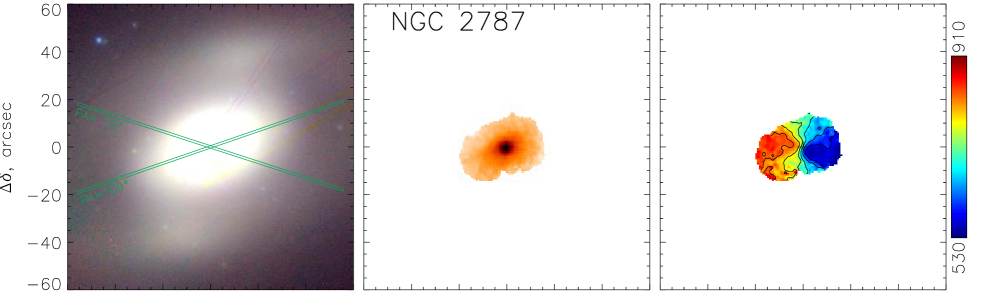
NGC 2787. It is one more galaxy where we searched for inner polar disk because of the circumnuclear dust lane perpendicular to the isophote major axis (Sil’chenko & Afanasiev, 2004). Presently, by exploiting the scanning Fabry-Perot interferometer, we succeeded to trace the gas rotation in the emission line [NII]6583 up to , and we saw a turn of the kinematical major axis over this radius range (Fig. 4). However, in the emission line [OIII]5007, by comparing the rotation velocity projections for the stars and for the ionized gas exposed with the long slit in two different position angles (Fig. 6), we see also decoupled gaseous kinematics at quite certainly.
NGC 2962. It is a nearby intermediate-luminosity lenticular galaxy with a detached outer stellar ring at (8–10 kpc). The galaxy was included into the survey ATLAS-3D (Cappellari et al., 2011), and so panoramic spectroscopy of its central part, , with the IFU SAURON had provided us with the orientations of the stellar and the ionized-gas rotation planes in its inner part. We found that they are mutually orthogonal (Sil’chenko, 2016), so the galaxy possessed the inner polar disk. However, the major axis of the outer ring is aligned with the stellar kinematical major axis, and indeed, our scanning Fabry-Perot data (Fig. 4) confirms that the outer gas rotates in the main galactic plane. Our long-slit cross-section along the galaxy major axis (Fig. 6) reveals both effects – that the rotation axis of the gas within is orthogonal to the rotation axis of the stellar component and that at the gas rotation comes into consistency with that of the stellar disk. The outer ring of NGC 2962 is well seen in the ultraviolet bands FUV and NUV of the GALEX imaging (Marino et al., 2011, see also our Fig. 13).
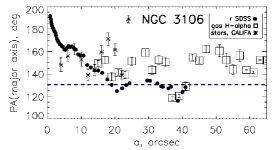
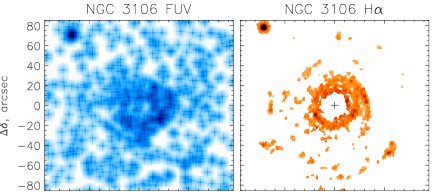
NGC 3106. This galaxy, including its gas velocity field, was studied in the frame of the CALIFA survey (Garcia-Lorenzo et al., 2015). They have found an ‘outer’ starforming ring in this lenticular galaxy with a radius of some (8 kpc) (Gomes et al., 2016). However, our data with a much larger field of view reveals a series of starforming rings in NGC 3106 (Fig. 4), among which the ring reported by the CALIFA is the innermost one. The galaxy is close to face-on, nevertheless the rotation is visible in Fig. 4, and the orientation of the kinematical major axis is measured quite certainly with our data.
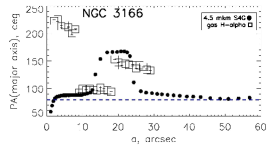
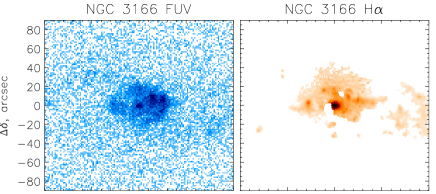
NGC 3166. This S0/a galaxy belongs to a tight triplet of disk galaxies embedded into a common HI envelope (Haynes, 1981). Many signatures give evidences for the current cold gas accretion onto NGC 3166 from this huge intergalactic gaseous cloud: young age, Gyr, of the nuclear stellar population (Sil’chenko & Afanasiev, 2006), large extended molecular-gas reservoir within the galaxy disk (Taniguchi et al., 1994), strongly lopsided structure of the large-scale stellar disk (Bournaud et al., 2005), multiple twisted dust filaments within the central bulge-dominated part of the galaxy (Simoes Lopes et al., 2007). The map in H emission line (Fig. 4) shows also asymmetric distribution of the ionized gas, with a prominent H arm at (11 kpc) to the west from the nucleus. The gas isovelocities turn in the very center of the galaxy into a polar orientation. In the outer parts the gas starts to strictly corotate the stars only at (Fig. 6), where the large-scale stellar disk begins to dominate in the total surface brightness (Sil’chenko et al., 2012).
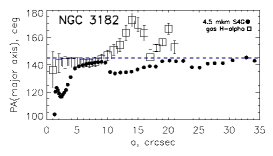
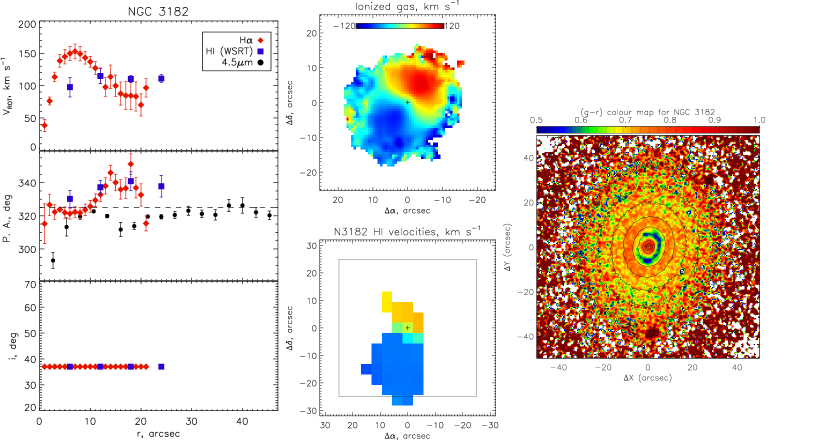
NGC 3182. Though the galaxy surely lacks a bar, it demonstrates a circumnuclear blue (starforming?) ring with a radius of (0.8 kpc). Beyond the ring, different emission lines show different line-of-sight velocity profiles, the low-ionization [NII]6583 being the less rapid, and as a whole the difference between the projected rotation velocities of the gas and stars is unexpectedly large for such a low-mass galaxy. We can suspect that this S0 galaxy may possess thick disk of diffuse ionized gas. Such thick gaseous disks are usually lag the fast equatorial-plane rotation of galactic stellar disks and demonstrate enhanced low-ionization emission lines [NII] and [SII].
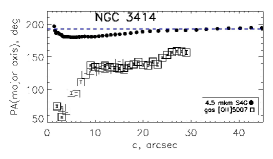
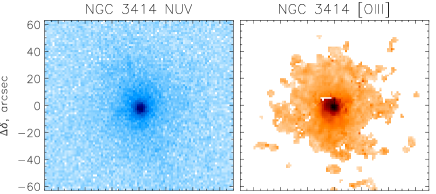
NGC 3414. A real structure of this galaxy remains a complete mystery up to now. It looks like a round homogeneous body (a spheroid? a face-on disk?) with an overlaid thin filament-like structure in the orientation of ∘ . There were various interpretations of such a view: it might be a face-on S0 with a very strong bar (Baggett et al., 1998; Chitre & Jog, 2002), but there were also suggestions that it was a face-on S0 with a polar ring projected onto the center (Whitmore et al., 1990). In any case, we were not surprised that the gaseous kinematics in NGC 3414 is completely decoupled from the stellar one (Fig. 6). However, in the very center the gas kinematical major axis turns to stay along the thin bar-like structure – we have obtained the same result from our data with the scanning Fabry-Perot in the [OIII]5007 line (Fig. 4) and from the archive data obtained earlier for the central part of the galaxy with the IFU SAURON (Sarzi et al., 2006).
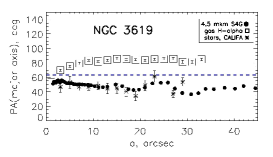
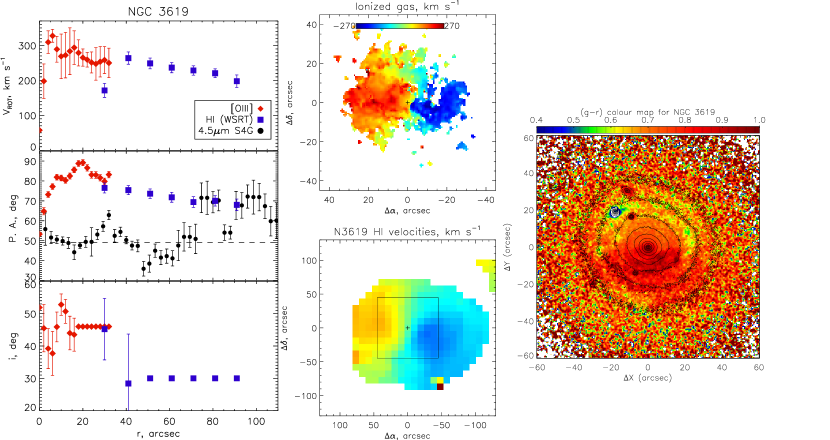
NGC 3619. It is another peculiar lenticular galaxy, settling in a rich group and demonstrating a system of outer shells (Schweizer & Seitzer, 1988) – possible results of close interaction or even merging. It is rather gas-rich, and the distribution of the neutral hydrogen is unusually compact for S0s (van Driel et al., 1989). In the optical bands, spiral-like dust lanes are projected against the stellar body to the south from the nucleus implying a circumnuclear gaseous disk settled asymmetrically with respect to the stellar one. A UV-bright inner ring has been detected in the GALEX survey (Cortese & Hughes, 2009, see also our Fig. 13). The distribution of the H emission is also very asymmetric and extended (Fig. 4); however the ionized gas demonstrates regular rotation with a possible small kinematical major-axis turn in the very center. The rotation velocities of the gas and star components reveal very different projections over the full extension of our measurements (Fig. 6), so we may suppose different spatial orientations of the stellar and gaseous disks in NGC 3619.
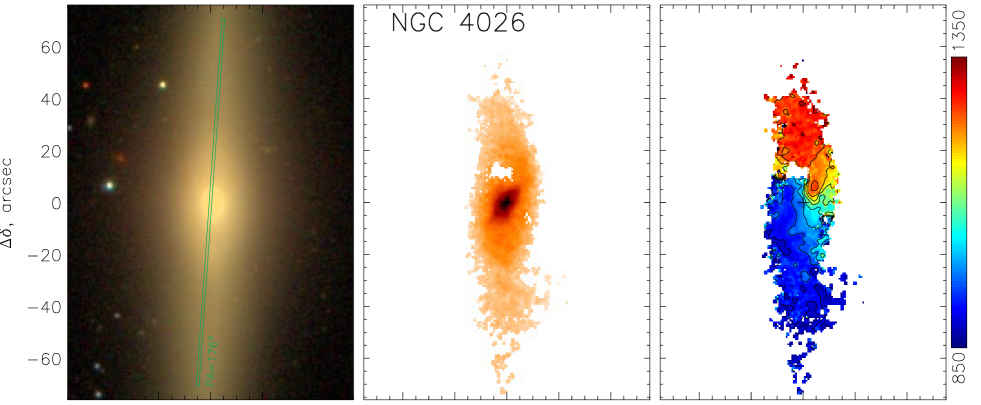
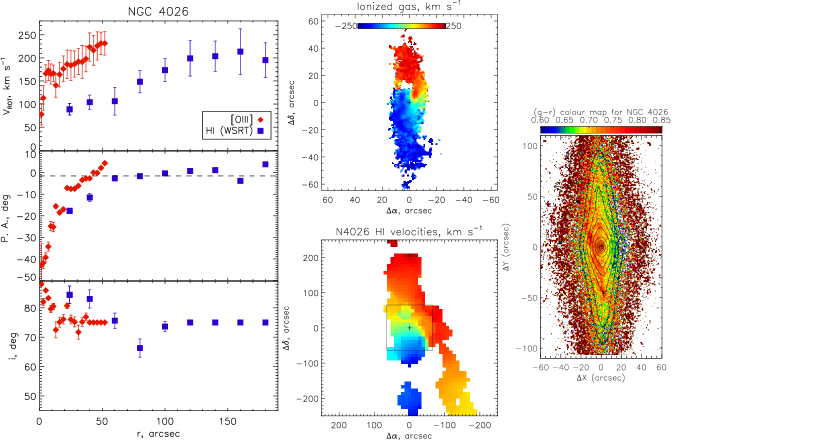
NGC 4026. This edge-on S0 galaxy belongs to a very rich galaxy group, almost cluster, Ursa Major (Odenwald, 1986). The Ursa Major cluster lacks meantime any hot intergalactic medium so neutral-hydrogen streams survive easily within its volume. NGC 4026 has been studied in the frame of the ATLAS-3D survey (Cappellari et al., 2011), and a substantial amount of neutral hydrogen has been detected not only within its disk, but also as a narrow external filament connecting just to the galaxy center (Serra et al., 2012). So we expected decoupled gaseous rotation in this galaxy. Indeed, in the very center the [OIII]5007 demonstrates rapidly rotating gaseous disk strongly inclined to the stellar disk – it is seen in our Fig. 4, as well as in the IFU SAURON emission-line data (Sil’chenko, 2016). However, beyond the central region, the ionized gas is strictly confined to the stellar disk, and its rotation follows the stellar component one exactly (Fig. 6).
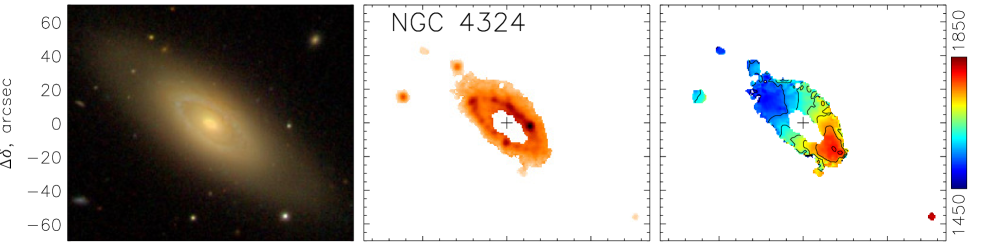
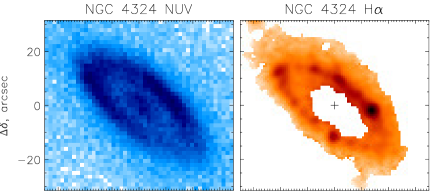
NGC 4324. This lenticular galaxy inhabits outskirts of the Virgo cluster, and it is very gas rich (see the Table 1). It is also a part of the ATLAS-3D survey (Cappellari et al., 2011) and demonstrates a blue starforming ring with a radius of some 2 kpc which also contains all the molecular gas detected so far (Alatalo et al., 2013). However, Duprie & Schneider (1996) detected HI up to 2 optical radii in this galaxy that gave a hope that ionized gas also may be extended beyond the inner starforming ring. Indeed, in Fig. 4 we see clumpy outer starforming regions up to (7.5 kpc) from the center; most of them take part in the general regular rotation of the gaseous disk. However, a few – for example that to the north-east from the galaxy – do not participate in the rotation of NGC 4324 and may be gas-rich satellites.
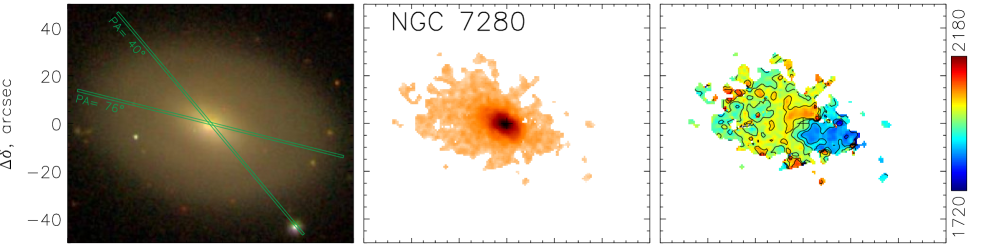
NGC 7280. It is one more lenticular galaxy which attracts our attention for many years. Once we had found an inner polar gaseous ring in the center of NGC 7280 (Afanasiev & Sil’chenko, 2000). Later, in the frame of the ATLAS-3D survey, it has been confirmed that the neutral hydrogen distribution in this galaxy is indeed aligned with the polar axis (Serra et al., 2012). This galaxy was treated as a gas-rich S0 from the beginning (Chamaraux, Balkowski, and Fontanelli, 1987), and star formation was carefully searched for in its disk (Pogge & Eskridge, 1993). But there was no current star formation found in the disk of NGC 7280. Instead, we have discovered counterrotation of the ionized gas with respect to the stars beyond the central region, at (Sil’chenko, 2005). Now, with a full map of the ionized-gas velocities (Fig. 4), we confirm the central compact polar disk; the outer gas is distributed asymmetrically and counterrotates with respect to the stars (Fig. 6).
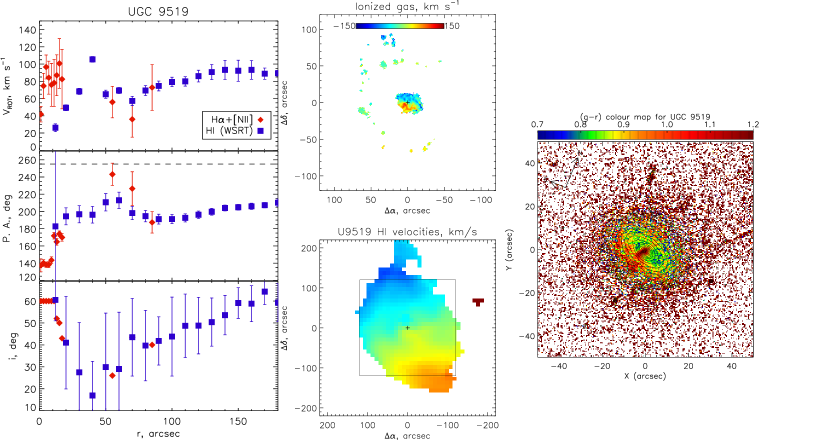
UGC 9519. It is a dwarf lenticular galaxy elongated in ∘ . However in the frame of the ATLAS-3D survey an outer HI ring was found by Serra et al. (2012), well beyond the optical borders of the galaxy, that is elongated in the north-south direction. The long-slit cross-section along the isophote major axis (Fig. 6) has confirmed the decoupled kinematics of the gas and its probable external origin. To obtain a full picture, we have observed UGC 9519 with the scanning Fabry-Perot interferometer in two emission lines, H and [NII]6583. Our anticipation has justified: the inner part of the galaxy, , is well mapped just in the emission line [NII]6583 while in the outer part we resolve the outer starforming ring only in the H emission line; Fig. 4 represents a combination of the [NII] data for the radii less than 20″ and of the H data for the more outer galactic regions. The inner gas rotates in the nearly polar plane with respect to the stellar disk; the outer ionized gas being related surely to the neutral hydrogen detected by Serra et al. (2012) is quite decoupled from the main body of the galaxy.
UGC 12840. This galaxy is a giant, isolated (Karachentseva, 1973), gas-rich lenticular one. Just in this galaxy Pogge & Eskridge (1993) had found extended star formation in the outer ring. We also detect a giant ring, with the radius of some 12.5 kpc, emitting in the H emission line (Fig. 4). Though the galaxy looks almost round, , the projection of the rotation velocity is large, about of km s-1 – and the ionized gas corotates strictly the stellar component. Some non-circular gas motions are possible in the very center of the galaxy.
 |
 |
 |
 |
 |
 |
 |
 |
 |
 |
 |
 |
 |
 |
 |
 |
 |
 |
4.2 Tilted-ring analysis to understand the character of the gas motions.
The profit of two-dimensional velocity fields representing spatially-resolved projection of rotation velocities at various distances from the galactic centers onto our line of sight, is that we can check the circular character of the ionized-gas rotation and derive spatial orientation of the rotation plane if the rotation is circular lacking strong radial motions, expansions or inflows. Indeed, in the case of circular rotation the maximum rotation-velocity projection onto the line of sight is observed at the line of nodes; in its turn, the intrinsically round stellar disk looks like an ellipse with the isophote major axis coincident with the line of nodes. So when the gas is confined to the plane of the galactic disk and while its rotation is circular, we should see the steepest gradient of the observed line-of-sight velocity (‘kinematical major axis’) along the isophote major axis. If the gas rotation is non-circular, that must be the case within a non-axisymmetical potential, the kinematical and photometric major axes would turn in opposite sense with respect to the line of nodes (Vauterin & Dejonghe, 1997). Finally, if we see that the gas kinematical major axis does not coincide with the stellar-disk line of nodes, but this deviation is not accompanied by the symmetric deviation of the photometric major axis within the same radial range, it means that the rotation plane of the ionized gas stands in the space differently from the plane of the stellar disk.
By assuming ionized-gas planar circular rotation within some running radial range, we can derive two angles of its spatial orientation, in general varying along the radius: an inclination of the disk plane to our line of sight and a position angle of its line of nodes tracing gas plane intersection with the sky plane. We have made it by applying to the gas line-of-sight velocity fields tilted-ring analysis (Begeman, 1989) adopted for the ionized-gas FPI data. For this purpose we have used the IDL software DETKA, as described by Moiseev et al. (2004) and Moiseev (2014). The method is based on splitting the observed velocity field into elliptical rings (1″–5″ in wide) oriented according to adopted inclination and line-of-sight position angle of the disk . In all observed galaxies the center of symmetry of a velocity field lies no further than 1″–2″ from the photometric nucleus (the center of the inner isophotes), therefore the galaxy nuclei were fixed as the ring centers. The -minimization was used to fit the observed velocity distribution within every ring by model of quasi-circular rotation with following parameters: kinematical major axis , inclination , rotation velocity , and systemic velocity . As a null approximation for and we adopted the orientation parameters according to the photometric data (HyperLEDA and isophotal analysis results). During the next steps we fixed often the derived at the first step. When the patchy character of a velocity field prevented a stable minimization over three parameters, we chose to fix firstly the inclination , and then ; remained always free. Sometimes we applied an iterative procedure, fixing and by turns. The and were also always fixed in the outer regions, where the elliptical rings contain only few points in the velocity fields. We also masked some local regions notable for their peculiar kinematics, deviating by more than km s-1 from the obtained model; this threshold was individually selected.
Unfortunately, in the most cases the direct tilted-ring fitting described above gives unstable solutions just for due to noises and holes in the ionized-gas velocity fields. The uncomfortable problem consists of relied unphysical chaotic changes of the produced by strong derived variations of with radius. The well-known degeneracy between these two quantities was discussed by numerous authors (Begeman, 1989; Kamphuis et al., 2015). To avoid this problem we performed the following evaluation of the behavior basing on the first-step tilted-ring analysis results. Namely, at every we extracted from the velocity field an elliptical ring oriented in agreement with and obtained as described above. Then we fitted the velocities in the ring using only two free parameters: and , whereas the and were already obtained at this radius and fixed. The next step was to repeat the procedure by fixing the obtained and by leaving free to refine it. Finally, we were able to obtain stable fitting results with a reasonable shape of the rotation curve for the considered galaxies, in their central regions as minimum. The results of this study, including the analysis of the HI velocity fields available in the references are presented in Sec. 5.2–5.4.
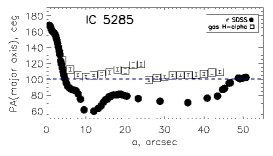
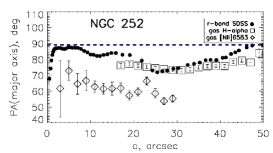
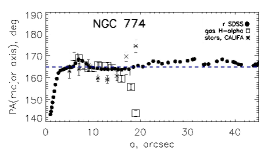
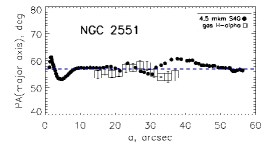
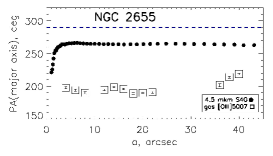
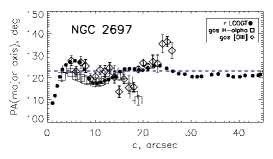
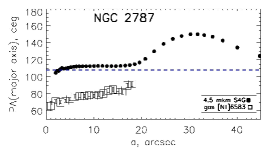
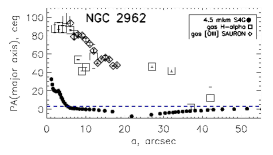
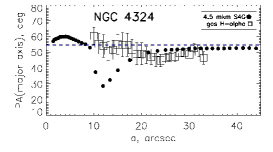
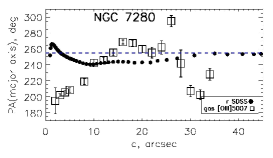
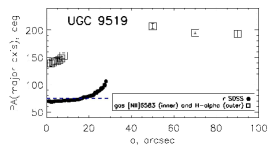
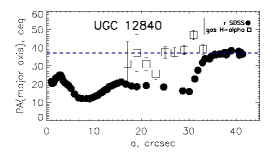
The comparison of the kinematical major axis orientations running along the radius, with the stellar-disk lines of nodes is given in Fig. 8. In these plots presenting the tilted-ring analysis results we have also overlaid the results of isophote analysis – the radial variations of the photometric major-axis position angles. The lines of nodes are fixed from the outermost isophote major-axis orientation (sometimes taken outside the plotted radial range). In some cases we have also in hands the orientations of the kinematical major axes for the stellar components; they are obtained with the same DETKA software by applying it to the data from the ATLAS-3D survey (Cappellari et al., 2011) or from the CALIFA survey (Sánchez et al., 2012, 2016). In these cases we can check independently the circular shape of the stellar disk and the axisymmetry of the gravitational potential.
A quick look at the Fig. 8 reveals a great variety of behavior of the gas kinematical major axis in the gas-rich lenticular galaxies. Sometimes the ionized gas lies in the galactic planes and exhibits regular circular rotation (NGC 252, NGC 2551, NGC 4324), though the gaseous-disk plane may be warped together with the stellar plane (NGC 252), or the gas may counterrotate the stellar rotation (NGC 2551, Sil’chenko et al., 2009). Sometimes the gas lies within the decoupled plane homogeneously inclined to the stellar disk (NGC 2655, NGC 3619). Sometimes the central gas is in the polar plane, but at larger radii it falls into the main galactic plane – and starts to corotate the stellar disk (NGC 2962, NGC 4026) or to counterrotate it (NGC 7280, Fig. 6) or to form a completely detached outer starforming ring (UGC 9519). Sometimes the central region of a galaxy (its bulge?) looks triaxial, with a twisted isophote major axis, but the ionized gas just within the same radial range remains to be confined to the plane of the stellar disk and demonstrates regular circular rotation (IC 5285, UGC 12840, NGC 3106). And the last, perhaps the most interesting class of objects: those with the ionized gas confined to the galactic planes and demonstrating laminar circular rotation, but only within a limited radial range – NGC 774, NGC 2697, NGC 3166, NGC 3182. This latter case will be discussed in some more details below, in Section 5.
4.3 Gas excitation and metallicities
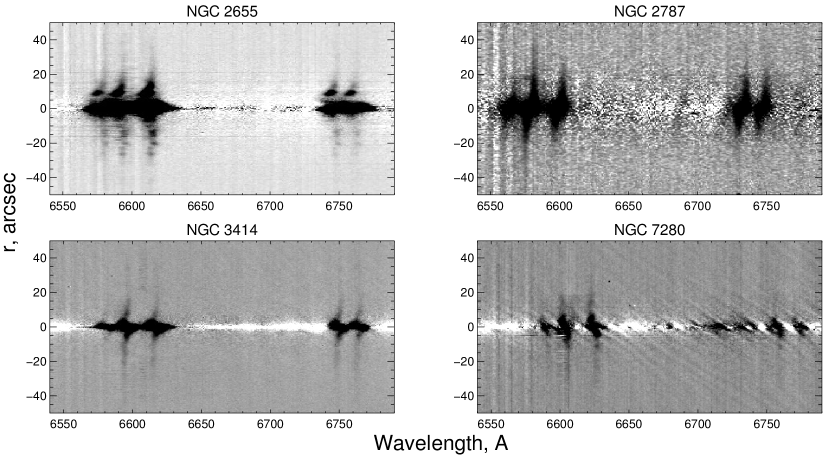
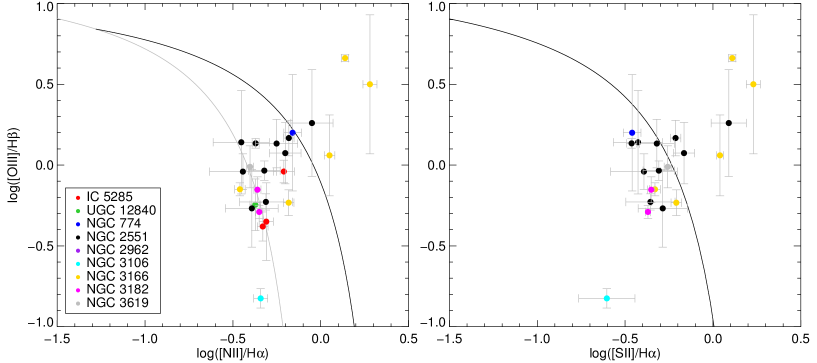
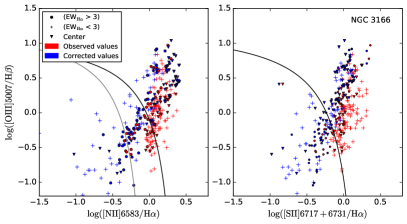
The source of ionized-gas excitation can be determined by analyzing the flux ratios of low-ionization and high-ionization emission lines to Balmer emission lines – at so called BPT (Baldwin-Phillips-Terlevich) diagrams (Baldwin et al., 1981; Veilleux & Osterbrock, 1987). At least, starforming regions demonstrate quite recognizable emission-line spectra; and the models allow to determine the chemical composition – mainly oxygen abundances – by using the flux ratios of strong emission lines just for the case of the gas excited by young stars. We have checked the gas excitation in our S0 galaxies by studying the emission lines in the long-slit spectra obtained with the SCORPIO/BTA; for NGC 774 and NGC 3106 we have used the public spectral datacubes from the CALIFA survey (Sánchez et al., 2016), for NGC 2697 and NGC 4324 – additional spectral data obtained earlier at the 11m SALT of the SAAO with the long-slit spectrograph RSS (Proshina et al., 2019) have been involved into our present analysis. Weak and rather homogeneously distributed along the slit emission lines related to the gaseous disks with strongly decoupled rotation – those in NGC 2655, NGC 2787, NGC 3414, and NGC 7280, – have all demonstrated shock-like excitation: in their spectra the emission line [NII]6583 is comparable or even stronger than the H everywhere along the slit (see 2D spectra obtained along major axes of the mentioned galaxies in Fig. 9). Also similar pattern of emission-line ratios is typical for diffuse ionized gas (DIG) that has allowed to explain diffuse gas excitation in early-type galaxies by old, strongly evolved stars (Binette et al., 1994). The other galaxies demonstrate inhomogeneous clumpy emission-line distributions along the slit (see the example of such behavior in Fig. 10), and we have measured the emission-line flux ratios for the individual clumps. We show the BPT diagrams for these measurements in Fig. 11. The emission from the regions lying under the theoretical ‘maximum starburst line’ from Kewley et al. (2001) can be in principle explained through photoionization by young stars, but composite mechanism of excitation might be responsible for the emission from the clumps lying between this line and empirical Kauffmann et al. (2003) separating sequence. As it follows from Fig. 11, half of the clumps in NGC 3166 and some regions in NGC 2551 clearly demonstrate dominating mechanisms of gas excitation different from photoionization by young stars (e.g., by shocks or by old, post-AGB stars). NGC 774 lies at the border between the HII-region-like excitation and DIG-like or shock-like excitation. All other resolved clumps lie well below the ‘maximum starburst line’, around the Kauffmann et al. (2003) HII-fitting sequence, and their emission can be explained through pure photoionization by young massive stars. So we can determine oxygen abundances of the gas in these clumps by exploring strong-line methods.
In general, accurate oxygen abundances in HII regions can be ‘directly’ derived from measurements of electron temperature-sensitive line ratios, such as [OIII]/[OIII]. This is often referred to as the -method. However, in the most cases it is impossible to measure the faint emission lines like [OIII] in distant galaxies. To avoid this problem many empirical and model-based calibrations relying on strong emission lines only were developed. Despite that, the well-known problem of discrepancy (up to 0.6 dex) of various metallicity calibrations is still not resolved (see, e.g., Kewley & Ellison, 2008). Here we have used several empirical methods to derive oxygen abundances , and have compared their results. Because of the limited spectral range of our data, we selected only those methods that do not demand [OII] line to be observed: S-method (Pilyugin & Grebel, 2016), O3N2, N2 (both from Marino et al., 2013), and D16 (Dopita et al., 2016). Former three of these methods were calibrated using local HII regions with well-known oxygen abundances determined through the -method. The fourth method, D16, is a photoionization model-based one.
Every method used by us has its advantages and disadvantages in comparison with others. Thus, only [NII]/H ratio is needed for the N2 method, but it is applicable only for , gives very large scatter (0.16 dex at 1 level) of the yielding values, and hence provides only rough estimate of the gas metallicity. Another popular method – O3N2 – uses neighboring emission lines ratios, [OIII]/H and [NII]/H, and hence almost does not suffer from uncertainties with reddening correction. This method is applicable within , and shows large dispersion (in average 0.18 dex, but significantly lower for ). Recent studies have shown that the contamination by a large fraction of DIG affects the results obtained with O3N2 method in only small extent (Kumari et al., 2019; Poetrodjojo et al., 2019). The S-method is well-calibrated in the range of and on testing sample yields the results that agree with estimations made by using the -method, with a standard deviation of dex. In its original form this method suffers from reddening uncertainties (which are rather high in our data) because all involved emission-line fluxes ([OIII], [SII], [NII]) should be normalized to the flux of H line. Finally, the D16 method demands only flux ratios of the lines within the red part of a spectrum – [NII]/[SII] and [NII]/H. This method was developed for application to high-z galaxies, and its main advantage is that it doesn’t depend on the ionization parameter or ISM pressure, and hence it might be used safely also for regions having enhanced [NII]/H ratios (e.g., lying in the composite excitation zone at the BPT diagrams). However note that it is still calibrated through the photoionization models that do not include excitation by shocks. This method yields systematically higher oxygen abundances (in comparison with the -method) because of the higher solar abundance used as zero-point in calibration ( instead of 8.69). Unfortunately, authors of the original work do not provide an estimate of typical uncertainty for the D16 calibration.
Taking into account the problems with the metallicity calibrations used in this work, we have applied some corrections to the results making them more comparable with each other:
-
•
All the values of obtained with the D16 method were reduced by 0.08 dex to take into account the different solar oxygen abundance values assumed;
-
•
As an input for the S-method, we have used the [SII]/H and [NII]/H line flux ratios and a proposed theoretical Balmer decrement H/H = 2.86 (Osterbrock & Ferland, 2006). This correction allowed us to reduce significantly the final uncertainty of the oxygen abundance because of getting rid of uncertainties with the reddening estimates.
-
•
All the values beyond the area of applicability of the method used were considered as wrong ones.

| Galaxy namea | Radius, ′′ | EW(H), Å | log([NII]6583/H) | log([OIII]5007/H) | log([SII]6717+6731/H) | [SII]6717/6731 | H |
|---|---|---|---|---|---|---|---|
| I5285 | 5.6 | ||||||
| 24.3 | |||||||
| 31.4 | |||||||
| U12840 | 20.9 | ||||||
| N774b | |||||||
| N2551 | 7.2 | 1.5:: | |||||
| 13.8 | |||||||
| 7.0 | |||||||
| 4.75 | |||||||
| 5.8 | |||||||
| 3.9 | |||||||
| 1.0 | |||||||
| 2.8 | |||||||
| 14.0 | |||||||
| 6.9 | |||||||
| N3106b | 22.5 | ||||||
| N3106b | 43.5 | ||||||
| N3166 | |||||||
| 118 | |||||||
| 4.2 | |||||||
| 1.7 | |||||||
| 13.3 | |||||||
| N3182 | 13.7 | ||||||
| 12.2 | |||||||
| N3619c | 20 |
| Name | , cm-3 | ||||||||
| S | O3N2 | N2 | D16 | ||||||
| IC 5285 | -12.0 | – | – | -0.17 | – | – | – | ||
| IC 5285 | 16.0 | – | – | -0.40 | – | – | – | ||
| IC 5285 | 31.0 | – | – | -0.37 | – | – | – | ||
| UGC 12840 | -20.0 | – | -0.40 | – | – | – | |||
| NGC 774 | 9.0 | – | 1320 | -0.01 | -0.11 | – | |||
| NGC 2551 | -29.0 | – | -0.28 | -0.11 | |||||
| NGC 2551 | -24.0 | – | -0.33 | -0.20 | |||||
| NGC 2551 | -20.0 | – | -0.38 | -0.16 | |||||
| NGC 2551 | -17.0 | 50 | -0.42 | -0.14 | |||||
| NGC 2551 | -14.0 | – | -0.27 | -0.08 | |||||
| NGC 2551 | 12.0 | 120 | -0.05 | 0.09 | – | ||||
| NGC 2551 | 15.5 | – | 390 | 0.11 | 0.40 | – | |||
| NGC 2551 | 19.0 | 190 | -0.11 | 0.09 | |||||
| NGC 2551 | 23.0 | 50 | -0.22 | -0.14 | |||||
| NGC 2551 | 27.0 | 20 | -0.12 | -0.02 | |||||
| NGC 2962 | -63.0 | – | 940 | – | – | – | – | ||
| NGC 3106 | 21.0 | 300 | -0.69 | -0.58 | |||||
| NGC 3166 | -98.0 | – | 80 | -0.44 | -0.14 | ||||
| NGC 3166 | -72.0 | 20 | 0.50 | 0.62 | – | ||||
| NGC 3166 | -27.0 | – | 280 | 0.11 | 0.28 | – | |||
| NGC 3166 | 14.0 | – | 280 | 0.52 | 0.64 | – | |||
| NGC 3166 | 28.0 | 60 | -0.21 | -0.06 | – | ||||
| NGC 3182 | -5.5 | – | 90 | -0.39 | -0.23 | ||||
| NGC 3182 | 5.5 | 100 | -0.35 | -0.17 | |||||
| NGC 3619 | 20.0 | 50 | -0.33 | -0.03 | |||||
The results of the excitation analysis and oxygen abundance estimates are based on the observed flux ratios presented in Table 4 and are summarized in Table 5, where different columns correspond to: name of the galaxy; projected distance of the current clump from the galactic center, in orientation according to Fig. 6; the color excess derived from the observed Balmer decrement; electron density derived from the [SII]6717/6731 flux ratios (Osterbrock & Ferland, 2006) assuming ; and parameters – the shifts from the ‘maximum starburst line’ at the corresponding BPT diagram; the oxygen abundance derived using four methods described above. The listed uncertainties of the oxygen abundances derived do not include systematic uncertainties of the methods, which should be added quadratically.
As it follows from Table 5, for the most of the starforming clumps all the methods yield the values of oxygen abundance consistent with each other within their uncertainties. The strong discrepancies are observed for the clumps in NGC 2551 and NGC 3166 demonstrating non-HII-like mechanism of excitation ( and/or ) – the estimated values of oxygen abundance are not reliable for them. High discrepancy is also observed for the only clump in NGC 774 locating in the transition zone of the BPT-diagram with the N2 abscissa axis and having the highest electron density among all studied objects.
5 Discussion
5.1 Starforming rings in the disk planes of S0 galaxies
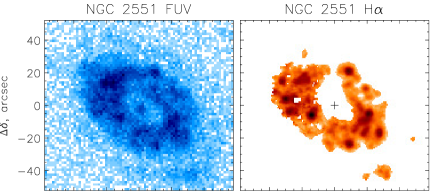
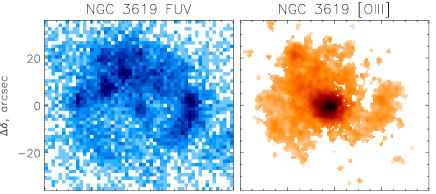
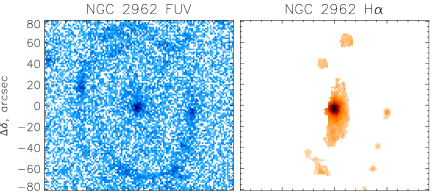
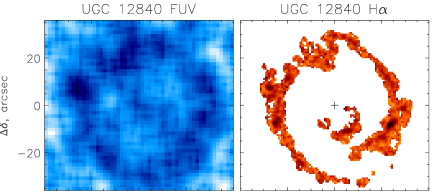
We have checked the galaxies of our sample in the MAST Archive to see if they are detected in the ultraviolet with the GALEX. Indeed, the most of them (12 of 18) are detected in the FUV-band of the GALEX survey (Gil de Paz et al., 2007), and their UV-morphology looks usually ring-like. The UV images of the sample galaxies are shown in Fig. 13. High-contrast ring-like UV structures are clearly visible even in galaxies without rings of very recent star formation traced by the optical emission lines (e.g. NGC 774, NGC 3619, etc.).222The central ‘holes’ in the FPI maps of some galaxies (IC 5285, NGC 774, etc.) are caused by strong H absorption line in the galactic spectra produced by underlying stellar population. We could not take this effect into account, because the spectral range of the FPI data is too small. The UV-rings in NGC 3619 and NGC 4324 were reported earlier by Cortese & Hughes (2009), this in NGC 2962 – by Marino et al. (2011), and the UV-ring in NGC 252 was earlier studied by us through long-slit spectroscopy with the SCORPIO of the Russian 6m telescope in the optical spectral range (Ilyina et al., 2014). The results of the gas excitation analysis within the area of UV-bright rings have shown that the UV-bright rings in S0 galaxies have mostly emission-line spectra typical for the gas excited by young massive stars betraying current star formation. However there are two interesting cases where we have resolved a change of the gas excitation mechanism along the radius. In NGC 2551 at the inner northern edge of the starforming ring series, , the excitation mechanism is composite – the excitation by young stars and by shock waves are both involved, and the electron density is increased just at this radius. In NGC 3166 the distribution of the UV surface brightness is not symmetric with respect to the center, it is lopsided with the most UV radiation emitted to the west from the nucleus. And the only radial zone in NGC 3166 which demonstrates the HII-region-like emission-line spectrum is the western distant (tidal?) arm. All other emission-line rings in NGC 3166 have shock-like or composite gas excitation. Despite the presence of a large-scale bar in NGC 3166, we would conclude therefore that its ring-like emission-line structures have probably the tidal or impact origin being a result of interaction with the neighboring members of the group, NGC 3169 and NGC 3165, and of cold gas accretion from the common HI group envelope (see below, Subsection 5.2).
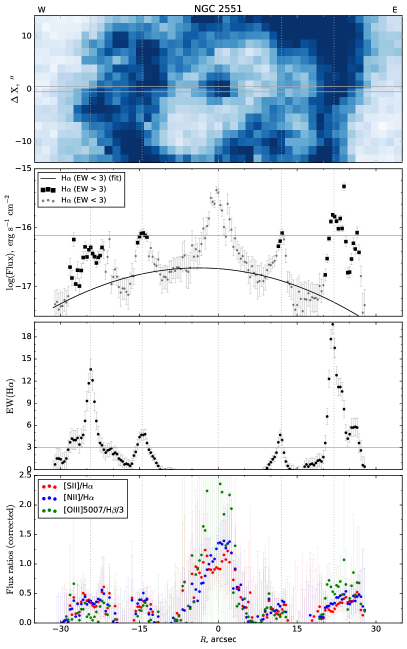
We must discuss here that not only in the case of shocks, but also in a case of DIG domination the enhanced [NII], [SII], and [OIII] lines might be observed. Among the sources considered to be responsible for DIG excitation are the radiation of old hot pAGB stars (Sokolowsky & Bland-Hawthorn, 1991; Binette et al., 1994), the leakage of hard photons from the star-forming regions (Hoopes & Walterbos, 2003), and the shock waves (see discussion in Zhang et al. 2017). As it was argued by, e.g., Flores-Fajardo et al. (2011), low-mass evolved stars might be relevant sources of the gas ionization in S0 galaxies. To consider if the possible contribution of the DIG affects our conclusion about the presence of shocks in some regions of NGC 2551 and NGC 3166 we made a following analysis. We identified the regions crossed by our slits that might be related to the DIG. Various criteria of this exists in the literature: Zhang et al. (2017) proposed to use the H emission-line surface luminosity as an indicator; after conversion to the observed flux per pixel, should be considered as DIG excited by old stars. In the same time, according to Lacerda et al. (2018), Å is expected to be a more precise indicator. In figure 12 we demonstrate the obtained radial profiles of the logarithm of the H line flux, EW(H), and emission lines flux ratios for each galaxy. In the second panel from the top we marked those regions showing Å (and hence surely not related to old stars) by squares, while the regions that might be considered as the DIG are shown by circles. Note that both mentioned criteria can disagree in particular regions. Since we expect a uniform distribution of the old stars in a galaxy, we may also expect a similar distribution of their contribution to the ionization. After excluding the areas with and the central part of the galaxies ( for NGC 2551, for NGC 3166; the ionization conditions in these regions might significantly differ from the rest of the galaxy, and it is out of scope of our analysis) we have performed a second-order robust polynomial fitting of the flux logarithm distribution along the slit. The result is shown in the second panel of the Fig. 12 by solid line. The same fitting was performed for every emission line analyzed; the obtained smooth models were subtracted from the observed fluxes. After that we have compared the emission-line flux ratios in the BPT-diagrams (bottom panel of Fig. 12) before (red color) and after (blue color) correction for the DIG contribution. As it follows from these plots, the performed correction changes the position in the BPT-diagrams of the points classified by us as DIG, but almost does not influence the flux ratios in the regions with Å that were considered earlier as shocks or star-forming rings. Hence, we may conclude that the presence of the DIG doesn’t change our conclusions concerning the gas excitation mechanisms in the emission-line clumps. Note however that we cannot exclude the contribution of the filtered hardened radiation from HII regions in star-forming rings to the enhancement of [NII], [SII], and [OIII] lines. The DIG component ionized by the filtered radiation may be more structured than one ionized by low-mass evolved stars considered above. Hence, one may still expect that the DIG contribution is significant in the studied clumps if there are nearby massive star-forming regions (like it is observed in spiral galaxies, e.g., in M51, Greenawalt et al. 1998 ). However the models of DIG ionized exclusively by filtered quanta doesn’t fully reproduce the enhanced [OIII] emission lines (Weber et al., 2019), while at least for NGC 3166 the ratio of [OIII]5007/H is clearly high in comparison with the clumps related to HII regions (see Figs. 11, 12). So, the ionization by shocks in the clumps above ‘maximum starburst line’ is a preferred mechanism at least for this galaxy.
 |
 |
 |
 |
 |
 |
 |
 |
 |
 |
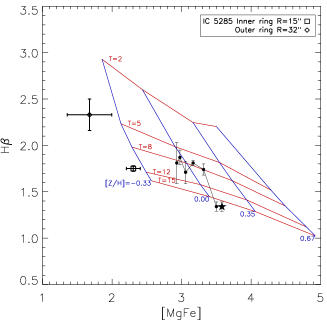
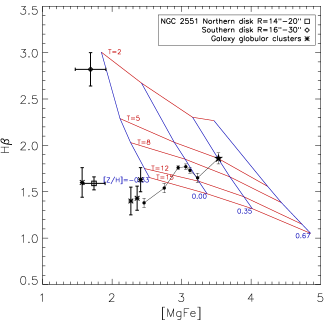
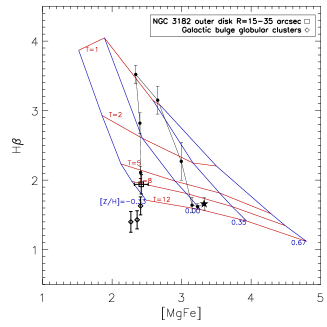
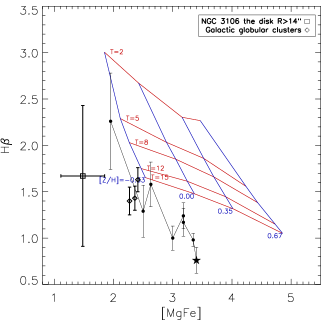
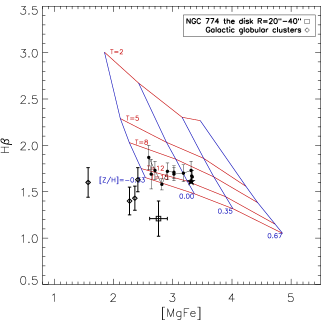
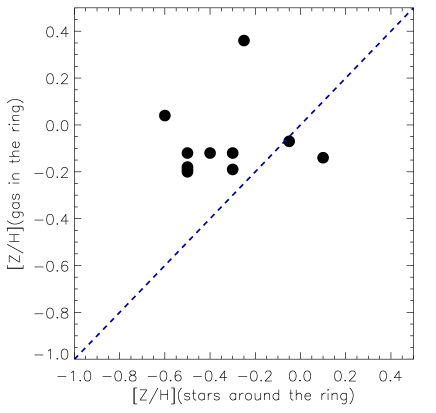
Figure 15 presents some correlations (or the absence of any correlations) related to the UV-rings; for several galaxies (NGC 2697, NGC 2551, IC 5285) we take into account the multiple UV-rings at various radii. The left upper plot demonstrates that the radial localization of the UV-bright starforming rings is not casual: the radii of the rings coincide exactly with the zones where the kinematical major axes are in agreement with the lines of nodes (Fig. 8), or where the gas exhibits laminar circular rotation in the main planes of the stellar galactic disks. The only point which is not close to the equality line is NGC 2962 where the outer ring is traced by our scanning Fabry-Perot only partly due to its extreme patchiness, and the outermost radius catched by the DETKA software is – only two third of the ring radius. From the overall statistics we can conclude that the necessary condition of the star formation triggering in a ring of S0 galaxy is gas concentration strictly in the main plane of a galaxy and laminar circular rotation within this plane. The other three plots of Fig. 15 demonstrate a surprising homogeneity of the gas metallicities within the star-forming rings: they are all concentrated around the slightly subsolar value, dex, and do not correlate neither with the radius of the ring nor with the metallicity of the underlying stellar population estimated here from the Lick indices measured in our long-slit spectra and confronted to the evolutionary synthesis models from Thomas, Maraston, and Bender (2003). The metallicities of the stellar populations are either taken from our earlier works (Ilyina et al., 2014; Proshina et al., 2019), or calculated particularly for this analysis from the spectra obtained with the SCORPIO and SCORPIO-2; for the latter galaxies we show the index–index diagrams in Fig. 14. The details of the stellar population analysis are analogous to our earlier works and can be inspected in Ilyina et al. (2014). The only point with a supersolar metallicity at the Fig. 15 is a starforming ring in NGC 774 which is perhaps dominated by shock-wave excitation (see the BPT analysis above, Fig. 11) and which gas oxygen-abundance estimate in the Table 5 may hence be unreliable.
 |
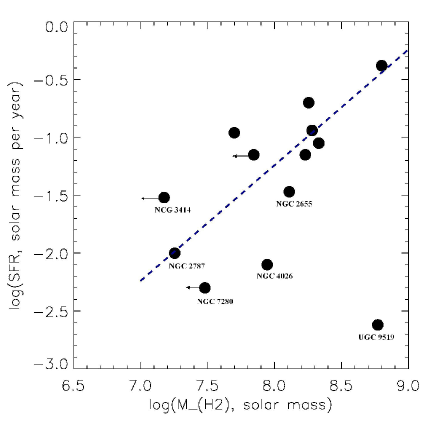 |
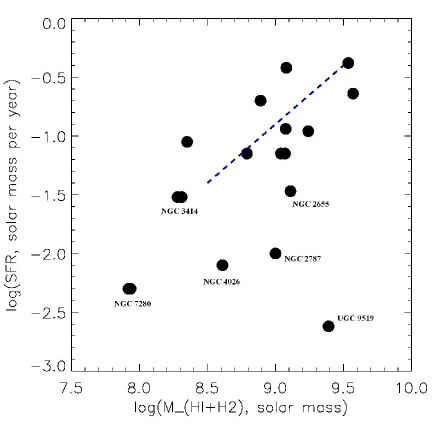
To illustrate once more our thesis about star formation suppression by gas accretion from highly inclined directions, we have calculated integrated star formation rates (SFRs) for our galaxies having the integrated FUV-magnitudes in the NED, by using the calibrations from Lee et al. (2009); and then we have compared these SFR estimates with the total gas content in the galaxies, HIH2 , compiled in our Table 1. The comparison – namely, the Kennicutt-Schmidt relation for our sample – is shown in Fig. 16. One can see that the most galaxies obey the Kennicutt-Schmidt relation with the logarithmic slope of 1, and this picture is consistent both for the SFR confronting to the total gas mass, HIH2 , or to the H2 only. But several galaxies fall below this relation, and these are the galaxies with large polar HI disks (see the subsection 5.3 and the Table 6) or the galaxies where we see outer HI filaments orthogonal to the galactic planes in the HI maps by Serra et al. (2012) (see the next subsection). These galaxies may be very gas-rich, with more than solar masses of neutral hydrogen, as it is observed in NGC 2655 or UGC 9519; but their current star formation is far less intense than we can expect from the Kennicutt-Schmidt relation. Interestingly, the star formation suppression is also detected in UGC 9519 when we consider its H2 content only. The molecular gas in UGC 9519 is confined to the central part of the galaxy; but within this central part it is also distributed in the polar plane (Alatalo et al., 2013)!
5.2 Accretion seen ‘by eye’: neutral hydrogen around NGC 3166, NGC 4026, and NGC 7280
NGC 3166. This galaxy is embedded into a large reservoir of HI together with NGC 3169 (to the east from NGC 3166) and NGC 3165 (to the west from NGC 3166), see new Aresibo and GMRT 21-cm observations in Lee-Waddell et al. (2012)). Outer streams and HI filaments coinciding sometimes with the UV-bright structures revealed by the GALEX are seen to the east-south from the galaxy. The asymmetric inner structure of NGC 3166 looks even more striking when we inspect the data on neutral hydrogen and on the far ultraviolet surface brightness distribution within the galaxy (Fig. 17 and Fig. 13). The HI is mostly concentrated to the east from the nucleus (and in smaller degree in the outer western tidal arm – the only place where the ionized-gas emission-line spectrum reveals excitation by young stars), while the far-ultraviolet radiation – to the west from the nucleus. Moreover, the color is extremely red to the east from the nucleus, which may be caused by asymmetric dust distribution or by other, than star formation, nature of the UV radiation just over this region. Here it is the point to mention that already Taniguchi et al. (1994) noted the stronger horn of the CO-line at receding velocities – or to the west from the nucleus where we see now the extended FUV signal. In the situation when the neutral hydrogen is localized in one half of the galaxy, and the star formation (UV and H) – at the opposite side of the galaxy where the molecular gas is also more prominent, we can only suggest a recent event of the gas acquisition, less than one orbital period ago. The whole geometry of the accretion implies the cold atomic gas infall under almost right angle into the disk to the east from the galactic center where shock gas excitation dominates in the emission-line spectrum. Further gas re-distribution over the whole galactic disk proceeds probably in strongly turbulent regime, because we see the gaseous disk precession near the center (Fig. 8). The gas compression along the trajectories of orbital rotation provides current formation of molecular clouds and current star formation to the west from the galactic center. So the star-forming ring in NGC 3166 is still incomplete.
NGC 4026. It is another galaxy where a highly elongated HI filament which is almost perpendicular to the galaxy plane seen edge-on is observed in the wide galaxy outskirts (Serra et al., 2012). This time the gaseous stream penetrates NGC 4026 just near the center at the right angle. As a result, we see nearly polar rotation of the gas traced by the [OIII]5007 emission line up to (Fig. 4). In the outer part of the galaxy, within the area dominated by the large-scale disk, the ionized gas as well as the neutral hydrogen are confined to the galactic plane (Fig. 17) and rotate together with the stellar component of the disk. Interestingly, despite the rather large amount of the gas in the galaxy and its rather regular distribution and kinematics, no traces of star formation are found all over the galaxy – no H emission lines, no far-ultraviolet signal.


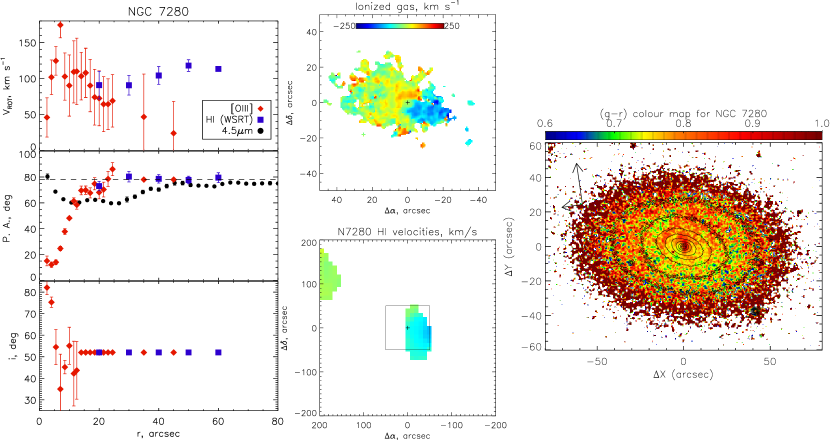
NGC 7280. This galaxy is quite similar to NGC 4026 in all aspects but one. Lacking current star formation and H emission lines in the disk spectrum, it has a circumnuclear polar disk, seen both in the ionized-gas kinematics (Fig. 4) and in the HI distribution (Serra et al., 2012); but in the outer-disk area the gas counterrotates the stars. NGC 7280 is not exactly edge-on, and our surface photometry reveals some signs of triaxiality in its center (Afanasiev & Sil’chenko, 2000, and see the isophote turn in Figs. 8 and 17, right); however the outer gas rotation looks circular though in opposite sense than that of the stars.
5.3 Extended inclined gaseous disks: neutral hydrogen around NGC 2655, NGC 2787, NGC 3414, NGC 3619, and UGC 9519
NGC 2655. The galaxy was mapped in HI and analyzed in detail by Sparke et al. (2008). The outer HI distribution resembled a huge disk, with the radius exceeding the optical one by a factor of 2, and the orientation of this disk in its outer parts was strongly different from the orientation of the stellar disk. However, the HI velocity field obtained with a spatial resolution about of ( kpc) looked bisymmetrical, and Sparke et al. (2008) had constructed a model of a strongly warped, circularly rotating gaseous disk produced probably by multiple minor mergers a few Gyr ago. Indeed, NGC 2655 is a center of a group, and several small gas-rich galaxies are still seen not far from it. The multiple mergers are needed because the total mass of neutral hydrogen in the galaxy, solar masses, is too large to be provided by a single satellite sinking. Our present data revealing strong velocity anomaly close to the center, in some to the north, puts into doubt a relaxed character of the gas distribution in the galaxy; perhaps, satellite ingestion by NGC 2655 continues just now. We see no signs of current star formation in and around NGC 2655, and this conclusion coincides with the opinion by Sparke et al. (2008).
NGC 2787. The galaxy was mapped in the 21 cm line with the WSRT by Shostak (1987). He reported a HI ring with a radius of 10 kpc, beyond the optical borders of the galaxy, with regular circular rotation implying the orientation of the line of nodes of the gaseous disk plane in ∘ ∘ . It is almost orthogonal to the inner rotation plane of the ionized gas (Fig. 8) and also strongly different from the orientation of the stellar disk, ∘ . The gaseous disk isovelocity contour twist in the central part of NGC 2787 may be explained by a strong bar aligned in ∘ ; perhaps the gas when inflowing to the center is settling into a main plane of the triaxial potential orthogonally to the bar major axis. But the outer neutral hydrogen strongly decoupled from the stellar body is evidently accreted from outside though NGC 2787 is recognized as a completely isolated S0. Again, any star formation is absent over the whole galaxy extension.
NGC 3414. An extended, regularly rotating HI disk of this peculiar S0 galaxy has been mapped by Morganti et al. (2006). Earlier the galaxy was included into the first survey with the SAURON and later classified as a slow rotator though S0 (Emsellem et al., 2007). In fact, the low projected stellar rotation of NGC 3414 is not unexpected because of the disk orientation nearly face-on (Salo et al., 2015). However, the gaseous disk extending up to looks much more inclined to the sky plane, and so much faster rotating, up to km s-1 (Morganti et al., 2006). The kinematical major axis and visible elongation of the large-scale gaseous disk is ∘ (see Fig. 17) that differs from the stellar isophote major axis, ∘ (Salo et al., 2015), and from the thin ‘bar’ elongation in ∘ . In the very center, , the gas rotation plane starts to turn, and the kinematical major axis traced by the [OIII]5007 emission-line velocity field aligns with the ‘bar’ (Fig. 4). In Fig. 8 we have plotted the ionized-gas kinematical major axis orientation by fat black squares (our Fabry-Perot data) and by pale squares (SAURON [OIII]5007 velocity map); both data sets consistently indicate strong turn of the kinematical major axis by ∘ , toward ∘ at . This ‘polar’ velocity structure is aligned with the morphological feature in ∘ which is sometimes described as a bar and sometimes – as a polar ring (Whitmore et al., 1990). Since the stellar photometric and gas kinematical major axes coincide at , the data are more consistent with the hypothesis of a polar disk; however this polar disk seen strictly edge-on lacks any gas at . Again, over the whole extension of the gas distribution any star formation is absent (Shapiro et al., 2010).
NGC 3619. The neutral hydrogen had been mapped in this galaxy as early as in 1989 (van Driel et al., 1989) with the WSRT. The whole gas distribution resembled an inner ring embedded into the optical body of the galaxy. The stellar velocity maps were obtained twice, in the frames of the panoramic spectral surveys ATLAS-3D (Krajnovic et al., 2011) and CALIFA (Garcia-Lorenzo et al., 2015; Sánchez et al., 2016), and we have made the tilted-ring analysis of the both velocity fields. The combined analysis of the stellar kinematics and surface brightness distributions retrieved from SDSS and S4G (Sheth et al., 2010) surveys implies that the stellar disk of this galaxy is seen nearly face-on: the isophote ellipticity is approximately 0.1 that gives us the inclination of 25∘ under the disk relative thickness of 0.22 (Chudakova & Sil’chenko, 2014), and the kinematical inclination provided by the tilted-ring analysis is also ∘ at . However the visible cold gas rotation velocity in the inner region of the galaxy measured through the interferometric mapping of CO (Alatalo et al., 2013), HI (van Driel et al., 1989), and our H data, is 200 km s-1 resulting in kinematical inclination estimate of about 50∘ . The line-of-nodes position angles are also different: 85∘ – 90∘ for the gas against ∘ for the stellar component (Fig. 8 and Fig. 17). It means that the gaseous disk in its central part is strongly inclined with respect to the stellar disk plane; the southern part of the gaseous disk is the nearest to us because we see a red dust lane projected against the bulge at the color map (Fig. 17). Interestingly, the UV-ring at the radius of in NGC 3619 is absolutely round that implies the gas compression strictly within the plane of the stellar disk. Perhaps, in the outer parts of the disk the gaseous sheet falls completely into the main plane of the galaxy – see the profiles of the left plot of Fig. 17 beyond .
UGC 9519. Recent deep mapping of the neutral hydrogen in UGC 9519 by Zhang et al. (2019) has revealed multi-tiered structure of cold gas distribution in this galaxy. Zhang et al. (2019) identify three main zones of this distribution: the center, , the inner ring, , and the outer ring at , or kpc! Our Fabry-Perot data obtained in two emission lines, H and [NII]6583, trace the central zone which lacks any star formation and rotates with the line of nodes in ∘ , in polar orientation with respect to the stellar disk, and also the inner ring, up to , rotating in a plane with the line of nodes in ∘ ; so our data are completely consistent with the HI orientation and rotation (Fig 17). The ‘inner’ ring is detached from the main galactic stellar body; it demonstrates the gas excitation by young stars (our long-slit data) and high UV surface brightness (Zhang et al., 2019) so being certainly a starforming ring. Curiously, the molecular gas is concentrated in the central part of the galaxy (Alatalo et al., 2013) where there is no star formation; it rotates together with the ionized gas, in the polar orientation with respect to the main galactic disk.
5.4 Long-lived inclined gaseous disks as treated by dynamics
A problem of possible steady state of inclined gaseous disks was studied more than once as a general problem of galaxy dynamics. It was provoked partly by impressive phenomenon of large-scale polar rings, partly by understanding inevitable (common) gas accretion from an arbitrary direction. So in 1980th-1990th this problem had been solved both analytically, for a case of a spheroidal potential – e.g. by Steiman-Cameron & Durisen (1988), – and by numerical simulations, for a case of triaxial tumbling potential – e.g. by Colley & Sparke (1996). It was shown that in the case of quasi-axisymmetrical potential the gas acquired under a moderate inclination – say, under 40∘ – had to settle into a main galactic plane in several precession period, that corresponded for a medium-mass galaxy to 1 Gyr in the center, kpc, and much longer, Gyr, at kpc (Steiman-Cameron & Durisen, 1988). Christodoulou & Tohline (1993) considered three initial directions of gas acquisition, from under 10∘ , 40∘ , and 80∘ to the equatorial plane, and had found significant differences in the gas behavior: the gas acquired under 10∘ settled into the main plane after 22-25 orbital periods, the gas acquired under 40∘ settled after 11-13 orbital period, but after 8 orbital period the disk started to suffer violent gas inflow to the center; and the gas acquired at 80∘ conserved its orientation during the Hubble time but suffered also some radial inflow. Finally, within the triaxial potential the gas could settle in one of two main planes – to that orthogonal to the longest axis or to that orthogonal to the shortest axis, and the whole dynamical evolution allowed to form steady-state polar rings/disks (Colley & Sparke, 1996).
Recently Mapelli, Rampazzo, and Marino (2015) have presented the simulation of building large–scale (about 20 kpc in diameter) rings via a minor merger between a lenticular galaxy and its gas-rich satellite. The estimated living time of the ring structures has appeared to be less than 3 Gyr if the rings form from prograde encounters, whereas it can reach 4–6 Gyr after counter–rotating or non–coplanar (inclined by 45∘ or 90∘ ) interactions.
In any case, the dynamical settling of an outer gaseous disk, with a radius of kpc, requires a very long time, so for our particular galaxies described in the previous subsection we can consider them as stationary structures, and so we can try to estimate the accretion direction by comparing the current spatial orientation of the outer HI disk with that of the stellar disk. We have made this attempt, and the results are given in the Table 5. The orientations of the HI disks are taken from the papers mentioned in the previous subsection, and for NGC 3619 and UGC 9519 – from our own analysis of the WSRT interferometric velocity fields. The orientations of the stellar disks are taken from the photometric decomposition results of the S4G survey (Salo et al., 2015), and for UGC 9519 we have calculated the orientation parameters of the stellar rotation plane by applying the tilted-ring technique to the public SAURON data. The last column gives the estimated angles between the stellar and gaseous planes. For this calculation we have used the formula which is published by Moiseev (2012). Two values are given for every galaxy because of the uncertainty with the nearest side of any disk. Interestingly, most galaxies with the steady-state extended HI disks have a possible variant of their nearly polar orientation with respect to the stellar disks. Only NGC 3619 has the neutral-hydrogen disk with the certainly intermediate inclination; it is the smallest of all, and it contains an inner starforming ring. Perhaps, we could also note some additional consequences of the gas inflow through the inclined gaseous disks: in the galaxies with the large bars, NGC 2787 and perhaps UGC 9519, the central gas has settled into the planes orthogonal to the long axes of their bars.
| Galaxy | Stellar disk | Outer HI disk | The angle between the stellar | ||
|---|---|---|---|---|---|
| PA(line of nodes) | Inclination | PA(line of nodes) | Inclination | and HI disks | |
| NGC 2655 | 110∘ | 20∘ | –60∘ | 60∘ | 80∘ or 40∘ |
| NGC 2787 | 108∘ | 56∘ | 140∘ | 42∘ | 27∘ or 93∘ |
| NGC 3414 | 12.6∘ | 33∘ | 150∘ | 40∘ | 67∘ or 26∘ |
| NGC 3619 | 63.5∘ | 21.5∘ | 73∘ | 30∘ | 10∘ or 51∘ |
| UGC 9519 | 250∘ | 55∘ | 200∘ | 40∘ | 39∘ or 84∘ |
6 Summary
We have presented the results of our spectral study of gaseous disks in 18 S0 galaxies undertaken with the facilities of the Russian 6m telescope of the Special Astrophysical Observatory; both panoramic spectroscopy with the scanning Fabry-Perot interferometer and long-slit spectroscopy over wide spectral range with SCORPIO have been used. The gas in S0s is commonly accreted from outside that is implied by its decoupled kinematics: at least 5 galaxies demonstrate extended, strongly inclined HI disks smoothly coupled with an inner ionized-gas component, in 3 galaxies we see HI accretion directly, as thin filaments coming into the galactic disks under right angle; 7 galaxies reveal circumnuclear polar ionized-gas rotation, and in NGC 2551 the ionized gas – and neutral hydrogen too (Tang et al., 2008) – though confined to the main galactic plane however counterrotates the stellar component. The ionized-gas excitation analysis at the BPT-diagrams reveals the gas ionization by young massive stars in 12 of 18 S0 galaxies studied by us; the current star formation in these galaxies is confined to the ring-like zones coinciding with the UV-rings seen at the galaxy images provided by the GALEX survey. The UV-ring in NGC 774 though suffering current star formation (a SNII is detected recently in this galaxy) reveals the gas excitation mostly dominated by shock waves. We have applied the tilted-ring analysis to the 2D velocity fields of the ionized gas (and also of the neutral hydrogen in some objects). Tracing the orientation of the gas rotation-plane lines of nodes along the radius, we have found that current star formation proceeds usually at the radii where the gas lies in the stellar disk planes and rotates circularly; the sense of the gas rotation does not matter (NGC 2551 forms stars!). In the galaxies without current star formation the extended gaseous disks are either in a steady-state quasi-polar orientation (NGC 2655, NGC 2787, NGC 3414), or are acquired just now through the infalling highly inclined external filaments provoking probably shock-wave excitation (NGC 4026, NGC 7280). Our data implies perhaps crucial difference of the external gas accretion regime in S0s with respect to spiral galaxies: the geometry of the gas accretion in S0s is typically off-plane.
References
- Afanasiev & Sil’chenko (2000) Afanasiev, V.L., Sil’chenko, O.K., 2000, AJ, 119, 126
- Afanasiev & Moiseev (2005) Afanasiev, V.L., Moiseev, A.V., 2005, Astronomy Letters, 31, 193 (astro-ph/0502095)
- Afanasiev & Moiseev (2011) Afanasiev, V. L., & Moiseev, A. V., 2011, Baltic Astronomy, 20, 36
- Alatalo et al. (2013) Alatalo, K., Davis, T.A., Bureau, M., Young, L. M., Blitz, L., et al., 2013, MNRAS, 432, 1796
- Andersen et al. (2001) Andersen, D. R., Bershady, M. A., Sparke, L.S., et al., 2001, ApJ, 551, L131
- Baade (1975) Baade, W., 1975, Evolution of stars and galaxies, Cambridge, MA (USA): MIT Press
- Bacon et al. (2001) Bacon, R., Copin, Y., Monnet, G., et al. 2001, MNRAS, 326, 23
- Baggett et al. (1998) Baggett, W. E., Baggett, S. M., Anderson, K. S. J. 1998, AJ, 116, 1626
- Baldwin et al. (1981) Baldwin, J. A., Phillips, M. M., Terlevich, R. 1981, PASP, 93, 5
- Beasley et al. (2004) Beasley, M. A., Brodie, J. P., Strader, J., et al. 2004, AJ, 128, 1623
- Begeman (1989) Begeman K. G. 1989, A&A, 223, 47
- Bertola et al. (1992) Bertola, F., Buson, L. M., Zeilinger, W. W., 1992, ApJ, 401, L79
- Binette et al. (1994) Binette, L., Magris, C. G., Stasińska, G., Bruzual, A. G. 1994, A&A, 292, 13
- Bournaud et al. (2005) Bournaud, F., Combes, F., Jog, C. J., Puerari, I., 2005, A&A, 438, 507
- Cappellari (2016) Cappellari, M., 2016, ARA&A, 54, 597
- Cappellari et al. (2011) Cappellari, M., Emsellem, E., Krajnovic, D., et al., 2011, MNRAS, 413, 813
- Chamaraux et al. (1987) Chamaraux, P., Balkowski, C., & Fontanelli, P., 1987, A&AS, 69, 263
- Chitre & Jog (2002) Chitre, A., Jog, C. I. 2002, A&A, 388, 407
- Christodoulou & Tohline (1993) Christodoulou, D. M., Tohline, J. E. 1993, ApJ, 403, 110
- Chudakova & Sil’chenko (2014) Chudakova, E. M., Sil’chenko, O. K., 2014, Astron. Rep., 58, 281
- Colley & Sparke (1996) Colley, W. N., Sparke, L. S. 1996, ApJ, 471, 748
- Cortese & Hughes (2009) Cortese, L., Hughes, T. M., 2009, MNRAS, 400, 1225
- Davis et al. (2011) Davis, T. A., Alatalo, K., Sarzi, M., Bureau, M., Young, L. M., et al., 2011, MNRAS, 417, 882
- Dopita et al. (2016) Dopita, M. A., Kewley, L. J., Sutherland, R. S., Nicholls, D. C., 2016, Astrophys. Space Sci., 361, 61
- Duprie & Schneider (1996) Duprie, K., Schneider, S. E., 1996, AJ, 112, 937
- Eder et al. (1991) Eder, J., Giovanelli, R., Haynes, M. P., 1991, AJ, 102, 572
- Emsellem et al. (2007) Emsellem, E., Cappellari, M., Krajnovic, D., van de Ven, G., Bacon, R., et al., 2007, MNRAS, 379, 401
- Flores-Fajardo et al. (2011) Flores-Fajardo, N., Morisset, C., Stasińska, G., Binette, L., 2011, MNRAS, 415, 2182
- Franx & de Zeeuw (1992) Franx, M., de Zeeuw, P. T., 1992, ApJ, 392, L47
- Garcia-Lorenzo et al. (2015) Garcia-Lorenzo, B., Marquez, I., Barrera-Ballesteros, J. K., Masegosa, J., Husemann, B., et al., 2015, A&A, 573, Aid. 59
- Gil de Paz et al. (2007) Gil de Paz, A., Boissier, S., Madore, B. F., Seibert, M., Joe, Y. H., et al., 2007, ApJS, 173, 185
- Gomes et al. (2016) Gomes, J. M., Papaderos, P., Vilchez, J. M., Kehrig, C., Iglesias-Paramo, J., et al., 2016, A&A, 585, Aid. 92
- Greenawalt et al. (1998) Greenawalt, B., Walterbos, R. A. M., Thilker, D., Hoopes, C. G., 1998, ApJ, 506, 135
- Haynes (1981) Haynes, M. P., 1981, AJ, 86, 1126
- Haynes et al. (2011) Haynes, M. P., Giovanelli, R., Martin, A. M., Hess, K. M., Saintonge, A., et al., 2011, AJ, 142, Aid. 170
- Hoopes & Walterbos (2003) Hoopes, C. G., Walterbos, R. A. M. 2003, ApJ, 586, 902
- Hubble (1936) Hubble, E. P., 1936, The Realm of the Nebulae (New Haven: Yale Univ. Press)
- Ilyina et al. (2014) Ilyina, M. A., Sil’chenko, O. K., Afanasiev, V. L., 2014, MNRAS, 439, 334
- Kamphuis et al. (2015) Kamphuis, P., Józsa, G. I. G., Oh, S.-. H., Spekkens, K., Urbancic, et al. 2015, MNRAS, 452, 3139
- Karachentseva (1973) Karachentseva, V. E., 1973, Astrof. Issledovanija Spec. Astrophys. Obs., 8, 3
- Katkov et al. (2014) Katkov, I. Yu., Sil’chenko, O. K., Afanasiev, V. L., 2014, MNRAS, 438, 2798
- Katkov et al. (2015) Katkov, I. Yu., Kniazev, A. Yu., Sil’chenko, O.K. 2015, AJ, 150, Aid.24
- Kauffmann et al. (2003) Kauffmann G., Heckman, T. M., Tremonti, Ch., Brinchmann, J., Charlot, S., et al., 2003, MNRAS, 346, 1055
- Kewley et al. (2001) Kewley, L. J., Dopita, M. A., Sutherland, R. S., Heisler, C. A., Trevena, J., 2001, ApJ, 556, 121
- Kewley & Ellison (2008) Kewley, L. J., Ellison, S. L., 2008, ApJ, 681, 1183
- Knapp et al. (1985) Knapp, G. R., Turner, E. L., and Cunniffe, P. E., 1985, AJ, 90, 454
- Koleva et al. (2009) Koleva, M., Prugniel, P., Bouchard, A., & Wu, Y. 2009, A&A, 501, 1269
- Kostyuk (1975) Kostyuk, I.P., 1975, Soob. Spets. Astrofiz. Obs., 13, 45
- Krajnovic et al. (2011) Krajnovic, D., Emsellem, E., Cappellari, M., Alatalo, K., Blitz, L., et al., 2011, MNRAS, 414, 2923
- Kumari et al. (2019) Kumari, N., Maiolino, R., Belfiore, F., Curti, M., 2019, MNRAS, 485, 367
- Lang et al. (2010) Lang, D., Hogg, D. W., Mierle, K., Blanton, M., & Roweis, S. 2010, AJ, 139, 1782
- Laurikainen et al. (2010) Laurikainen, E., Salo, H., Buta, R., Knapen, J. H., Comerón, S. 2010, MNRAS, 405, 1089
- Lee et al. (2009) Lee, J. C., Gil de Paz, A., Tremonti, Ch., Kennicutt, R. C., Jr., Salim, S., et al., 2009, ApJ, 706, 599
- Lee-Waddell et al. (2012) Lee-Waddell, K., Spekkens, K., Haynes, M. P., Stierwalt, S., Chengalur, J., Chandra, P., Giovanelli, R., 2012, MNRAS, 427, 2314
- Lisenfeld et al. (2011) Lisenfeld, U., Espada, D., Verdes-Montenegro, L., Kuno, N., Leon, S., et al., 2011, A&A, 534, Aid. 102
- Lacerda et al. (2018) Lacerda, E. A. D., Cid Fernandes, R., Couto, G. S., Stasińska, G., Garc ́Ia-Benito, R., et al., 2018, MNRAS, 474, 3727
- Marino et al. (2011) Marino, A., Bianchi, L., Rampazzo, R., Thilker, D., Annibali,F., et al., 2011, ApJ, 736, Aid. 154
- Marino et al. (2013) Marino, R. A., Rosales-Ortega, F. F., Sánchez, S. F., Gil de Paz, A., Vílchez, J., et al., 2013, A&A, 559, Aid. 114
- Mapelli et al. (2015) Mapelli, M., Rampazzo, R., Marino, A., 2015, A&A, 575, 16
- Mateus et al. (2006) Mateus, A., Sodré, L., Cid Fernandes, R., et al., 2006, MNRAS, 370, 721
- Moiseev (2002) Moiseev, A. V., 2002, Bull. of the SAO, 54, 74
- Moiseev (2012) Moiseev, A. V., 2012, Astrophys. Bull., 67, 147
- Moiseev & Egorov (2008) Moiseev, A. V., Egorov O.V., 2008, Astrophys. Bull., 63, 181
- Moiseev (2014) Moiseev, A. V., 2014, Astrophys. Bull., 68, 371
- Moiseev et al. (2004) Moiseev, A. V., Valdés, J. R., Chavushyan, V. H., 2004, A&A, 421, 433
- Morganti et al. (2006) Morganti, R., de Zeeuw, P. T., Oosterloo, T. A., et al., 2006, MNRAS, 371, 157
- Odenwald (1986) Odenwald, S. F., 1986, ApJ, 310, 86
- Osterbrock & Ferland (2006) Osterbrock D. E., Ferland G. J., 2006, Astrophysics of gaseous nebulae and active galactic nuclei, 2nd edn. University Science Books
- O’Sullivan et al. (2018) O’Sullivan, E., Combes, F., Salomé, P., et al., 2018, A&A, 618, Aid. 126
- Poetrodjojo et al. (2019) Poetrodjojo, H., D’Agostino, J.J., Groves, B., Kewley, L., Ho, I.-T., Rich, J., Madore, B.F., Seibert, M., 2019, MNRAS, 487, 79
- Pilyugin & Grebel (2016) Pilyugin, L. S., Grebel, E. K., 2016, MNRAS, 457, 3678
- Rix & Zaritsky (1995) Rix, H.-W., Zaritsky, D., 1995, ApJ, 447, 82
- Pogge & Eskridge (1993) Pogge, R. W., Eskridge, P. B., 1993, AJ, 106, 1405
- Proshina et al. (2019) Proshina, I. S., Kniazev, A. Yu., Sil’chenko, O. K., 2019, AJ, 158, Aid. 5
- Roberts et al. (1991) Roberts, M. S., Hogg, D. E., Bregman, J. N., Forman, W. R., Jones, Ch., 1991, ApJS, 75, 751
- Sage & Welch (2006) Sage, L. J., Welch, G. A., 2006, ApJ, 644, 850
- Salo et al. (2015) Salo, H., Laurikainen, E., Laine, J., Comeron, S., Gadotti, D., et al., 2015, ApJS, 219, Aid. 4
- Sánchez et al. (2012) Sánchez, S. F., Kennicutt, R. C., Gil de Paz, A., Van de Ven G., Vilchez, J. M., et al., 2012, A&A, 538, Aid. 8
- Sánchez et al. (2016) Sánchez, S. F., Garcia-Benito, R., Zibetti, S., Walcher, C. J., Husemann, B., et al., 2016, A&A, 594, Aid. 36
- Sarzi et al. (2006) Sarzi, M., Falcon-Barroso, J., Davies, R. L., Bacon, R., Bureau, M., et al., 2006, MNRAS, 366, 1151
- Schweizer & Seitzer (1988) Schweizer, F., Seitzer, P., 1988, ApJ, 328, 88
- Serra et al. (2012) Serra, P., Oosterloo, T., Morganti, R., Alatalo, K., Blitz, L., et al., 2012, MNRAS, 422, 1835
- Shapiro et al. (2010) Shapiro, K. L., Falcon-Barroso, J., van de Ven, G., de Zeeuw, P. T., Sarzi, M., et al., 2010, MNRAS, 402, 2140
- Sheth et al. (2010) Sheth, K., Regan, M., Hinz, J. L., et al., 2010, PASP, 122, 1397
- Shostak (1987) Shostak, G. S., 1987, A&A, 175, 4
- Sil’chenko (2005) Sil’chenko, O.K., 2005, Astron. Letters, 31, 227
- Sil’chenko (2016) Sil’chenko, O.K., 2016, AJ, 152, Aid.73
- Sil’chenko & Burenkov (1990) Sil’chenko, O.K., Burenkov, A.N., 1990, A&A, 233, 314
- Sil’chenko & Afanasiev (2004) Sil’chenko, O.K., Afanasiev, V.L., 2004, AJ, 127, 2641
- Sil’chenko & Afanasiev (2006) Sil’chenko, O.K., Afanasiev, V.L., 2006, Astron. Lett., 32, 534
- Sil’chenko et al. (2009) Sil’chenko, O.K., Moiseev, A.V., and Afanasiev, V.L., 2009, ApJ, 694, 1550
- Sil’chenko et al. (2012) Sil’chenko, O. K., Proshina, I. S., Shulga, A. P., & Koposov, S. E., 2012, MNRAS, 427, 790
- Simoes Lopes et al. (2007) Simoes Lopes, R. D., Storchi-Bergmann, T., de Fatima Saraiva, M., Martin, P., 2007, ApJ, 655, 718
- Sokolowsky & Bland-Hawthorn (1991) Sokolowski, J., Bland-Hawthorn, J., 1991, PASP, 103, 911
- Sparke et al. (2008) Sparke, L. S., van Moorsel, G., Erwin, P., Wehner E. M. H., 2008, AJ, 135, 99
- Steiman-Cameron & Durisen (1988) Steiman-Cameron, T. Y., Durisen, R. H. 1988, ApJ, 325, 26
- Tang et al. (2008) Tang, Y.-W., Kuo, Ch.-Y., Lim, J., Ho, P. T. P., 2008, ApJ, 679, 1094
- Taniguchi et al. (1994) Taniguchi, Y., Murayama, T., Nakai, N., Suzuki, M., and Kameya, O., 1994, AJ, 108, 468
- Thomas et al. (2003) Thomas, D., Maraston, C., Bender, R. 2003, MNRAS, 339, 897
- Ueda et al. (2014) Ueda, J., Iono, D., Yun, M. S., Crocker, A. F., Narayanan, D., et al., 2014, ApJS, 214, Aid. 1
- van den Bergh (2009) van den Bergh, S., 2009, ApJ, 694, L120
- van Driel et al. (1989) van Driel, W., Balkowski, C., van Woerden, H., 1989, A&A, 218, 49
- van Driel & van Woerden (1991) van Driel, W., van Woerden, H., 1991, A&A, 243, 71
- Vauterin & Dejonghe (1997) Vauterin, P., H. Dejonghe, H., 1997, MNRAS, 286, 812
- Veilleux & Osterbrock (1987) Veilleux, S., Osterbrock, D. E., 1987, ApJS, 63, 295
- Weber et al. (2019) Weber, J. A., Pauldrach, A. W. A., Hoffmann, T. L., 2019, A&A, 622, 115
- Welch & Sage (2003) Welch, G. A., Sage, L. J., 2003, ApJ, 584, 260
- Welch, Sage, & Young (2010) Welch, G. A., Sage, L. J., Young, L. M., 2010, ApJ, 725, 100
- Whitmore et al. (1990) Whitmore, B. C., Lucas, R. A., McElroy, D.B., et al., 1990, AJ, 100, 1489
- Wiklind & Henkel (1989) Wiklind, T., Henkel, C., 1989, A&A, 225, 1
- Young et al. (2011) Young, L.M., Bureau, M., Davis, T.A., et al., 2011, MNRAS, 414, 940
- Young et al. (2014) Young, L.M., Scott, N., Serra, P., et al., 2014, MNRAS, 444, 3408
- Zhang et al. (2017) Zhang,K., Yan, R., Bundy, K., et al., 2017, MNRAS, 466, 3217
- Zhang et al. (2019) Zhang, M. L., Frank, B. S., Oosterloo, T., 2019, in preparation.