Exploring the Context of Course Rankings on Online Academic Forums
Abstract
University students routinely use the tools provided by online course ranking forums to share and discuss their satisfaction with the quality of instruction and content in a wide variety of courses. Student perception of the efficacy of pedagogies employed in a course is a reflection of a multitude of decisions by professors, instructional designers and university administrators. This complexity has motivated a large body of research on the utility, reliability and behavioral correlates of course rankings. There is, however, little investigation of the (potential) implicit student bias on these forums towards desirable course outcomes at the institution level. To that end, we examine the connection between course outcomes (student-reported GPA) and the overall ranking of the primary course instructor, as well as rating disparity by nature of course outcomes, based on data from two popular academic rating forums. Our experiments with ranking data about over ten thousand courses taught at Virginia Tech and its 25 SCHEV-approved peer institutions indicate that there is a discernible albeit complex bias towards course outcomes in the professor ratings registered by students.
Index Terms:
academic forums, ranking, bias, course outcomes© 2019 Association for Computing Machinery.
ACM ISBN 978-1-4503-6868-1/19/08
http://dx.doi.org/10.1145/3341161.3342954
I Introduction
Online forums for ranking course instructors, like RateMyProfessors [1] and Koofers [2] are a popular resource among university students for detailing their perception of the quality of course instruction and content. These forums cater to a number of their contributors’ needs, including but not limited to information seeking, gratification, and convenience [3]. They have therefore, inspired considerable research attention over the years [4] [5] [6] [3]. Prior studies have identified several broad themes in the student feedback sampled from these forums, including teacher personality, aptitude and preparation, ease of access to help and feedback from course staff, and perceived practicality of the course rubric [7]. There is however, lesser attention devoted in this literature, to institution-level correlates of student perception. Empirical investigations of the potential sources of student bias in said perception are often divided in their conclusions, because of limitations of sample sizes or meta-variable space [8] [9] [10]. Assessing its reliability at scale can lend insights to instructional designers, department administrators and instructors alike on the limitations of existing pedagogies. It can also potentially extend the utility of university-managed end-of-semester course evaluations, and help improve the usability, relevance, accessibility and trustworthiness [6][11] of its host forums.
| Institution | Courses (R) | Departments (R) | Ratings (R) | Courses (K) | Departments (K) | Ratings (K) |
| ISU | 742 | 141 | 63192 | - | - | - |
| UC-D | 1055 | 115 | 57986 | - | - | - |
| PSU | 962 | 148 | 50786 | - | - | - |
| UFL | 615 | 176 | 39296 | 149 | 85 | 4359 |
| UM | 704 | 139 | 33606 | - | - | - |
| UWISC-M | 646 | 159 | 32467 | - | - | - |
| UMN-TC | 718 | 128 | 31265 | - | - | - |
| SB | 519 | 84 | 26139 | - | - | - |
| PITT | 603 | 112 | 25566 | - | - | - |
| SUNY-B | 418 | 88 | 24849 | - | - | - |
| TAMU | 365 | 99 | 22043 | 154 | 56 | 6003 |
| UIUC | 482 | 99 | 21350 | 126 | 51 | 3569 |
| UCB | 488 | 117 | 20519 | - | - | - |
| USC | 473 | 86 | 18692 | - | - | - |
| UTA | 328 | 79 | 17154 | 57 | 25 | 1910 |
| PURDUE | 433 | 78 | 15831 | - | - | - |
| UMD | 276 | 64 | 11806 | 254 | 64 | 11581 |
| UCB | 277 | 64 | 9454 | - | - | - |
| UMC | 216 | 76 | 8328 | 75 | 34 | 2000 |
| NCSU | 162 | 42 | 7873 | 61 | 29 | 1923 |
| RUTGERS | 204 | 63 | 6790 | - | - | - |
| VT | 99 | 36 | 3254 | 597 | 80 | 42503 |
| UW-S | 76 | 22 | 1718 | - | - | - |
| MSU | - | - | - | 888 | 110 | 67086 |
II Related Work
A number of studies in the educational psychology literature have examined the correlation between course outcomes and student evaluations, albeit for individual students or a course [12] [13] [10]. These studies generally report this correlation to be modest, somewhere between +0.1 and +0.3 [10]. Our preliminary inquiry at the institution level demonstrates that this correlation often matches and sometimes exceeds said figures [14]. The aforementioned work notes that given the learning acquired by students during the course of a given class or academic term, all of this observed correlation can not necessarily be a result of implicit, time-invariant student bias towards course outcomes. The multi-faceted nature of student perception can affect this connection. This complexity is echoed in a comparative study of in-class assessments, and pre- and post-assessment ratings on RateMyProfessors [6]. The study reported how pre-assessment course ratings on instructor clarity were significantly lower than both in-class and post-assessment reviews. However, instructor easiness was reviewed lower in-class relative to online. Our study attempts to initiate a line of large-scale contextual inquiry of these ratings across institutions that can potentially help consolidate these differing interpretations.
III Approach
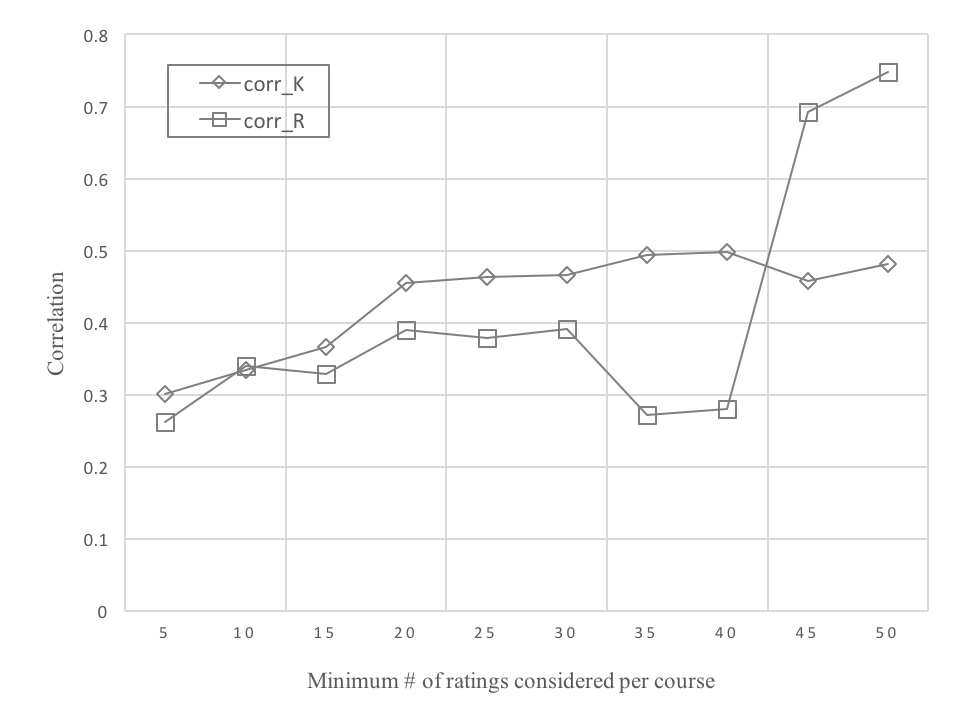
We pursue preliminary evidence of what appears to be a modest to strong relative connection between aggregate course outcomes and student perception of the course instructor. Figure 1 visualizes the correlation between these two for courses taught at Virginia Tech (597 and 99 courses rated on Koofers and RateMyProfessors, respectively). For the Koofers dataset, as we increase the minimum number of ratings per course considered towards the correlation, this correlation increases and achieves a steady average value of about 0.47 beyond 25 ratings per course. We explore this further by examining the disparity of instructor ranking between high, medium and low GPA student groups, as well as regressing student approval against course outcomes and perceived difficulty of various course instruments.
| Institution | ||||||
| ISU | 0.298, 9.5e-17* | 28.1, 1.6e-12† | 3.71 | 3.91 | 3.66 | 3.33 |
| UC-D | 0.206, 1.3e-11* | 21.8, 5.1e-10† | 3.69 | 3.83 | 3.61 | 3.5 |
| PSU | 0.239, 5.2e-14* | 32.2, 2.8e-14† | 3.62 | 3.77 | 3.51 | 3.23 |
| UFL | 0.355, 9.1e-20* | 44.4, 9.3e-19† | 3.75 | 3.95 | 3.52 | 3.12 |
| UFL (K) | 0.32, 6.8e-5* | 3.11, 0.04† | 4.06 | 4.31 | 4.04 | 3.73 |
| UM | 0.15, 5.5e-5* | 12.7, 3.7e-6† | 3.8 | 3.89 | 3.65 | 3.76 |
| UWISC-M | 0.245, 2.4e-10* | 24.3, 6.4e-11† | 3.63 | 3.8 | 3.45 | 3.52 |
| UMN-TC | 0.295, 6.7e-16* | 28.1, 1.72e-12† | 3.62 | 3.8 | 3.46 | 3.19 |
| SB | 0.254, 4e-9* | 17, 6.8e-8† | 3.65 | 3.82 | 3.51 | 3.35 |
| PITT | 0.294, 1.6e-13* | 31.1, 1.3e-13† | 3.72 | 3.9 | 3.54 | 3.51 |
| SUNY-B | 0.362, 2e-14* | 31.3, 2e-13† | 3.61 | 3.88 | 3.43 | 2.98 |
| TAMU | 0.605, 6.9e-38* | 70.6, 1.2e-26† | 3.74 | 4.15 | 3.53 | 2.5 |
| TAMU (K) | 0.492, 8.5e-11* | 13.4, 4.3e-6† | 3.89 | 4.44 | 3.94 | 3.64 |
| UIUC | 0.269, 1.7e-9* | 18.1, 2.4e-8† | 3.63 | 3.76 | 3.49 | 2.94 |
| UIUC (K) | 0.224, 0.01* | 3.51, 0.03† | 3.63 | 3.96 | 3.66 | 3.3 |
| UCB | 0.178, 7e-5* | 11.4, 1.4e-5† | 3.76 | 3.85 | 3.64 | 3.36 |
| USC | 0.366, 1.9e-16* | 25.8, 2.1e-11† | 3.72 | 3.88 | 3.45 | 2.93 |
| UTA | 0.486, 7.2e-21* | 25.8, 3.7e-11† | 3.78 | 4.04 | 3.57 | 3.56 |
| UTA (K) | 0.312, 0.01* | 1.09, 0.34 | 3.75 | 4 | 3.81 | 3.59 |
| PURDUE | 0.268, 1.3e-8* | 9.96, 5.9e-5† | 3.55 | 3.7 | 3.47 | 2.97 |
| UMD | 0.28, 2.1e-6* | 8.7, 2e-4† | 3.61 | 3.81 | 3.48 | 3.52 |
| UMD (K) | 0.354, 6.6e-9* | 5.68, 3e-3† | 3.72 | 412 | 3.72 | 3.42 |
| UCB | 0.363, 4.5e-10* | 14.3, 1.1e-6† | 3.61 | 3.9 | 3.49 | 3.3 |
| UMC | 0.399, 1.1e-9* | 9.9, 7.3e-5† | 3.56 | 3.82 | 3.44 | 3.21 |
| UMC (K) | 0.342, 2e-3* | 4.23, 0.02† | 3.61 | 4.92 | 3.66 | 3.47 |
| NCSU | 0.352, 4.2e-6* | 12.1, 1.2e-5† | 3.67 | 3.89 | 3.53 | 3.55 |
| NCSU (K) | 0.361, 4e-3* | 4.3, 0.01† | 3.71 | 4.43 | 3.75 | 3.53 |
| RUTGERS | 0.184, 8e-3* | 3.3, 0.03† | 3.49 | 3.59 | 3.49 | 3.18 |
| VT | 0.34, 5e-4* | 10.3, 8.1e-5† | 3.63 | 3.99 | 3.46 | 3.35 |
| VT (K) | 0.33, 4e-17* | 15.3, 3.1e-7† | 3.83 | 4.15 | 3.86 | 3.52 |
| UW | 0.102, 0.37 | 0.83, 0.43 | 3.69 | 3.77 | 3.62 | 4 |
| MSU (K) | 0.241, 3.1e-13* | 14.7, 5e-7† | 3.82 | 3.88 | 3.85 | 3.46 |
| ∗stat. significant, | ||||||
| †stat. significant, | ||||||
| coef | s. error | |||
| intercept | 2.6 | 0.318 | 8.3 | 0.00* |
| X1: GPA | 0.5 | 0.085 | 6.0 | 0.00* |
| X2: exams | -0.03 | 0.041 | -0.8 | 0.398 |
| X3: quizzes | -0.08 | 0.037 | -2.3 | 0.02* |
| X4: projects | -0.04 | 0.027 | -1.7 | 0.08 |
| X5: homework | -6e-3 | 0.032 | -0.19 | 0.84 |
| stat. | val. |
|---|---|
| R-squared | 0.193 |
| Adj R-squared | 0.182 |
| F-statistic | 17.8 |
| Prob (F-statistic) | 8e-16* |
| Log-likelihood | -244.4 |
| AIC | 500.8 |
| BIC | 524.4 |
IV Evaluation
IV-A Datasets
We leverage a set of peer institutions for Virginia Tech, identified by State Council of Higher Education for Virginia (SCHEV) [15], based on criteria such as enrollments, research funding, degrees awarded and the Carnegie Classification [16]. We scraped course metadata from RateMyProfessors [1] and Koofers [2], two popular forums for sharing course content and instructor reviews. For a university, we consider all courses with a minimum of 10 ratings. A course can have a multitude of instructors and offerings. Instructor ratings on Koofers and RateMyProfessors both, are on a 0 to 5 scale while GPA reports are on a 4.0 scale. We define the minimum acceptable use of the forum (at the institution level) as an excess of 1000 total ratings, with the course count at least 1.5X - 2X that of the department count.
IV-B Methods
We significance-test the disparity in professor ratings by GPA groups using one-way ANOVA (F-test, table II). We also use the Python package statsmodels.OLS towards regression analysis of instructor ratings as a function of student GPA, as well as their self-reported ease of course instruments (exams, quizzes, projects and homeworks).
IV-C Results
Table II lists the correlations between average professor rating and student GPA for all institutions considered, as well as average ratings for each GPA group. The institutions in the RateMyProfessors dataset report an average correlation of 0.30, while those in the Koofers dataset report an average of 0.27. The group disparities by course outcome are modest to strong across institutions, with an average F-statistic of 20.6 and 5.86 for the RateMyProfessors and Koofers datasets, respectively. TAMU, for instance, reports the strongest correlation (0.605) and effect sizes (F-statistic: 70.6). However, the modest average correlation hints at department-level and course-level distinctions, that partially neutralize the differences between course outcome groups, or in rare cases like UW, eliminate the effect altogether. Consider UMD, for instance, where a relatively modest effect size (F-statistic: 8.7) coincides with a larger average instructor ranking on behalf of the low-GPA group relative to the medium GPA group. In general, however, we find that a modest connection between course outcomes and student evaluations exists across institutions with remarkable consistency. Table III and table IV report the coefficients, errors and significance tests for regression analysis with average instructor rating as a function of average student-reported GPA X1, average perceived difficulty of exams, quizzes, projects and homework (X2 through X5). Course outcomes outweigh the perceived ease of course evaluations in their aggregate effect on instructor ratings ( for X1 and X3, respectively). Difficulty of quizzes appears modestly relevant in ascertaining the overall student satisfaction with the course, with higher difficulty linked to lower student approval (t-statistic is negative).
V Discussion
We intend to expand our analysis by considering the time order of the instructor ratings in our dataset. While the magnitude of the observed correlation between course outcomes and student rankings is nearly consistent across institutions (with minimum aggregate forum use) we tested for, it is harder to argue about the directionality of this correlation without said data. We are also working to expand our contextual variable space to include university mandate (teaching vs. research, public vs. private), course modality (STEM/non-STEM, undergraduate/graduate, in-class/online), assessments (group projects, pop quizzes, class participation), instructor attributes (accessible outside the class, competent, tendency to provide feedback), technology use (LMS and third-party apps for course management, testing and assessment), logistics (instructional design training, number of TAs, etc.), and forum features (content management and editorial control). Another important step in realizing this contextual inquiry is designing metrics that summarize the observed disparity between effects of course rubric, content quality, interaction fidelity of host forums as well as course outcomes on the overall instructor ranking. These metrics are a crucial first step in determining the uncertainty and/or bias implicit in instructor ratings across departments and institutions.
VI Conclusion
Our study examines the strength of the connection between course outcomes and aggregate instructor rank on two popular academic forums. We find that for several academic institutions, student ratings of course instructors incorporate disparities linked to course outcomes as opposed to the student perception of the relative ease of course materials, content and evaluations. We intend to generalize this analysis into a robust approach of isolating and correcting for bias on academic forums.
References
- [1] (2019) Rate my professors - review teachers and professors, school reviews, college campus ratings. [Online]. Available: http://ratemyprofessors.com/
- [2] G. LoPresti, P. Gartlan, D. Donahoe, and M. Le. (2019) Koofers - professor ratings, practice exams and flash cards. [Online]. Available: http://koofers.com/
- [3] J. Kindred and S. N. Mohammed, ““he will crush you like an academic ninja!”: Exploring teacher ratings on ratemyprofessors. com,” Journal of Computer-Mediated Communication, vol. 10, no. 3, p. JCMC10314, 2005.
- [4] Y. Chang and S. W. Park, “Exploring students’ perspectives of college stem: An analysis of course rating websites.” International Journal of Teaching and Learning in Higher Education, vol. 26, no. 1, pp. 90–101, 2014.
- [5] M. J. Brown, M. Baillie, and S. Fraser, “Rating ratemyprofessors. com: A comparison of online and official student evaluations of teaching,” College Teaching, vol. 57, no. 2, pp. 89–92, 2009.
- [6] A. M. Legg and J. H. Wilson, “Ratemyprofessors. com offers biased evaluations,” Assessment & Evaluation in Higher Education, vol. 37, no. 1, pp. 89–97, 2012.
- [7] K. B. Hartman and J. B. Hunt, “What ratemyprofessors. com reveals about how and why students evaluate their professors: A glimpse into the student mind-set,” Marketing Education Review, vol. 23, no. 2, pp. 151–162, 2013.
- [8] H. W. Marsh, “Students’ evaluations of university teaching: Dimensionality, reliability, validity, potential baises, and utility.” Journal of educational psychology, vol. 76, no. 5, p. 707, 1984.
- [9] J. A. Centra, “Will teachers receive higher student evaluations by giving higher grades and less course work?” Research in Higher Education, vol. 44, no. 5, pp. 495–518, 2003.
- [10] K. A. Feldman, “Identifying exemplary teachers and teaching: Evidence from student ratings,” in The scholarship of teaching and learning in higher education: An evidence-based perspective. Springer, 2007, pp. 93–143.
- [11] T. Hassan and D. S. McCrickard, “Trust and trustworthiness in social recommender systems,” Companion Proceedings of the 2019 World Wide Web Conference (WWW ‘19 Companion), May 2019.
- [12] S. A. Stumpf and R. D. Freedman, “Expected grade covariation with student ratings of instruction: Individual versus class effects.” Journal of Educational Psychology, vol. 71, no. 3, p. 293, 1979.
- [13] K. A. Feldman, “The association between student ratings of specific instructional dimensions and student achievement: Refining and extending the synthesis of data from multisection validity studies,” Research in Higher education, vol. 30, no. 6, pp. 583–645, 1989.
- [14] T. Hassan, “On bias in social reviews of university courses,” in Companion Publication of the 10th ACM Conference on Web Science. ACM, 2019, pp. 11–14.
- [15] (2019) Peer Institutions and Comparisons - Virginia Tech. [Online]. Available: https://www.ir.vt.edu/data/peers.html
- [16] L. S. Shulman, “The carnegie classification of institutions of higher education,” Menlo Park: Carnegie Publication, 2001.
- [17] B. Schölkopf, A. Smola, and K.-R. Müller, “Kernel principal component analysis,” in International conference on artificial neural networks. Springer, 1997, pp. 583–588.
- [18] M. Meila, “An accelerated chow and liu algorithm: fitting tree distributions to high dimensional sparse data,” 1999.