Improving the Signal-to-noise Ratio for Heat-Assisted Magnetic Recording by Optimizing a High/Low Tc bilayer structure
Abstract
We optimize the recording medium for heat-assisted magnetic recording by using a high/low bilayer structure to reduce AC and DC noise. Compared to a former work, small Gilbert damping is considered for the FePt like hard magnetic material. Atomistic simulations are performed for a cylindrical recording grain with diameter nm and height nm. Different soft magnetic material compositions are tested and the amount of hard and soft magnetic material is optimized. The results show that for a soft magnetic material with and J/link a composition with hard and soft magnetic material leads to the best results. Additionally, we analyse how much the areal density can be improved by using the optimized bilayer structure compared to the pure hard magnetic recording material. It turns out that the optimized bilayer design allows an areal density that is 1 Tb/in2 higher than that of the pure hard magnetic material while obtaining the same SNR.
I Introduction
Heat-assisted magnetic recording (HAMR) [1; 2; 3; 4; 5; 6; 7] is a promising recording technology to further increase the areal storage densities (ADs) of hard disk drives. Conventional state-of-the-art recording technologies are not able to overcome the so-called recording trilemma [8]: Higher ADs require smaller grains. These grains need to have high uniaxial anisotropy to be thermally stable. However today’s write heads are not able to produce fields that are strong enough to switch these high anisotropy grains. In the HAMR process a heat pulse is included in the recording process to locally heat the recording medium. This leads to a drop of the coercivity, making the high anisotropy recording medium writeable. The medium is then quickly cooled and the information reliably stored.
To reach high linear densities it is necessary to reduce AC and DC noise in recording media [9]. AC noise determines the distance between neighboring bits in bit-patterned [10; 11; 12] media or the transition between grains in granular media. DC noise restricts the maximum switching probability of grains away from the transition. It has been shown, that pure hard magnetic grains do not switch reliably [13] if bit-patterned media are considered whereas non-optimized exchange coupled bilayer structures [14; 15; 16; 17; 18; 19] of hard and soft magnetic material experience high AC noise [20]. A work to reduce noise in recording media by optimizing a high/low bilayer structure (see Ref. [21]) showed that an optimial bilayer structure consists of 80 hard magnetic and 20 soft magnetic material. However, in the former work the Gilbert damping was assumed to be which is hard to achieve in a FePt like hard magnetic material in reality. In realistic hard magnetic recording materials, the damping constant is , according to the Advanced Storage Technology Consortium (ASTC) [22].
Since it has been shown that the damping constant has a strong influence on the maximum switching probability and the down-track jitter, we follow the optimization approach and optimize a bilayer structure for the ASTC parameters. After the optimization, we study how the optimized material differs from that with .
Additionally, we investigate how much the areal storage density (AD) can be improved when using the optimized recording material instead of the pure hard magnetic one. This is done with the help of the signal-to-noise ratio (SNR), which gives the power of the signal over the power of the noise and is a good indicator for the quality of written bits.
The structure of this work is as follows:
In Section II, the HAMR model and the material parameters are presented. In Section III, the results are shown and they are discussed in Section IV.
II HAMR model
The optimization simulations are performed with the atomistic simulation program VAMPIRE [23] which solves the stochastic Landau-Lifshitz-Gilbert (LLG) equation. In the simulations, a cylindrical recording grain with a diameter nm and a height nm is used. It can be considered as one recording bit in bit-patterned media. A simple cubic crystal structure is used and only nearest neighbor interactions are considered. The effective lattice parameter and the exchange interaxtion are adjusted in order to lead to the experimentally obtained saturation magnetization and Curie temperature. [24; 25]. The write head is assumed to move with a velocity of m/s. A continuous laser pulse is assumed with the Gaussian temperature profile
| (1) | |||
| (2) |
with
| (3) |
The full width at half maximum (FWHM) is assumed to be 60 nm. Both, the down-track position and the off-track position are variable in the simulations.
The initial and final temperature is K. The applied field is modeled as a trapezoidal field with a write field duration of 0.57 ns and a field rise and decay time of 0.1 ns. The field is applied at an angle of 22 deg with respect to the normal. The field strength is assumed to be +0.8 T and -0.8 T in -direction. Initially, the magnetization of each grain points in -direction. The trapezoidal field tries to switch the magnetization of the grain from -direction to -direction. At the end of every simulation, it is evaluated if the bit has switched or not.
II.1 Material parameters
The material parameters for the hard magnetic material can be seen in Table 1. For the soft magnetic material, the atomistic spin moment is assumed to be which corresponds to a saturation polarization T. The uniaxial anisotropy constant in the soft magnetic layer is initially set to 0 but later varied. The Gilbert damping and the exchange interaction within the soft magnetic material are varied. Experimentally, it is possible to increase the damping constant by doping the soft magnetic material with transition metals like Gd or Os [26; 27; 28; 29; 30]. Thus, also enhanced damping constants larger than are considered in the simulations.
| Curie temp. [K] | Damping | Uniaxial anisotropy. [J/link] | [J/link] | [] |
| 693.5 | 0.02 | 1.6 |
III Results
III.1 Hard magentic grain
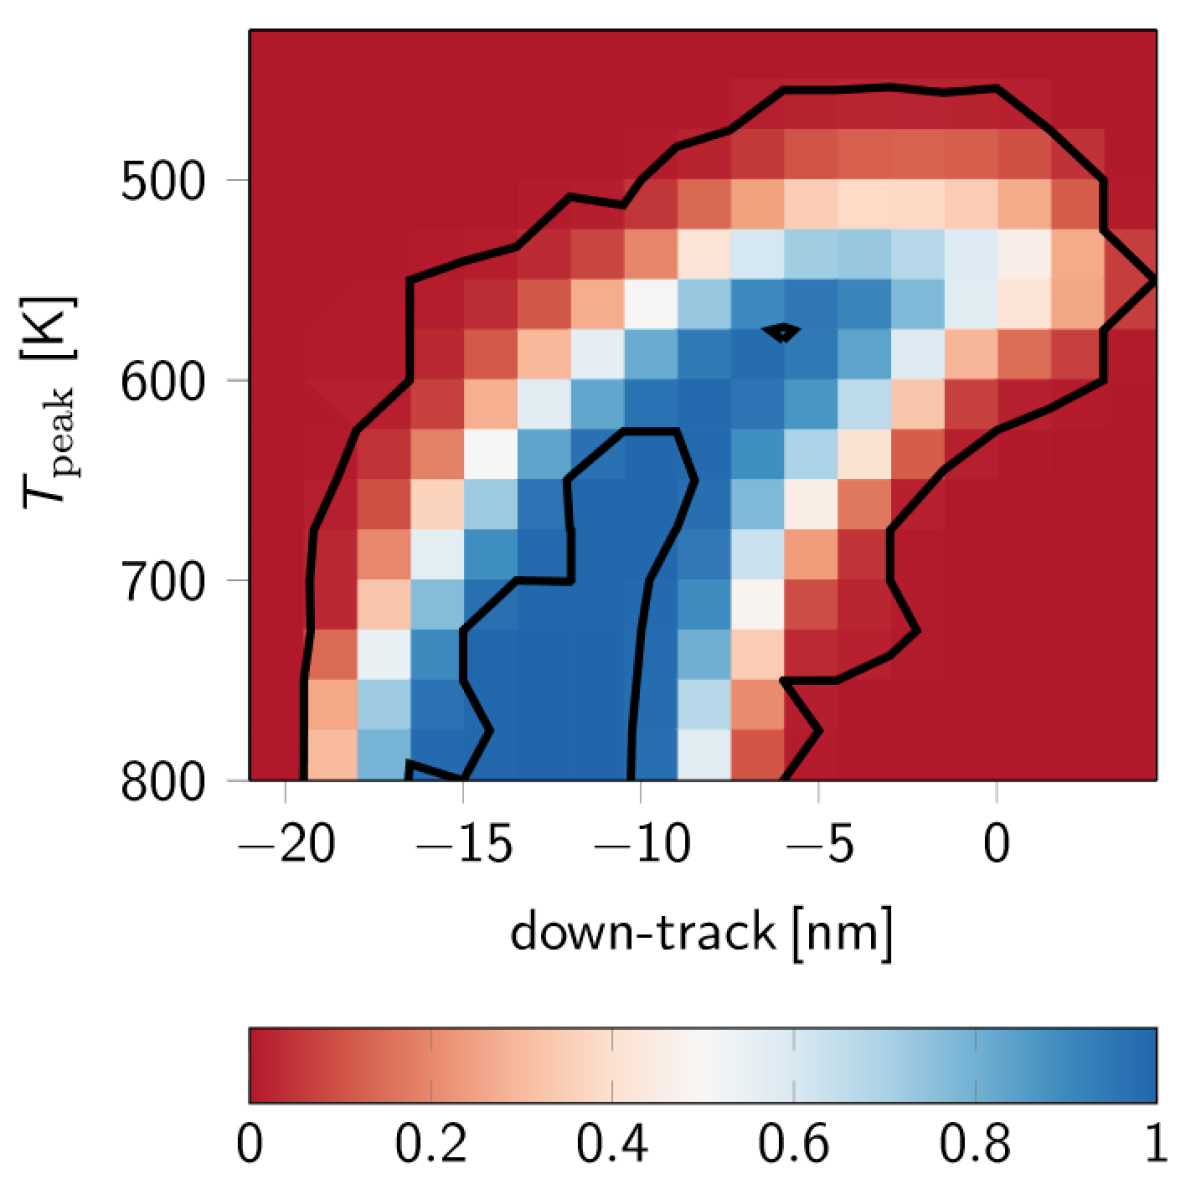
First, a switching probability phase diagram for the pure hard magnetic material is computed where the switching probability is depending on the down-track position and the off-track position . With eq. 2 each off-track position can be transformed into an unique peak temperature , if the write temperature is fixed, and vice versa. Thus, the switching probability in Figure 1 is shown as a function of the down-track position and the peak temperature that corresponds to . The resolution of the phase diagram in down-track direction is nm and that in temperature direction is K. In each phase point, 128 trajectories are simulated with a simulation length of ns. Thus, the phase diagram contains more than 30.000 switching trajectories. From the phase diagram it can be seen that the pure hard magnetic grain shows only two small areas with switching probability larger than . This threshold is used, since 128 simulations per phase point are performed and a switching probability of 100 corresponds to a number of successfully switched trajectories larger than .
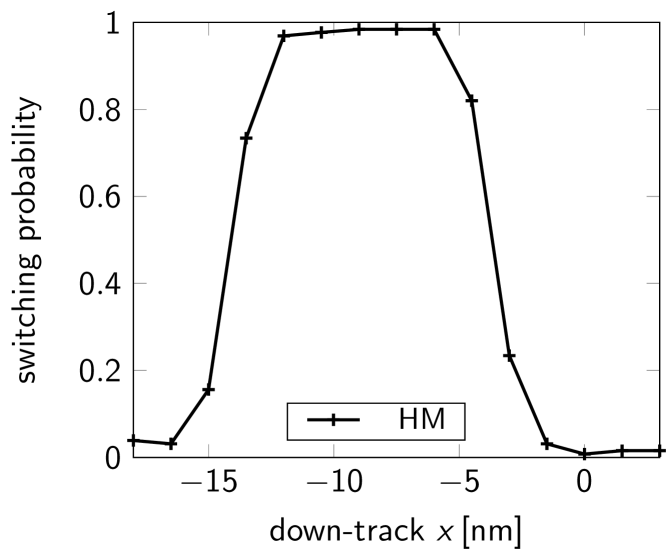
To determine the down-track jitter , a down-track switching probability curve for nm nm at a fixed temperature K is determined for pure hard magnetic material (see Figure 2). The switching probability curve is fitted with a Gaussian cumulative function
| (4) |
with
| (5) |
where the standard deviation , the mean value and the mean maximum switching probability are the fitting parameters. The standard deviation determines the steepness of the transition function and is a measure for the transition jitter. In the further course it will be called The fitting parameter is a measure for the average switching probability for sufficiently high temperatures. The resulting fitting parameters of the hard magnetic material can be seen in Table 5. Note, that the calculated jitter values only consider the down-track contribution of the write jitter. The so-called parameter is given by
| (6) |
where is a grain-size-dependent jitter contribution [31]. The write jitter can then be calculated by
| (7) |
where is the reader width and is the grain diameter, i.e. the sum of the particle size and the nonmagnetic boundary [32; 33].
III.2 Media Optimization
To find the best soft magnetic material composition, down-track switching probability curves similar to Figure 2 are computed for 50/50 bilayer structures with different damping constants and different exchange interactions . The range in which the parameters are varied can be seen in Table 2. Note, that is computed at different peak temperatures for the different exchange interactions, since there holds
| (8) |
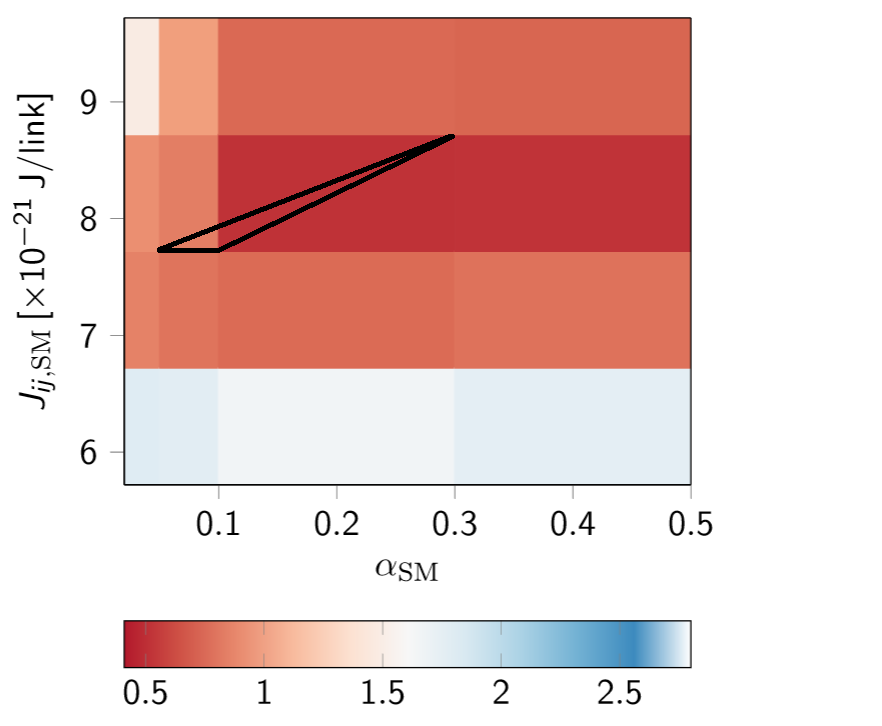
where is the Boltzmann constant, z is the number of nearest neighbors and is a correction factor from the mean-field expression which is approximately 0.86 [23]. The temperature at which is calculated is chosen to be K. The down-track switching probability curves are then fitted with eq. 4. The down-track jitter parameters as a function of the damping constant and the exchange interaction can be see in Figure 3. The maximum switching probability is 1 for .
| Parameter | min. value | max.value |
|---|---|---|
| 0.02 | 0.5 | |
| [J/link] | ||
| [J/link] | 0 |
| [J/link] | [nm] | |
|---|---|---|
| 0.41 | 1.0 | |
| 0.919 | 1.0 | |
| 1.04 | 1.0 | |
| 0.898 | 1.0 | |
| 1.01 | 1.0 |
| Damping | Uniaxial anisotropy. [J/link] | [J/link] | [] |
|---|---|---|---|
| 0.1 | 1.6 |
| HM/SM | [nm] | |
|---|---|---|
| HM | 0.974 | 0.95 |
| 90/10 | 1.06 | 0.969 |
| 80/20 | 0.813 | 0.998 |
| 70/30 | 0.6 | 0.988 |
| 60/40 | 0.8 | 0.999 |
| 50/50 | 0.41 | 1.0 |
From the simulations it can be seen that a Gilbert damping together with J/link leads to the best results with the smallest down-track jitter nm and a switching proability .
The last soft magnetic parameter that is varied, is the uniaxial anisotropy . It is known that the smallest coercive field in an exchange spring medium can be achieved if [34; 35]. Here
| (9) |
are the macroscopic anisotropy constants in J/m3 with the unit cell size nm and the number of atoms per unit cell. is varied between 0 and J/link. The damping constant is . The resulting fitting parameters are summarized in Table 3. It can be seen that the switching probability is one for all varied . However, the down-track jitter increases for higher . Since for J/link the jitter is the smallest, this value is chosen for the optimal material composition.
In conclusion, the material parameters of the optimized soft magnetic material composition can be seen in Table 4.
Next, simulations for different ratios of hard and soft magnetic material are performed. Down-track switching probability curves are computed for different ratios at K and the down-track jitter and the mean maximum switching probability are determined. The results are listed in Table 5.
It can be seen that a structure with hard magnetic and soft magnetic materials leads to the smallest jitter and the highest switching probability. This result differs from the optimized material composition in Ref. [21], where the optimal composition consists of hard magnetic and soft magnetic materials.
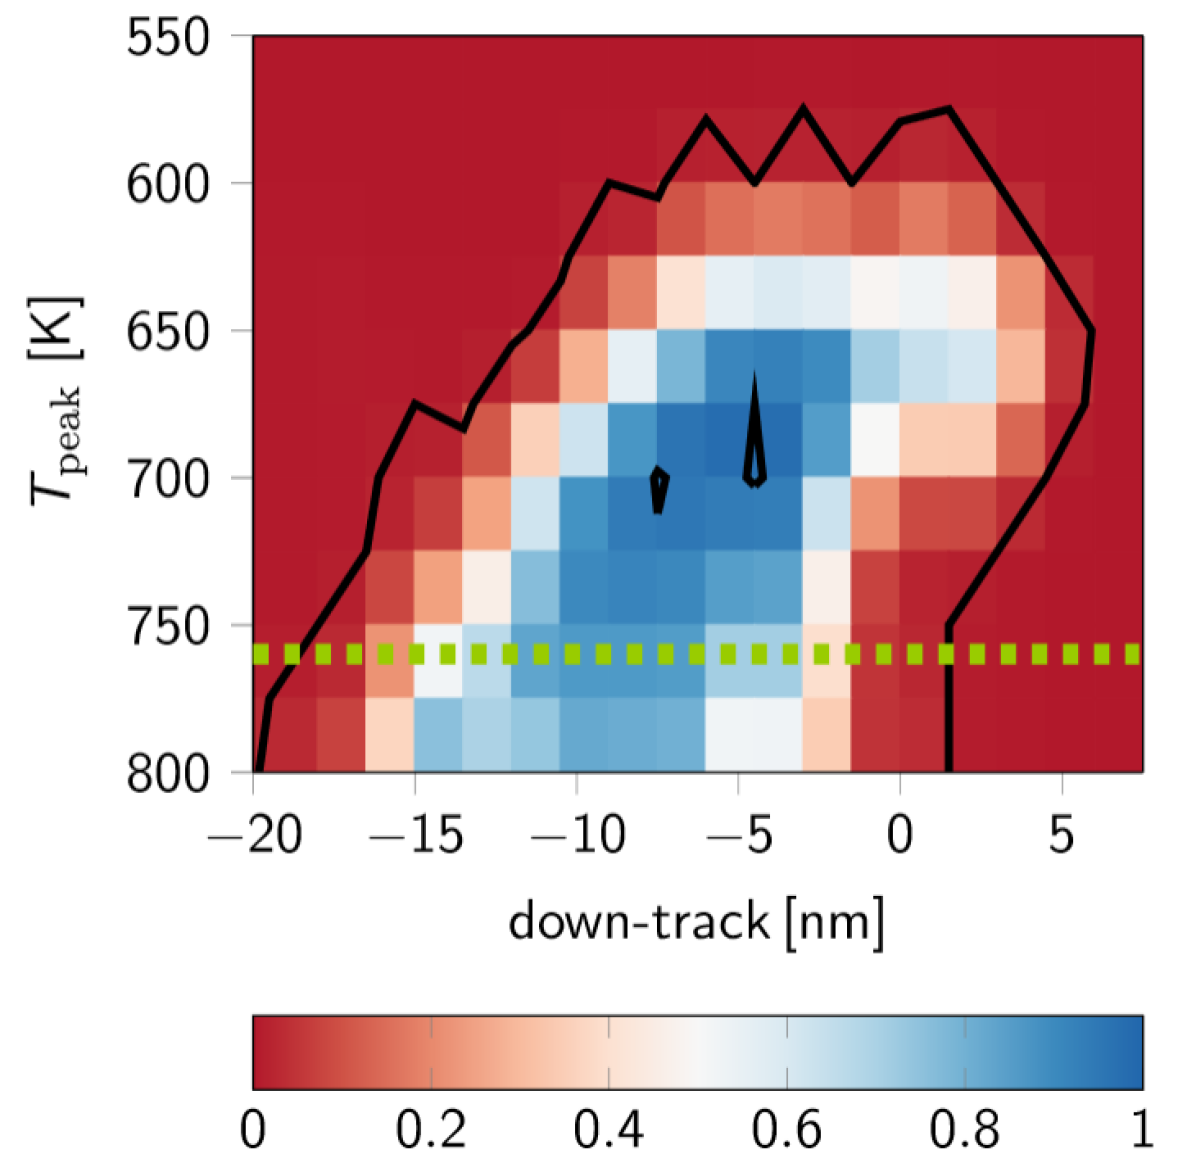
In Figure 4, a switching probability phase diagram of the optimized bilayer structure with hard and soft magnetic material can be seen.
It is visible that the switching probability of the structure is larger than for a bigger area of down-track positions and peak temperatures. This shows the reduction of DC noise in the optimized structure.
III.3 Areal Density
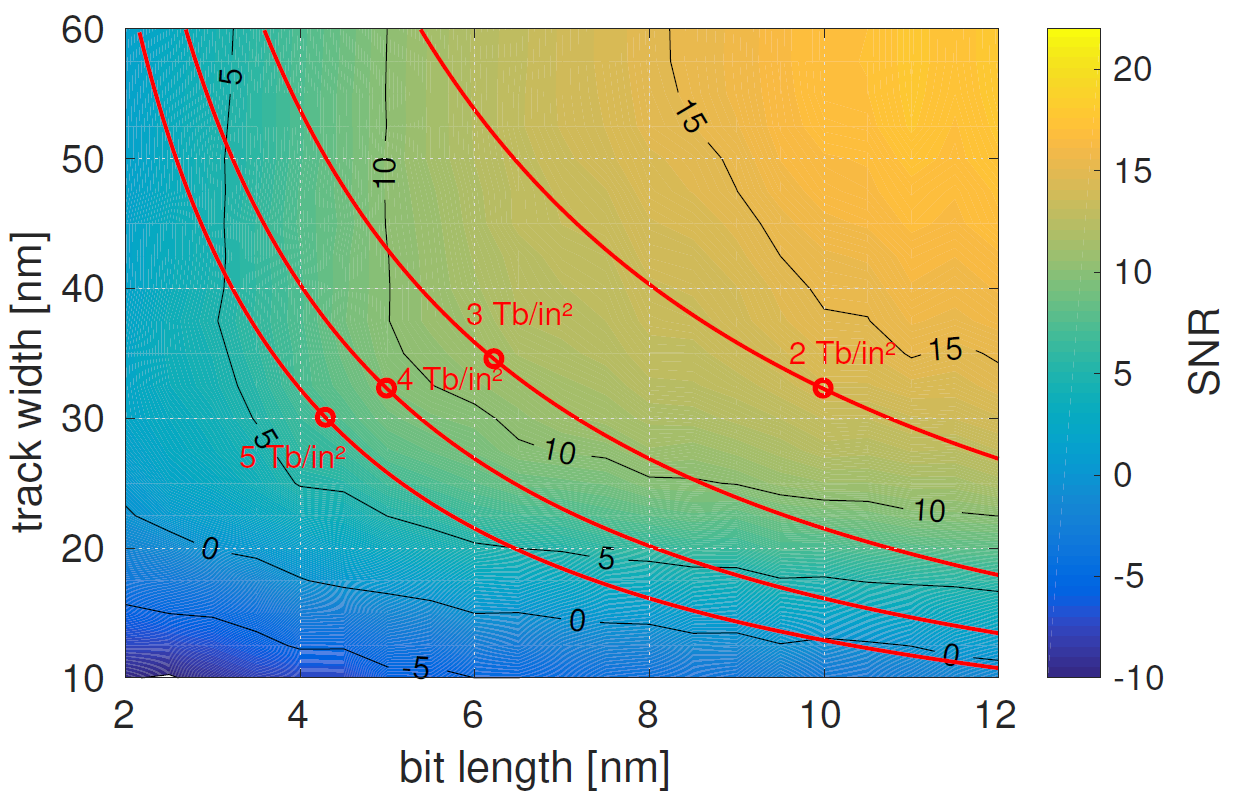
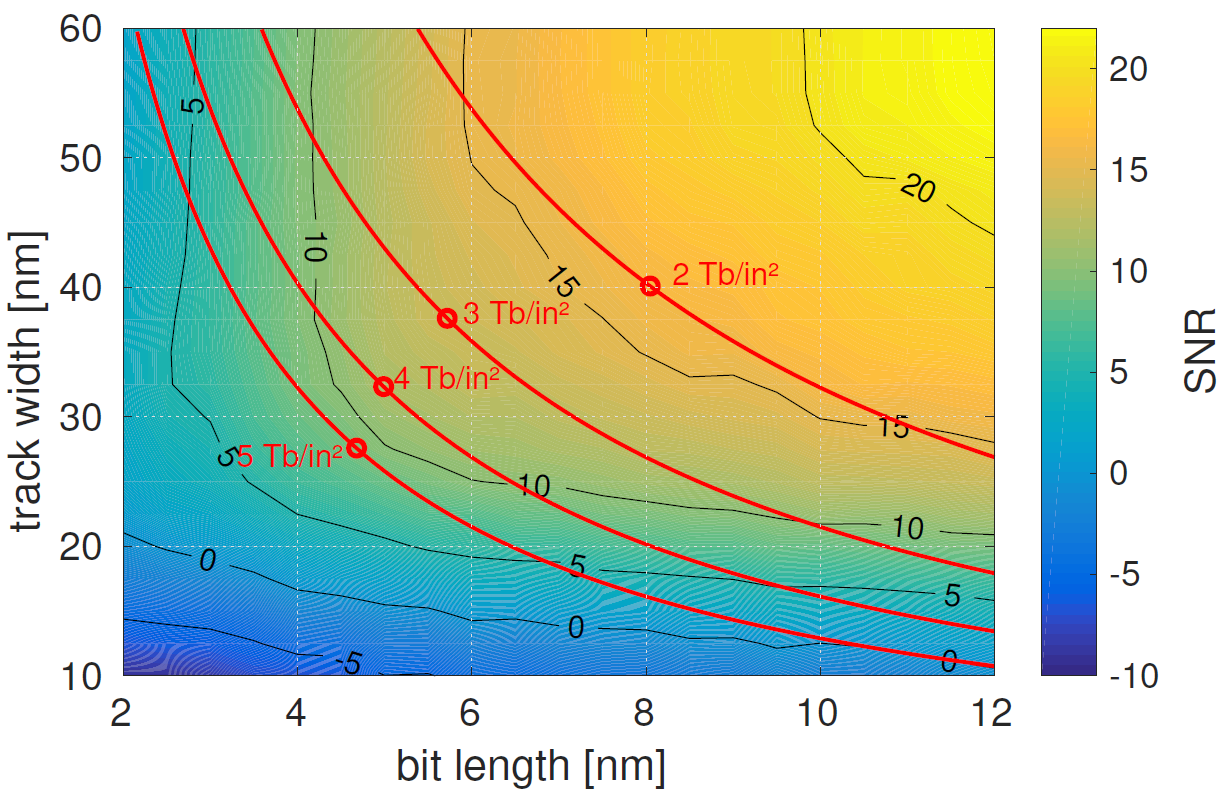
To analyse the possible increase of areal density by using the optimized bilayer structure instead of the pure hard magnetic recording medium, the signal-to-noise ratio is calculated. With the help of an analytical model of a phase diagram developed by Slanovc et al [33] it is possible to calculate a switching probability phase diagram from eight input parameters. The input parameters are , the off-track jitter the transition curvature, the bit length, the half maximum temperature and the position of the phase diagram in direction and the position of the phase diagram in down-track direction. The and values are those resulting from the simulations for pure hard magnetic material and the optimized bilayer structure. All other model input parameters are obtained by a least square fit from a switching probability phase diagram computed with a coarse-grained LLB model [36]. The phase diagram is mapped onto a granular recording medium where the switching probability of the grain corresponds to its position. The writing process is repeated for 50 different randomly initialized granular media. The SNR is then computed from the read-back process with the help of a SNR calculator provided by SEAGATE [37].
The SNR is analysed for areal densities of 2 to 5 Tb/in2. For the bitsize () at a certain areal density, there are different track width and bit length combinations () that yield
| (10) |
To compute the SNR for a certain combination, the reader was scaled in both the down-track and the off-track direction according to the bit length and the track width, respectively. The reader resolution in down-track direction is scaled by
| (11) |
where is the bit length, nm is the initial reader resolution and nm denotes the mean initial bit length according to ASTC. In off-track direction, the reader width is scaled to the respective track width . The initial track width is nm. In Figure 5(a) and (b) the SNR is shown as a function of the bit length and the track width for pure hard magnetic material and the optimized bilayer structure, respectively. Additionally, the phase plots include the SNR curves for combinations that yield areal densities from 2 to 5 Tb/in2. From the phase diagram it is visible that higher SNR values can be achieved for the optimized structures than for the pure hard magnetic material in the same bit length track width range. For example, the SNR for an areal density of 2 Tb/in2 for the bilayer structure is larger than 15 dB whereas it is between 10 dB and 15 dB for pure hard magnetic material. For each AD there is a combination for which the SNR is maximal and which is marked by a dot in the phase plot. In Figure 6 the maximum SNR over the areal density is displayed for both structures. The results show that the SNR that can be achieved with the optimized structure is around 2 db higher than that of the hard magnetic material, if the same areal density is assumed. To get the same SNR, the optimized design allows for an areal density that is 1 Tb/in2 higher than for the hard magnetic one. Summarizing, the bit length track width combinations at which the maximum SNR is achieved are given in Table 6.
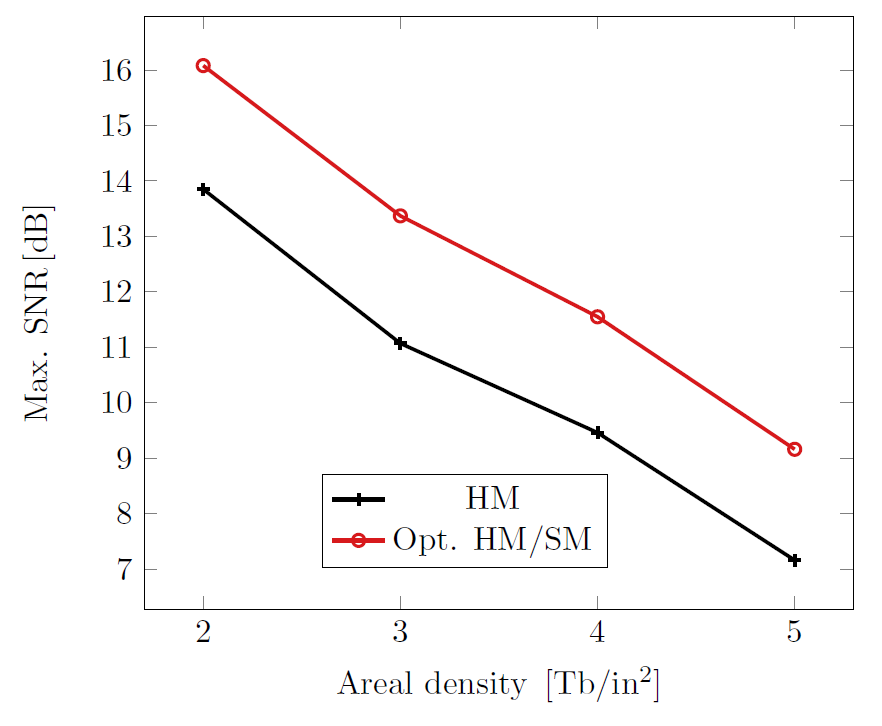
| AD [Tb/in2] | Max. SNR [dB] (HM) | [nm] (HM) | [nm] (HM) | Max. SNR [dB] (HM/SM) | [nm] (HM/SM) | [nm] (HM/SM) |
|---|---|---|---|---|---|---|
| 2 | 13.85 | 10.0 | 32.26 | 16.08 | 8.06 | 40.02 |
| 3 | 11.07 | 6.23 | 34.52 | 13.37 | 5.37 | 37.53 |
| 4 | 9.46 | 5.0 | 32.26 | 11.55 | 5.0 | 32.26 |
| 5 | 7.16 | 4.3 | 30.01 | 9.16 | 4.69 | 27.51 |
IV Conclusion
To conclude, we optimized a recording medium with high/low grains for heat-assisted magnetic recording with a low Gilbert damping in the hard magnetic part . The simulations for a cylindrical recording grain with nm and nm were performed with the atomistic simulation program VAMPIRE. The damping constant of the soft magnetic material was assumed to be enhanced by doping the soft magnetic material with transition metals. The simulations showed that larger damping constants lead to smaller jitter and higher switching probabilities. A damping constant , in combination with an exchange interaction J/link and an uniaxial anisotropy constant J/link, led to the best results in terms of small down-track jitter and high switching probability in a wide range of down-track and off-track positions. Interestingly, the soft magnetic composition is almost the same as for the structure with obtained in a previous work [21].
In further simulations the amount of hard and soft magnetic material was varied. Surprisingly, the results showed that a higher amount of soft magnetic material leads to smaller down-track jitter. This is not as expected since for an increase of the soft magnetic material led to larger AC noise [21]. However, it can be easily explained why a higher amount of soft magnetic material leads to better jitter results. Studying the influence of the damping constant on the down-track jitter shows that an increase of the damping constant from to reduces the down-track jitter by almost . Additionally,the maximum switching probability increases to .
Since it can be seen that higher damping leads to smaller jitter and higher maximum switching probability, it is reasonable that a higher amount of soft magnetic material with leads to a better recording performance. In the former work the improved performance due to higher damping was not an issue since the damping constant was 0.1 in both layers. This explains the different ratios of hard and soft magnetic material.
Furthermore, we analyzed the increase of the areal density can be improved if the optimized bilayer structure is used instead of pure hard magnetic recording material. This was done by analyzing the signal-to-noise ratio (SNR). The results showed that the areal density of the optimized bilayer structure could be increased by 1 Tb/in2 to achieve the same SNR as for the pure hard magnetic structure. In other words, that means that at a certain areal density, the SNR was increased by 2 dB by using the optimized structure.
Concluding, the optimized bilayer structure is a promising design to increase the areal storage density by just modifying the recording material.
V ACKNOWLEDGEMENTS
The authors would like to thank the Vienna Science and Technology Fund (WWTF) under grant No. MA14-044, the Advanced Storage Technology Consortium (ASTC), and the Austrian Science Fund (FWF) under grant No. I2214-N20 for financial support. The computational results presented have been achieved using the Vienna Scientific Cluster (VSC).
References
- [1] Hiroshi Kobayashi, Motoharu Tanaka, Hajime Machida, Takashi Yano, and Uee Myong Hwang. Thermomagnetic recording. Google Patents, August 1984.
- [2] C. Mee and G. Fan. A proposed beam-addressable memory. IEEE Transactions on Magnetics, 3(1):72–76, 1967.
- [3] Robert E. Rottmayer, Sharat Batra, Dorothea Buechel, William A. Challener, Julius Hohlfeld, Yukiko Kubota, Lei Li, Bin Lu, Christophe Mihalcea, Keith Mountfield, and others. Heat-assisted magnetic recording. IEEE Transactions on Magnetics, 42(10):2417–2421, 2006.
- [4] Mark H. Kryder, Edward C. Gage, Terry W. McDaniel, William A. Challener, Robert E. Rottmayer, Ganping Ju, Yiao-Tee Hsia, and M. Fatih Erden. Heat assisted magnetic recording. Proceedings of the IEEE, 96(11):1810–1835, 2008.
- [5] Tim Rausch, Ed Gage, and John Dykes. Heat Assisted Magnetic Recording. In Jean-Yves Bigot, Wolfgang Hübner, Theo Rasing, and Roy Chantrell, editors, Ultrafast Magnetism I, Springer Proceedings in Physics, pages 200–202. Springer International Publishing, 2015.
- [6] G. W. Lewicki and others. Thermomagnetic recording and magneto-optic playback system. Google Patents, December 1971.
- [7] L. Burns Jr Leslie and others. Magnetic recording system. Google Patents, December 1959.
- [8] R. F. L. Evans, Roy W. Chantrell, Ulrich Nowak, Andreas Lyberatos, and H.-J. Richter. Thermally induced error: Density limit for magnetic data storage. Applied Physics Letters, 100(10):102402, 2012.
- [9] Christoph Vogler, Claas Abert, Florian Bruckner, Dieter Suess, and Dirk Praetorius. Basic noise mechanisms of heat-assisted-magnetic recording. Journal of Applied Physics, 120(15):153901, 2016.
- [10] H. J. Richter, A. Y. Dobin, R. T. Lynch, D. Weller, R. M. Brockie, O. Heinonen, K. Z. Gao, J. Xue, R. J. M. v. d. Veerdonk, P. Asselin, and M. F. Erden. Recording potential of bit-patterned media. Applied Physics Letters, 88(22):222512, May 2006.
- [11] H. J. Richter, A. Y. Dobin, O. Heinonen, K. Z. Gao, R. J. M. v d Veerdonk, R. T. Lynch, J. Xue, D. Weller, P. Asselin, M. F. Erden, and R. M. Brockie. Recording on Bit-Patterned Media at Densities of 1 Tb/in2 and Beyond. IEEE Transactions on Magnetics, 42(10):2255–2260, October 2006.
- [12] Bing K. Yen, Jim Hennessey, Eric Freeman, Kim Yang Lee, David S. Kuo, and Mark Ostrowski. Bit patterned media, August 2013.
- [13] Dieter Suess, Christoph Vogler, Claas Abert, Florian Bruckner, Roman Windl, Leoni Breth, and J. Fidler. Fundamental limits in heat-assisted magnetic recording and methods to overcome it with exchange spring structures. Journal of Applied Physics, 117(16):163913, 2015.
- [14] Dieter Suess. Micromagnetics of exchange spring media: Optimization and limits. Journal of magnetism and magnetic materials, 308(2):183–197, 2007.
- [15] Dieter Suess, Thomas Schrefl, S. Fähler, Markus Kirschner, Gino Hrkac, Florian Dorfbauer, and Josef Fidler. Exchange spring media for perpendicular recording. Applied Physics Letters, 87(1):012504, 2005.
- [16] R. H. Victora and X. Shen. Exchange coupled composite media for perpendicular magnetic recording. IEEE Transactions on Magnetics, 41(10):2828–2833, October 2005.
- [17] Jian-Ping Wang, Weikang Shen, and Jianmin Bai. Exchange coupled composite media for perpendicular magnetic recording. IEEE transactions on magnetics, 41(10):3181–3186, 2005.
- [18] Kevin Robert Coffey, Jan-Ulrich Thiele, and Dieter Klaus Weller. ‘Thermal spring’magnetic recording media for writing using magnetic and thermal gradients. Google Patents, April 2005.
- [19] Dieter Suess and Thomas Schrefl. Breaking the thermally induced write error in heat assisted recording by using low and high Tc materials. Applied Physics Letters, 102(16):162405, 2013.
- [20] Christoph Vogler, Claas Abert, Florian Bruckner, Dieter Suess, and Dirk Praetorius. Areal density optimizations for heat-assisted magnetic recording of high-density media. Journal of Applied Physics, 119(22):223903, 2016.
- [21] O. Muthsam, C. Vogler, and D. Suess. Noise reduction in heat-assisted magnetic recording of bit-patterned media by optimizing a high/low Tc bilayer structure. Journal of Applied Physics, 122(21):213903, 2017.
- [22] ASTC | IDEMA. http://idema.org/?cat=10.
- [23] Richard FL Evans, Weijia J. Fan, Phanwadee Chureemart, Thomas A. Ostler, Matthew OA Ellis, and Roy W. Chantrell. Atomistic spin model simulations of magnetic nanomaterials. Journal of Physics: Condensed Matter, 26(10):103202, 2014.
- [24] Oleg N Mryasov, Ulrich Nowak, K Yu Guslienko, and Roy W Chantrell. Temperature-dependent magnetic properties of fept: Effective spin hamiltonian model. EPL (Europhysics Letters), 69(5):805, 2005.
- [25] O Hovorka, S Devos, Q Coopman, WJ Fan, CJ Aas, RFL Evans, Xi Chen, G Ju, and RW Chantrell. The curie temperature distribution of fept granular magnetic recording media. Applied Physics Letters, 101(5):052406, 2012.
- [26] W. Zhang, S. Jiang, P. K. J. Wong, L. Sun, Y. K. Wang, K. Wang, M. P. de Jong, W. G. van der Wiel, G. van der Laan, and Y. Zhai. Engineering Gilbert damping by dilute Gd doping in soft magnetic Fe thin films. Journal of Applied Physics, 115(17):17A308, May 2014.
- [27] S. Ingvarsson, Gang Xiao, S. S. P. Parkin, and R. H. Koch. Tunable magnetization damping in transition metal ternary alloys. Applied Physics Letters, 85(21):4995–4997, November 2004.
- [28] J. Fassbender, J. von Borany, A. Mücklich, K. Potzger, W. Möller, J. McCord, L. Schultz, and R. Mattheis. Structural and magnetic modifications of Cr-implanted Permalloy. Physical Review B, 73(18), May 2006.
- [29] W. Bailey, P. Kabos, F. Mancoff, and S. Russek. Control of magnetization dynamics in Ni/sub 81/Fe/sub 19/ thin films through the use of rare-earth dopants. IEEE Transactions on Magnetics, 37(4):1749–1754, July 2001.
- [30] J. O. Rantschler, R. D. McMichael, A. Castillo, A. J. Shapiro, W. F. Egelhoff, B. B. Maranville, D. Pulugurtha, A. P. Chen, and L. M. Connors. Effect of 3d, 4d, and 5d transition metal doping on damping in permalloy thin films. Journal of Applied Physics, 101(3):033911, February 2007.
- [31] Xiaobin Wang, Bogdan Valcu, and Nan-Hsiung Yeh. Transition width limit in magnetic recording. Applied Physics Letters, 94(20):202508, 2009.
- [32] Gaspare Varvaro and Francesca Casoli. Ultra-High-Density Magnetic Recording: Storage Materials and Media Designs. CRC Press, March 2016.
- [33] Florian Slanovc, Christoph Vogler, Olivia Muthsam, and Dieter Suess. Systematic parameterization of heat-assisted magnetic recording switching probabilities and the consequences for the resulting snr. arXiv preprint arXiv:1907.03884, 2019.
- [34] F. B. Hagedorn. Analysis of Exchange‐Coupled Magnetic Thin Films. Journal of Applied Physics, 41(6):2491–2502, May 1970.
- [35] D. Suess. Multilayer exchange spring media for magnetic recording. Applied Physics Letters, 89(11):113105, September 2006.
- [36] Christoph Vogler, Claas Abert, Florian Bruckner, and Dieter Suess. Landau-Lifshitz-Bloch equation for exchange-coupled grains. Physical Review B, 90(21):214431, December 2014.
- [37] S. Hernández, P. Lu, S. Granz, P. Krivosik, P. Huang, W. Eppler, T. Rausch, and E. Gage. Using Ensemble Waveform Analysis to Compare Heat Assisted Magnetic Recording Characteristics of Modeled and Measured Signals. IEEE Transactions on Magnetics, 53(2):1–6, February 2017.