Improving Deep Lesion Detection Using 3D Contextual and Spatial Attention
Abstract
Lesion detection from computed tomography (CT) scans is challenging compared to natural object detection because of two major reasons: small lesion size and small inter-class variation. Firstly, the lesions usually only occupy a small region in the CT image. The feature of such small region may not be able to provide sufficient information due to its limited spatial feature resolution. Secondly, in CT scans, the lesions are often indistinguishable from the background since the lesion and non-lesion areas may have very similar appearances. To tackle both problems, we need to enrich the feature representation and improve the feature discriminativeness. Therefore, we introduce a dual-attention mechanism to the 3D contextual lesion detection framework, including the cross-slice contextual attention to selectively aggregate the information from different slices through a soft re-sampling process. Moreover, we propose intra-slice spatial attention to focus the feature learning in the most prominent regions. Our method can be easily trained end-to-end without adding heavy overhead on the base detection network. We use DeepLesion dataset and train a universal lesion detector to detect all kinds of lesions such as liver tumors, lung nodules, and so on. The results show that our model can significantly boost the results of the baseline lesion detector (with 3D contextual information) but using much fewer slices.
1 Introduction
As one of the essential computer-aided detection/diagnosis (CADe/CADx) technologies, lesion detection has been studied by the medical imaging community for automatic disease screening and examination. With the great success of deep convolutional neural network (CNN) adoption in object detection in natural images [1, 2], many researchers utilized CNN based algorithms for detecting diseases in different modalities of medical images such as lesion detection in color retinal images [3], disease detection in X-ray[4], etc.
Despite the progress, lesion detection in computed tomography (CT) images is challenging due to the difficulty of learning discriminative feature representation. The primary reasons accounting for such difficulty include: 1) the lesion size can be extremely small compared to natural objects in a general object detection task, and this degrades the richness in the existing feature representation; 2) the inter-class variance is small, i.e., lesions and non-lesions often have very similar appearances.
To enrich the lesion features, lesion detection methods in CT images often take advantage of the intrinsic 3D context information. The works in [5, 6] exploit 3D CNNs to encode richer spatial and context information for more discriminative features. However, 3D CNN requires more computational resources and at the same time, it requires more efforts to annotate 3D bounding boxes. This motivates [7] to use (2+1)D information which aggregates 2D features from multiple consecutive CT slices. Particularly, in 3DCE [7], a set of consecutive slices are fed into a 2D detection network to generate feature maps separately, which are then aggregated along the channel dimension for the final detection task. Nevertheless, with the increasing number of neighbouring slices, the information extracted from some of the slices may be irrelevant whereas some of the slices may have higher importance for the correct prediction.
To solve this problem, we propose an attentive feature aggregation mechanism through a 3D contextual attention module to adaptively select important and relevant slices to be focused on. Moreover, to further improve the feature discrimintiveness for small regions in each CT slice, we introduce a similar spatial attention network as used in [8, 9] to mine the discriminative regions and concentrate the learning on these regions in each feature map. The self-attentive feature maps could enhance the differentiation between lesion and non-lesion proposals.
2 Methods
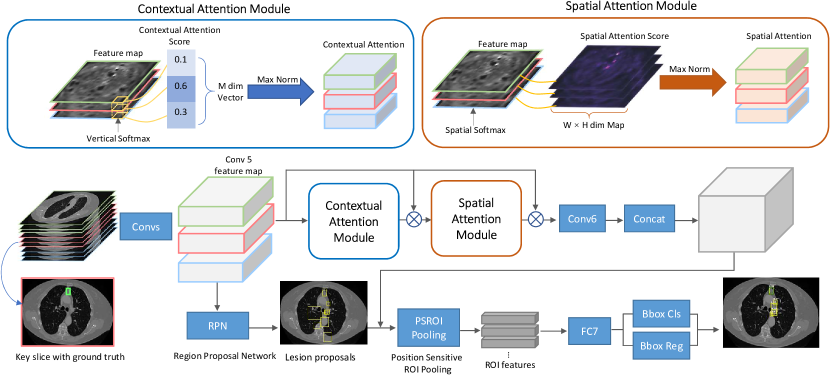
Fig. 1 gives an overview of the proposed lesion detection framework. In particular, we adopt an improved version of R-FCN [2] as the backbone object detection network which contains a region proposal network (RPN) to generate region proposals, followed by a position-sensitive pooling layer and two fully connected layers. The final classification branch distinguishes between lesion and non-lesion classes and the regression branch refines the bounding box coordinates for more accurate localization. To incorporate 3D context, we group slices into 3-channel images which include the key slice and neighbouring slices before and after the key slice. Similar to [7], instead of performing data-level fusion, we adopt feature integration by forwarding grouped images to the shared convolutional layers and then concatenating the features right before the position-sensitive ROI (PSROI) pooling layer. Finally, the lesion area is predicted with the aggregated features from all slices. The loss functions including the lesion classification loss and the bounding-box regression loss in both RPN and the improved R-FCN are optimized jointly.
The unique part of our framework lies in the introduced two attention modules: contextual attention module and spatial attention module, which are able to extract more important and discriminative features. In the following subsections, we describe our dual-attention mechanism including the contextual attention module to reweight the importance of contextual information, and the spatial attention module to focus on discriminative regions.
2.1 3D Contextual Attention Module
The 3D contextual attention module aims to selectively aggregate features from input images by attending to the relevant context information among all neighbouring slices. We denote the input feature map ( for vgg 16) of input image as (), where is the number of feature channels, and is the height and width of the feature map. The contextual attention module contains a convolutional layer denoted as in Equation 1. The contextual attention is calculated through a softmax function followed by a normalization operation.
| (1) |
| (2) |
| (3) |
| (4) |
In Equation 2, is the learnable scalar value which represents the importance or relevance score of each input slice at the position in the th feature map of . Then a softmax operation is performed along the vertical axis in the dimension of the slice deck (across slice images) to obtain the contextual attention vector . This generates attention values between to and all the elements sum up to in . Since most elements tend to have small values after the softmax operation, this makes the training sensitive to the learning rate. To stablize the training, as shown in Equation 3, we normalize the attention vector by dividing it with the max element in the vector. Finally, the output feature is obtained by taking element-wise multiplication (denoted as ) of the original input features and the attention maps as described in Equation 4.
With this attention module, the features from different slices are attentively aggregated with a learnable cross-slice attention vector to amplify the relevant contextual features and suppress irrelevant ones.
2.2 Spatial Attention Module
Spatial attention module is designed to optimize the feature learning for prominent regions by applying intra-slice attention on each feature plane. Similar to the contextual attention module, it contains a convolution layer () followed by a softmax function and a max normalization operation. As shown in Fig. 1, the spatial attention module takes refined features of all input images and generates spatial attention weight matrix for each feature map. The process can be mathematically written as:
| (5) |
| (6) |
| (7) |
| (8) |
The spatial attention module generates attentive feature maps by amplifying prominent regions within each feature plane in order to improve the richness in features for small lesions and increase the feature discrepancy between lesion and non-lesion regions.
3 Experiments
Dataset: To validate the effectiveness of our approach, we use DeepLesion [10] dataset that provides 32,120 axial CT slices with 2D bounding box annotations of lesion regions. The CT images are pre-processed in the same way as that in 3DCE [7]. We use the official split of samples which includes 22k samples for training, 5k for validation and another 5k for testing. Following the practice in [7], 35 noisy lesion annotations mentioned in the dataset are removed for training and testing.
Network and training: We initialize the network using pre-trained ImageNet vgg-16 model. In the proposed attention modules, we use a softmax with temperature of 3 for spatial attention and 2 for contextual attention. During the training, each mini-batch has 2 samples and each sample has three-channel images. Stochastic gradient decent (SGD) with momentum of 0.9 and decay of 5e-5 is used as the optimizer. We train 6 epochs using the base learning rate of 0.001, which is then reduced it by a factor of 10 after the 4th and 5th epochs.
Evaluation metrics: Following the standard practice, we use intersection-over-union (IoU) as the measure for overlap to evaluate the prediction results. We study sensitivities at [0.5, 1, 2, 4, 8, 16] to evaluate the performance by different model variants.
3.1 Results using Contextual and Spatial Attention
| Sensitivity @ | 0.5 | 1 | 2 | 4 | 8 | 16 |
|---|---|---|---|---|---|---|
| Improved R-FCN, 3 Slices [7] | 56.5 | 67.7 | 76.9 | 82.8 | 87.0 | 89.8 |
| 3DCE, 9 Slices [7] | 61.7 | 71.9 | 79.2 | 84.3 | 87.8 | 89.7 |
| 3DCE, 15 Slices [7] | 63.0 | 73.1 | 80.2 | 85.2 | 87.8 | 89.7 |
| 3DCE, 21 Slices [7] | 63.2 | 73.4 | 80.9 | 85.6 | 88.4 | 90.2 |
| 3DCE_CS_Att, 9 Slices (Ours) | 67.8 | 76.3 | 82.9 | 86.6 | 89.3 | 90.7 |
| 3DCE_CS_Att, 15 Slices (Ours) | 70.8 | 78.6 | 83.9 | 87.5 | 89.9 | 91.4 |
| 3DCE_CS_Att, 21 Slices (Ours) | 71.4 | 78.5 | 84.0 | 87.6 | 90.2 | 91.4 |
| Lesion type | Lesion diameter | Slice interval | |||||||||||
|---|---|---|---|---|---|---|---|---|---|---|---|---|---|
| LU | ME | LV | ST | PV | AB | KD | BN | <10 | 1030 | >30 | <2.5 | >2.5 | |
| 3DCE | 90.9 | 88.1 | 90.4 | 73.5 | 82.1 | 81.3 | 82.1 | 75.0 | 80.9 | 87.8 | 82.9 | 85.8 | 85.1 |
| 3DCE_CS_Att | 92.0 | 88.5 | 91.4 | 80.3 | 85.0 | 84.4 | 84.3 | 75.0 | 82.3 | 90.0 | 85.0 | 87.6 | 87.6 |
Firstly, we evaluate the effectiveness of our overall model, using the framework described in Section 2. We compare our method with the baseline methods as shown in Table 1. The improved R-FCN uses only 3 input slices fused at data-level. 3DCE improves the performance by adding more neighbouring slices and enabling the feature-level aggregation. Our method improves on 3DCE by introducing the contextual and spatial attention modules for attentive feature aggregation. We reproduce the results of 3DCE with different numbers of slices and achieve slightly higher results than those reported in their paper. Then we evaluate our model using the same numbers of slices as used in 3DCE. The results show that our method constantly boosts the accuracy at various FPs per image by around 7 - 8% in sensitivity at 0.5 and 2% in sensitivity at 4. More surprisingly, it is observed that our model using only 9 slices can greatly outperform the original 3DCE using 21 slices by a large margin while using much less computing resources in terms of GPU memory and computation time.
We further analyze the detection accuracy on different lesions types and image properties by splitting the test set according to three criteria: 1) Lesion type; 2) Lesion diameter (in mm) and 3) Slice interval (in mm) of the CT scans. The results for each split are shown in Table 2. There are eight types of lesions, including lung(LU), mediastinum(ME), liver(LV), soft tissue(ST), pelvis(PV), abdomen(AB), kidney(KD), and bone(BN) [10]. It is found that our method surpasses 3DCE in almost all lesion types. Especially for soft tissue lesion, our model achieves a large increase of 6.8% when compared with the baseline. In term of lesion diameter, the proposed method is slightly more effective on lesions that are larger than 10 mm. This is probably because the lesions smaller than 10 mm are less than 20 pixels in the CT image and have very low resolution at the attention maps (not greater than patches). Therefore, the attentive feature enhancement on very small lesions could be less effective than on lesions with slightly larger size. Lastly, our method can achieve a constant improvement for CT scans with different slice intervals since our model attentively aggregates the relevant information from different slices with a cross-slice normalization.
3.2 Ablation Study
| C_Att | S_Att | 0.5 | 1 | 2 | 4 | 8 | 16 |
|---|---|---|---|---|---|---|---|
| 63.0 | 73.1 | 80.2 | 85.2 | 87.8 | 89.7 | ||
| ✓ | 64.0 | 74.0 | 81.4 | 86.0 | 88.6 | 90.5 | |
| ✓ | 69.0 | 77.4 | 83.1 | 86.7 | 89.1 | 90.8 | |
| ✓ | ✓ | 70.8 | 78.6 | 83.9 | 87.5 | 89.9 | 91.4 |
In this section, we investigate the effectiveness of each proposed component. We study the sensitivity at different FPs per image by comparing the baseline 3DCE model with the following variants: 1) adding contextual attention (C_Att); 2) adding spatial attention (S_Att); and 3) adding both contextual and spatial attention. As shown in Table 3, applying contextual attention alone brings a slight and constant improvement to the baseline method, whereas the spatial attention module alone performs very well and boosts the sensitivity at 0.5 from 63% to 69% with 6% performance gain. While adding both C_Att and S_Att modules, we achieve a higher sensitivity of 70.8% at 0.5 and further improve the sole S_Att model by 1.8%.
It is observed that at fewer FPs per image (0.5, 1), the performance gain is mainly from spatial attention, indicating that the spatial attention is essential to improve the prediction confidence for positive boxes. On the other hand, at higher FPs contextual attention gets more and more important for the performance gain.
4 Visualization of Detection Results
4.1 Qualitative Results and Visualization
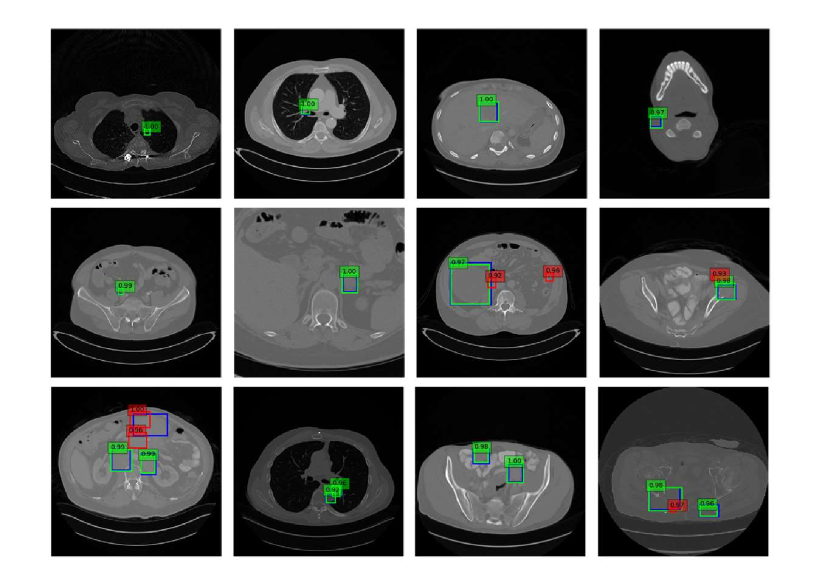
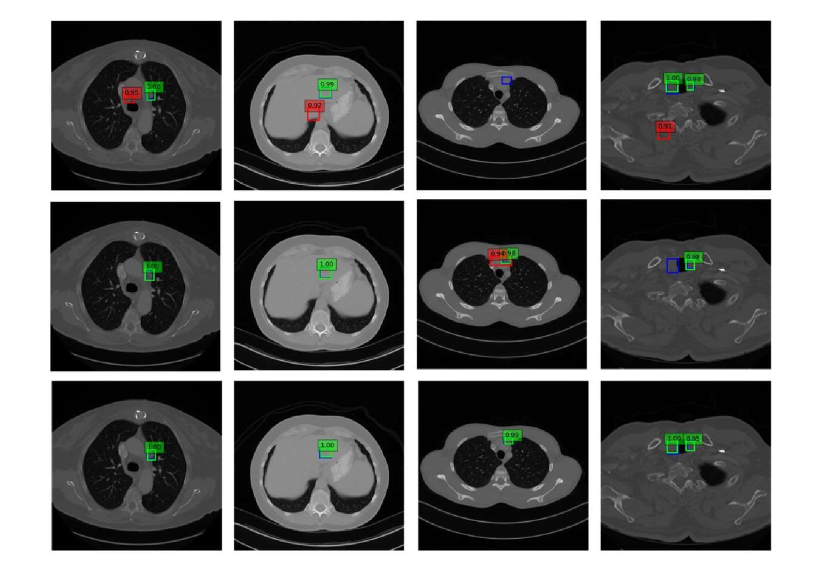
In this section, to better understand how spatial and contextual attentions work for discriminative region mining, we illustrate some intermediate results of cross-slice contextual attention for soft-sampling and the intra-slice spatial attention for feature re-weighting. Some examples of detection results are shown in Fig. 4 and Fig. 5.
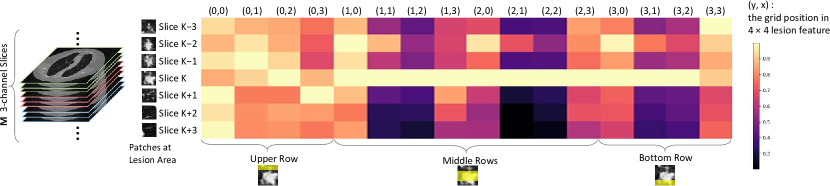
Contextual Attention: We visualize the contextual attention vectors at the lesion area in Fig. 2. There are input slices that are grouped in 3-channel images. For simplicity, we denote each 3-channel image as a “Slice” in the figure. Each column of the heatmap shows a weight vector to determine the importance of each slice ( to ) at position of the lesion feature map. Note that each vector has been normalized by its maximum element. It shows that at the upper part of the lesion area, all the slices almost have the same importance since there are no prominent features in this area. Near the center of the lesion area, the key slice is given the largest attention. Additionally, Slices and are also well-attended to provide additional information of the lesion since Slices and also catch the lesion appearance. Slices , and are suppressed by the contextual attention module since the lesion is absent from these slices.
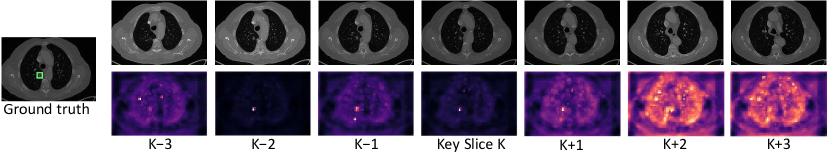
Spatial Attention: In Fig. 3, we show the attention maps generated by the spatial attention module. We use the same example as used in Fig. 2. Each attention map has been normalized by its maximum element. The lesion clearly appears in Slices , and key slice . Therefore, in the spatial attention map, we can see a clear pulse at the lesion area. Since the lesion disappears from Slices , and , the attention maps become plainer by which most feature grids are treated equally.
5 Conclusion
In this work, we studied the effectiveness of 3D contextual and spatial attention for lesion detection task in CT scans. The 3D contextual attention has been proposed to attentively aggregate the information from multiple slices. The spatial attention could help to concentrate the feature learning at the most discriminative regions within each feature map. We validated the effectiveness of our method with various experimental and analytic results, which shows that the proposed method brings a performance boost in the lesion detection task in CT scans.
References
- [1] Shaoqing Ren, Kaiming He, Ross Girshick, and Jian Sun, “Faster r-cnn: Towards real-time object detection with region proposal networks,” in NIPS, 2015, pp. 91–99.
- [2] Jifeng Dai, Yi Li, Kaiming He, and Jian Sun, “R-fcn: Object detection via region-based fully convolutional networks,” in NIPS, 2016, pp. 379–387.
- [3] Carson Lam, Caroline Yu, Laura Huang, and Daniel Rubin, “Retinal lesion detection with deep learning using image patches,” Investigative ophthalmology & visual science, vol. 59, no. 1, pp. 590–596, 2018.
- [4] Zhe Li, Chong Wang, Mei Han, Yuan Xue, Wei Wei, Li-Jia Li, and Li Fei-Fei, “Thoracic disease identification and localization with limited supervision,” in IEEE CVPR, 2018, pp. 8290–8299.
- [5] Fangzhou Liao, Ming Liang, Zhe Li, Xiaolin Hu, and Sen Song, “Evaluate the malignancy of pulmonary nodules using the 3-d deep leaky noisy-or network,” IEEE transactions on neural networks and learning systems, 2019.
- [6] Qi Dou, Hao Chen, Lequan Yu, Jing Qin, and Pheng-Ann Heng, “Multilevel contextual 3-d cnns for false positive reduction in pulmonary nodule detection,” IEEE Transactions on Biomedical Engineering, vol. 64, no. 7, pp. 1558–1567, 2017.
- [7] Ke Yan, Mohammadhadi Bagheri, and Ronald M Summers, “3d context enhanced region-based convolutional neural network for end-to-end lesion detection,” in MICCAI. Springer, 2018, pp. 511–519.
- [8] Fei Wang, Mengqing Jiang, Chen Qian, Shuo Yang, Cheng Li, Honggang Zhang, Xiaogang Wang, and Xiaoou Tang, “Residual attention network for image classification,” in IEEE CVPR, 2017, pp. 3156–3164.
- [9] Sanghyun Woo, Jongchan Park, Joon-Young Lee, and In So Kweon, “Cbam: Convolutional block attention module,” in ECCV, 2018, pp. 3–19.
- [10] Ke Yan, Xiaosong Wang, Le Lu, Ling Zhang, Adam P Harrison, Mohammadhadi Bagheri, and Ronald M Summers, “Deep lesion graphs in the wild: relationship learning and organization of significant radiology image findings in a diverse large-scale lesion database,” in IEEE CVPR, 2018, pp. 9261–9270.