Multiple gaps revealed by low temperature specific heat in the 1111-type CaFe0.88Co0.12AsF single crystals
Abstract
Low-temperature specific heat (SH) is measured on the 1111-type CaFe0.88Co0.12AsF single crystals under different magnetic fields. A clear SH jump with the height = 10.4 mJ/mol K2 was observed at the superconducting transition temperature . The electronic SH coefficient increases linearly with the field below 5 T and a kink is observed around 5 T, indicating a multi-gap feature in the present system. Such a sign is also reflected in the data. A detailed analysis shows that this behavior can be interpreted in terms of a two-gap scenario with the ratio .
pacs:
74.20.Rp, 74.70.Xa, 74.62.Dh, 65.40.BaSuperconducting (SC) mechanism is the central issue in the study of unconventional superconductors. Since the discovery of Fe-based superconductors (FeSCs) Kamihara et al. (2008), many efforts have been made on this problem Hirschfeld et al. (2011). Gap structure can supply very important information for this issue, because typically different SC mechanism will predict distinct gap symmetry and structure. For example, the Fermi surfaces with a better nesting condition tend to have a stronger pairing amplitude and larger SC gap in the itinerant mechanism Mazin and Schmalian (2009); Graser et al. (2009), while according to the local scenario, a larger SC gap should open on the smaller Fermi surface Seo et al. (2008). For the 1111 system with the ZrCuSiAs-type structure, the SC gap structure has been investigated by diverse methods and the conclusions are, however, rather controversial. Most of the early studies based on the polycrystalline samples claimed a nodal gap structure Mu et al. (2008); Matano et al. (2008); Shan et al. (2008). Later on, the nodeless scenarios were also reported by other groups, some of which were measured on single-crystalline samples Chen et al. (2008); Hashimoto et al. (2009); Malone et al. (2009). Overall, however, the investigations on this issue are still lacking. Especially, an in-depth specific heat study based on high-quality single crystals is almost blank, mainly because the SH measurements usually require a considerable sample mass. Specific heat (SH) is one of the powerful tools to measure the quasiparticle density of states (DOS) at the Fermi level to detect the information about the gap structure Wen et al. (2004); Mu et al. (2007, 2009); Wen et al. (2009); Mu et al. (2010, 2011). The feature of the gap structure can be essentially determined by measuring the variation in the electronic SH versus temperature and magnetic field Sigrist and Ueda (1991); Hussey (2002). Obviously, more efforts are urgently required to obtain the intrinsic thermodynamic property of this system.
Recently, due to the progresses on the single-crystal growth of the fluorine-based 1111 system Ca(Fe,Co)AsF Ma et al. (2015, 2016), systematic investigations have been carried out on this system Terashima et al. (2018); Xiao et al. (2016a, b); Ma et al. (2017); Xu et al. (2018); Ma et al. (2018); Gao et al. (2018); Mu and Ma (2018); Wang et al. (2019); Yu et al. (2019). In our previous works, a two-gap feature is revealed by the temperature dependence of lower critical field and point-contact spectroscopy measurements on the single-crystalline samples Wang et al. (2019); Yu et al. (2019). However, the ratio of the two gaps () is not very consistent between different measuring means. According to the data of , 5.2 Wang et al. (2019). While from point-contact spectroscopy measurement, the ratio 2.6 Yu et al. (2019) is obtained. Thus more experiments are required to further clarify this issue. In this paper, low temperature specific heat was measured on the 1111-type single crystals of CaFe0.88Co0.12AsF. A linear field dependence of the electronic SH coefficient is discovered in the field region below 5 T, which turns to another linear evolution with a smaller slope under the even higher field. This is very like the behavior of MgB2 Bouquet et al. (2002) and implies a clear two-gap picture. The ratio of the two gaps is estimated to be .
The CaFe0.88Co0.12AsF single crystals were grown by the self-flux method. The detailed growth conditions and sample characterizations has been reported in our previous work Ma et al. (2015, 2016). In order to ensure a sufficient mass for the SH measurement, three high-quality single crystals with very similar magnetization transitions (see the inset of Fig. 1) were chosen. The total mass of the three samples is 1.4 mg. The dc magnetization measurements were done with a superconducting quantum interference device (Quantum Design, MPMS 3). The specific heat were measured on the physical property measurement system (Quantum Design, PPMS). We employed the thermal relaxation technique to perform the specific heat measurements. The external field was applied along the axis of all the three single crystals during the SH measurements.
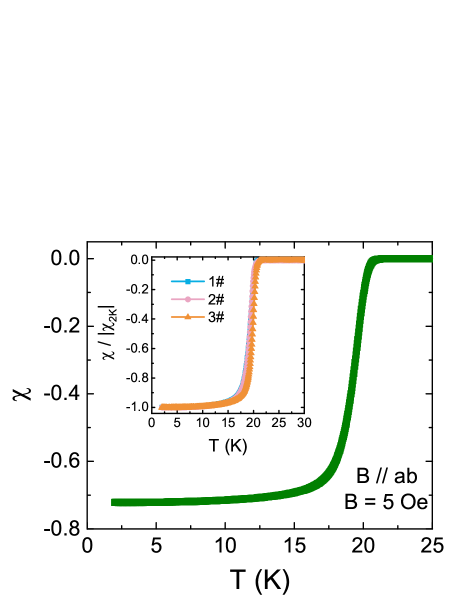
The superconducting transition of the single crystals was checked by the dc magnetization measurements down to 1.8 K. In the inset of Fig. 1, we show the temperature dependence of the normalized magnetization data for three CaFe0.88Co0.12AsF samples. The data were collected using a zero-field-cooling mode under a field of 5 Oe. The SC transitions for three samples are basically the same with the onset transition temperature = 21 K. In the main frame of Fig. 1, we show the magnetic susceptibility of the three samples measured together. The magnetic field was applied parallel to the ab-plane of the crystal to minimize the effect of the demagnetization when estimating the SC volume fraction. The SC volume fraction is determined to be about 72%. Although this value is not very high, the rather sharp SC transition indicates that the SC part of the sample is homogeneous and the discussion in this work is credible.
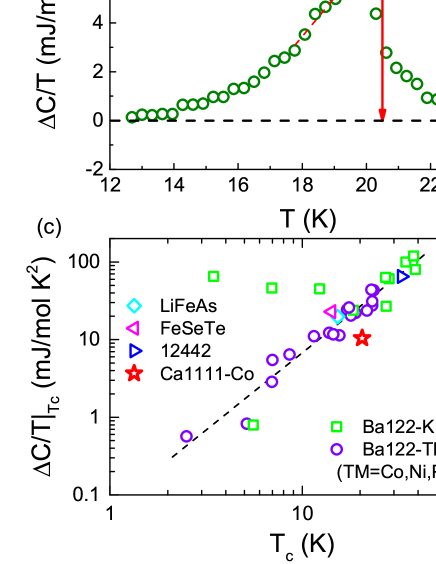
In Fig. 2(a) we show the raw data of SH coefficient vs under two differnet magnetic fields 0 T and 9 T. In order to have a convenient comparison with the 122 system, here one mole means Avogadro number of unit cells or two times of formula units, [CaFe0.88Co0.12AsF]2. An unobvious SH anomaly can be seen from the raw SH data under zero field near . The inset of Fig. 2(a) shows an enlarged view of this anomaly near the SC transition. Under 9 T, the SH anomaly was suppressed markedly due to the field-induced pair-breaking effect and could not be distinguished from the raw data which include a large contribution from phonon. In order to highlight the SH anomaly under 0 T, we subtracted the data under 9 T from the zero field data to eliminate influences of the phonon contributions and the results is shown in Fig. 2(b). The SH anomaly at zero field was determined to be about = 7.5 mJ/mol K2, as indicated by the red arrowed line in Fig. 2(b). Considering the non-SC fraction of about 28%, the actual magnitude of the SH anomaly should be = 10.4 mJ/mol K2. We found that this magnitude is clearly smaller than that observed in the 122 system with similar Mu et al. (2010) and markedly deviates from the plot based on the Bud’ko, Ni and Canfield (BNC) law Bud’ko et al. (2009), (see Fig. 2(c)). To have a meaningful comparison, the SH data for all the samples in this figure has been normalized to per [FeAs]2. Assuming a weak-coupling BCS picture where the ratio = 1.43, we can estimated the normal state electronic SH coefficient 7.3 mJ/mol K2. We note here that this value may be an upper limit of since typically the coupling strength is larger than the BCS prediction of 1.43.
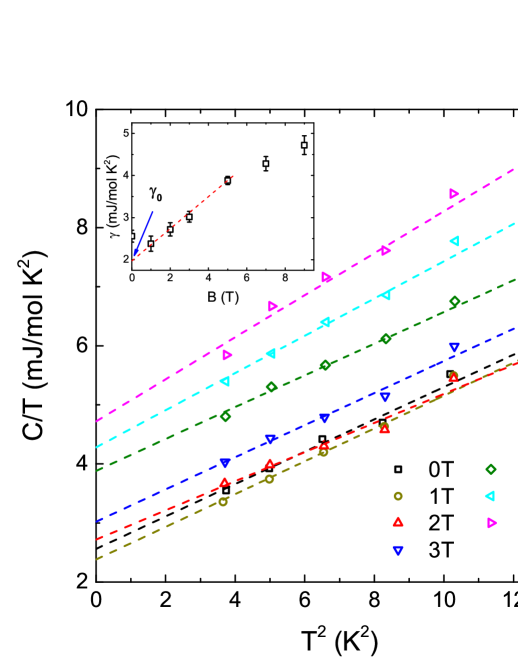
We next focus our attention on the SH data in the low temperature range to study the low-energy quasiparticle (QP) excitations. The raw data of the SH in various magnetic fields in the low-temperature region below 3.5 K is shown as vs in Fig. 3. The curves display a clear linear tendency in this low temperature region. No Schottky anomaly can be observed, which facilitates the following analysis of our data. The SH data generally shows a monotonous upward shift with the increase of the magnetic field, implying the QP excitation induced by the magnetic field. By extrapolating this linear tendency to zero temperature (as shown by the dashed lines in Fig. 3), we can obtain the field dependence of the electronic SH coefficient because the phonon contribution vanishes as the temperature is reduced to 0 K. As shown in the inset of Fig. 3, a residual term 2.0 mJ/mol K2 was revealed. Considering the rather small values of and , the magnitude of should not be ignored. Typically this term was attributed to the non-superconducting fraction of the sample and/or the residual quasiparticle DOS in the SC materials with d-wave or S± gap symmetry Wen et al. (2004); Mu et al. (2010); Bang (2010). Since a SC volume fraction was determined to be above 72% by the magnetization measurement (see Fig. 1), (27%) can mainly be attributed to the non-superconducting fraction of the sample.
The field-induced term )/72% is shown in Fig. 4(a). The data is divided by 72% to deduce the intrinsic SC property of this material. increases linearly as the magnetic field increases from 0 T to 5 T and shows a kink feature around 5 T, above which another linear evolution can be seen with a smaller slope. This behavior is very similar to that observed in the famous multi-band superconductor MgB2, where a two-gap picture is proposed Bouquet et al. (2002). Obviously such an observation is consistent qualitatively with the reported of the lower critical field and point-contact spectroscopy measurements Wang et al. (2019); Yu et al. (2019). In order to give a more precise understanding, we attempted to obtain the normal state values of and the out-of-plane upper critical field (). The value of = 7.3 mJ/mol K2 has been derived from the height of SH jump. As for the estimation of , experiments under high magnetic fields reveal that the curve shows a roughly linear behavior at low temperature Fang et al. (2010); Khim et al. (2011) and doesn’t display a flattening tendency near 0 K as predicted by the Werthamer-Helfand-Hohenberg (WHH) relationWerthamer et al. (1966). From the data of our previous work Ma et al. (2017), we can obtain the data of the present system near and replot it as vs , as shown in Fig. 4(a) (right). Assuming a similar linear evolution of at low temperature, just as the high-field experiments have revealed, a zero-temperature value of can be estimated to be 25 T (see the blue dashed line in Fig. 4(a)). We note that this value does not exceed the the Pauli paramagnetic limit = 39 T Clogston (1962). The position of the normal state (, ) is shown by the red diamond in Fig. 4(a).
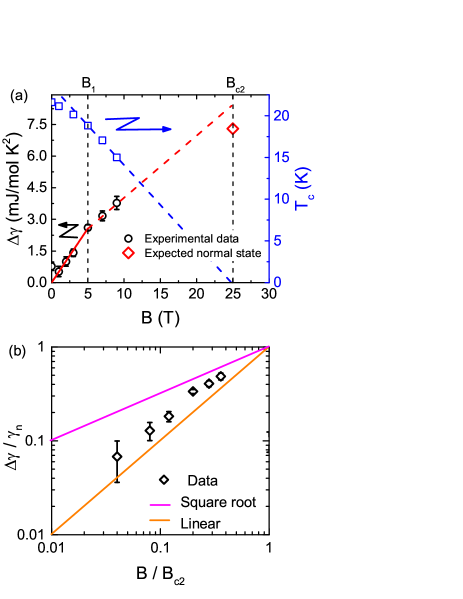
Following the tendency of the linear dependence above 5 T as shown by the red dashed line in Fig. 4(a), achieves the value slightly higher than the expected normal state value at . This is reasonable because considerable overlapping of zero-energy density of states at each core can make the linear behavior in change to nonlinear even for the isotropic gap Nakai et al. (2004). Moreover, a change of the slope can also be observed around = 5 T in the curve. Such an accordance supplies a good example that the multi-gap feature can be reflected in the temperature dependent data. As shown by the vertical dashed lines in Fig. 3(a), now we have two characteristic fields: and . Within the multiple-gap picture, these two fields corresponds to two gaps in different Fermi surfaces (FSs) Bouquet et al. (2002); Bourgeois-Hope et al. (2016). is a virtual upper critical field for band with a smaller gap while is the upper critical field for that with a lager gap. In this case, we have and , where and are the Fermi velocities in the Fermi surface with the larger and smaller gap respectively. According our previous estimation Wang et al. (2019), we have = . Considering the fact that = 5, we can give an estimation = . To have a vivid impression, we replotted the data in logarithmic scale with both coordinate axes normalized and showed the results in Fig. 4(b). All the experimental data locate in between the magenta and orange lines, which represent the square root and linear relations between and respectively. The square root behavior is a characteristic of the SC gap with line nodes Volovik (1993, 1997) and the linear relation is a consequence of the isotropic gap structure Nakai et al. (2004). Thus the degree of the gap anisotropy in the present system is lower than the line nodal case.
In summary, we studied the low-temperature specific heat of the 1111-type CaFe0.88Co0.12AsF single crystals. We found an SH jump with the height of 10.4 mJ/mol K2, which diverges from the BNC scaling. The electronic SH coefficient shows a linear increase with field in the field region below 5 T and changes the slope with further increasing the field, indicating a multi-gap behavior. The degree of the anisotropy was estimated to be .
Acknowledgements.
This work is supported by the Youth Innovation Promotion Association of the Chinese Academy of Sciences (No. 2015187), the Natural Science Foundation of China (No. 11204338), and the “Strategic Priority Research Program (B)” of the Chinese Academy of Sciences (No. XDB04040300). W.L. also acknowledges the start-up funding from Fudan University.References
- Kamihara et al. (2008) Y. Kamihara, T. Watanabe, M. Hirano, and H. Hosono, J. Am. Chem. Soc. 130, 3296 (2008).
- Hirschfeld et al. (2011) P. J. Hirschfeld, M. M. Korshunov, and I. I. Mazin, Rep. Prog. Phys. 74, 124508 (2011).
- Mazin and Schmalian (2009) I. Mazin and J. Schmalian, Physica C 469, 614 (2009).
- Graser et al. (2009) S. Graser, T. A. Maier, P. J. Hirschfeld, and D. J. Scalapino, New J. Phys. 11, 025016 (2009).
- Seo et al. (2008) K. Seo, B. A. Bernevig, and J. Hu, Phys. Rev. Lett. 101, 206404 (2008).
- Mu et al. (2008) G. Mu, X. Y. Zhu, L. Fang, L. Shan, C. Ren, and H. H. Wen, Chin. Phys. Lett 25, 2221 (2008).
- Matano et al. (2008) K. Matano, Z. A. Ren, X. L. Dong, L. L. Sun, Z. X. Zhao, and G. Q. Zheng, EPL (Europhysics Letters) 83, 57001 (2008).
- Shan et al. (2008) L. Shan, Y. Wang, X. Zhu, G. Mu, L. Fang, C. Ren, and H.-H. Wen, EPL (Europhysics Letters) 83, 57004 (2008).
- Chen et al. (2008) T. Y. Chen, Z. Tesanovic, R. H. Liu, X. H. Chen, and C. L. Chien, Nature 453, 1224 (2008).
- Hashimoto et al. (2009) K. Hashimoto, T. Shibauchi, T. Kato, K. Ikada, R. Okazaki, H. Shishido, M. Ishikado, H. Kito, A. Iyo, H. Eisaki, et al., Phys. Rev. Lett. 102, 017002 (2009).
- Malone et al. (2009) L. Malone, J. D. Fletcher, A. Serafin, A. Carrington, N. D. Zhigadlo, Z. Bukowski, S. Katrych, and J. Karpinski, Phys. Rev. B 79, 140501 (2009).
- Wen et al. (2004) H.-H. Wen, Z.-Y. Liu, F. Zhou, J. Xiong, W. Ti, T. Xiang, S. Komiya, X. Sun, and Y. Ando, Phys. Rev. B 70, 214505 (2004).
- Mu et al. (2007) G. Mu, Y. Wang, L. Shan, and H.-H. Wen, Phys. Rev. B 76, 064527 (2007).
- Mu et al. (2009) G. Mu, H. Luo, Z. Wang, L. Shan, C. Ren, and H.-H. Wen, Phys. Rev. B 79, 174501 (2009).
- Wen et al. (2009) H.-H. Wen, G. Mu, H. Luo, H. Yang, L. Shan, C. Ren, P. Cheng, J. Yan, and L. Fang, Phys. Rev. Lett. 103, 067002 (2009).
- Mu et al. (2010) G. Mu, B. Zeng, P. Cheng, Z.-S. Wang, L. Fang, B. Shen, L. Shan, C. Ren, and H.-H. Wen, Chin. Phys. Lett. 27, 037402 (2010).
- Mu et al. (2011) G. Mu, J. Tang, Y. Tanabe, J. Xu, S. Heguri, and K. Tanigaki, Phys. Rev. B 84, 054505 (2011).
- Sigrist and Ueda (1991) M. Sigrist and K. Ueda, Rev. Mod. Phys. 63, 239 (1991).
- Hussey (2002) N. E. Hussey, Advances in Physics 51, 1685 (2002).
- Ma et al. (2015) Y. H. Ma, H. Zhang, B. Gao, K. K. Hu, Q. C. Ji, G. Mu, F. Q. Huang, and X. M. Xie, Supercond. Sci. Technol. 28, 085008 (2015).
- Ma et al. (2016) Y. H. Ma, K. K. Hu, Q. C. Ji, B. Gao, H. Zhang, G. Mu, F. Q. Huang, and X. M. Xie, J. Cryst. Growth 451, 161 (2016).
- Terashima et al. (2018) T. Terashima, H. T. Hirose, D. Graf, Y. Ma, G. Mu, T. Hu, K. Suzuki, S. Uji, and H. Ikeda, Phys. Rev. X 8, 011014 (2018).
- Xiao et al. (2016a) H. Xiao, B. Gao, Y. H. Ma, X. J. Li, G. Mu, and T. Hu, J. Phys.: Condens. Matter 28, 455701 (2016a).
- Xiao et al. (2016b) H. Xiao, B. Gao, Y. H. Ma, X. J. Li, G. Mu, and T. Hu, J. Phys.: Condens. Matter 28, 325701 (2016b).
- Ma et al. (2017) Y. H. Ma, Q. C. Ji, K. K. Hu, B. Gao, W. Li, G. Mu, and X. M. Xie, Supercond. Sci. Technol. 30, 074003 (2017).
- Xu et al. (2018) B. Xu, H. Xiao, B. Gao, Y. H. Ma, G. Mu, P. Marsik, E. Sheveleva, F. Lyzwa, Y. M. Dai, R. P. S. M. Lobo, et al., Phys. Rev. B 97, 195110 (2018).
- Ma et al. (2018) Y. H. Ma, G. Mu, T. Hu, Z. W. Zhu, Z. J. Li, W. Li, Q. C. Ji, X. Zhang, L. L. Wang, and X. M. Xie, Sci. China Phys. Mech. 61, 127408 (2018).
- Gao et al. (2018) B. Gao, Y. Ma, G. Mu, and H. Xiao, Phys. Rev. B 97, 174505 (2018).
- Mu and Ma (2018) G. Mu and Y. Ma, Acta Phys. Sin. 67, 177401 (2018).
- Wang et al. (2019) T. Wang, Y. Ma, W. Li, J. Chu, L. Wang, J. Feng, H. Xiao, Z. Li, T. Hu, X. Liu, et al., npj Quantum Materials 4, 33 (2019).
- Yu et al. (2019) A. Yu, L. Lei, Y. Wu, T. Wang, Y. Ma, G. Mu, H. Xiao, and T. Hu, unpublished (2019).
- Bouquet et al. (2002) F. Bouquet, Y. Wang, I. Sheikin, T. Plackowski, A. Junod, S. Lee, and S. Tajima, Phys. Rev. Lett. 89, 257001 (2002).
- Bud’ko et al. (2009) S. L. Bud’ko, N. Ni, and P. C. Canfield, Phys. Rev. B 79, 220516 (2009).
- Chu et al. (2009) J.-H. Chu, J. G. Analytis, C. Kucharczyk, and I. R. Fisher, Phys. Rev. B 79, 014506 (2009).
- Ni et al. (2009) N. Ni, A. Thaler, A. Kracher, J. Q. Yan, S. L. Bud’ko, and P. C. Canfield, Phys. Rev. B 80, 024511 (2009).
- Ni et al. (2008) N. Ni, S. L. Bud’ko, A. Kreyssig, S. Nandi, G. E. Rustan, A. I. Goldman, S. Gupta, J. D. Corbett, A. Kracher, and P. C. Canfield, Phys. Rev. B 78, 014507 (2008).
- Welp et al. (2009) U. Welp, R. Xie, A. E. Koshelev, W. K. Kwok, H. Q. Luo, Z. S. Wang, G. Mu, and H. H. Wen, Phys. Rev. B 79, 094505 (2009).
- Bud’ko et al. (2013) S. L. Bud’ko, M. Sturza, D. Y. Chung, M. G. Kanatzidis, and P. C. Canfield, Phys. Rev. B 87, 100509 (2013).
- Bang (2010) Y. Bang, Phys. Rev. Lett. 104, 217001 (2010).
- Fang et al. (2010) M. Fang, J. Yang, F. F. Balakirev, Y. Kohama, J. Singleton, B. Qian, Z. Q. Mao, H. Wang, and H. Q. Yuan, Phys. Rev. B 81, 020509 (2010).
- Khim et al. (2011) S. Khim, B. Lee, J. W. Kim, E. S. Choi, G. R. Stewart, and K. H. Kim, Phys. Rev. B 84, 104502 (2011).
- Werthamer et al. (1966) N. R. Werthamer, E. Helfand, and P. C. Hohenberg, Phys. Rev. 147, 295 (1966).
- Clogston (1962) A. M. Clogston, Phys. Rev. Lett. 9, 266 (1962).
- Nakai et al. (2004) N. Nakai, P. Miranovi, M. Ichioka, and K. Machida, Phys. Rev. B 70, 100503 (2004).
- Bourgeois-Hope et al. (2016) P. Bourgeois-Hope, S. Chi, D. A. Bonn, R. Liang, W. N. Hardy, T. Wolf, C. Meingast, N. Doiron-Leyraud, and L. Taillefer, Phys. Rev. Lett. 117, 097003 (2016).
- Volovik (1993) G. E. Volovik, JETP Lett. 58, 469 (1993).
- Volovik (1997) G. E. Volovik, JETP Lett. 65, 491 (1997).