Beyond UVJ:
More Efficient Selection of Quiescent Galaxies With UV / Mid-IR Fluxes
Abstract
The UVJ color-color diagram is a popular and efficient method to distinguish between quiescent and star-forming galaxies through their rest-frame vs. colors. Here we explore the information content of this color-color space using the Bayesian inference machine Prospector. We fit the same physical model to two datasets: (i) UVJ fluxes alone, and (ii) full UV-mid IR (MIR) broadband SEDs from the 3D-HST survey. Notably this model uses both nonparametric SFHs and a flexible dust attenuation curve, both of which have the potential to ‘break’ the typical correlations observed in UVJ color-color space. Instead, these fits confirm observed trends between UVJ colors and observed galaxy properties, including specific star formation rate (sSFR), dust attenuation, stellar age, and stellar metallicity. They also demonstrate that UVJ colors do not, on their own, constrain stellar age or metallicity; the observed trends in the UVJ diagram are instead driven by galaxy scaling relationships and thus will evolve with cosmological time. We also show that UVJ colors “saturate” below , i.e. changing sSFR no longer produces substantial changes in UVJ colors. We show that far-UV and/or MIR fluxes continue to correlate with sSFR down to low sSFRs and can be used in color-color diagrams to efficiently target galaxies with much lower levels of ongoing star formation. We provide selection criteria in these new color-color spaces as a function of desired sample sSFR.
1 Introduction
Quantifying the rate of stellar mass assembly in star-forming and quiescent galaxies over the past Gyr is necessary to understand how the present-day galaxy population formed. Such an investigation requires large numbers of both star-forming and quiescent galaxies at early epochs. Separating the two populations can be challenging, with the most direct methods requiring expensive spectroscopic measurements such as Dn4000 (Kauffmann et al. 2003) or H equivalent width (Brinchmann et al. 2004).
During the last decade, rest-frame color-color diagrams and in particular the UVJ diagram have been very popular for separating these two categories of galaxies, in part because they can be efficiently applied to large photometric samples (e.g., Daddi et al. 2004; Williams et al. 2009; Arnouts et al. 2013). Williams et al. (2009) originally devised the UVJ color-color selection, based on the corresponding color-color diagram introduced by Wuyts et al. (2007) (see also BzK selection, Daddi et al. 2004). This approach uses near-infrared photometry to solve the long-running problem of distinguishing between galaxies which are optically red due to age and galaxies which are optically red due to dust attenuation (e.g., Strateva et al. 2001; Balogh et al. 2004; Baldry et al. 2004. Since then, UVJ selection has been used to sort galaxy samples at all cosmic epochs with great success (e.g., Whitaker et al. 2013; Barro et al. 2014; Straatman et al. 2014; Papovich et al. 2018). The efficacy of this selection has been confirmed with deep MIR imaging revealing low average sSFRs in UVJ-selected quiescent galaxies: sSFR (Fumagalli et al. 2014). Simulations have even begun assigning UVJ colors to their outputs in order to define quiescence (e.g., Davé, Rafieferantsoa, & Thompson 2017; Donnari et al. 2018).
However, advances in statistics, modeling, and reams of new data have provided sophisticated tools to evaluate UVJ classification in new detail. Recent studies using spectroscopic information (Belli et al. 2017; Schreiber et al. 2018), spectral energy distribution (SED) fitting (Díaz-García et al. 2017; Fang et al. 2018; Merlin et al. 2018), and combinations of methods (Moresco et al. 2013) find that UVJ-quiescent selection includes contamination from star-forming galaxies. Furthermore, there exist correlations in the quiescent part of the UVJ diagram which permit measurements of ages (Whitaker et al. 2013; Belli, Newman, & Ellis 2018), and when UVJ colors are combined with stellar mass and redshift, it has been claimed that one can measure metallicities, extinctions, and sSFRs as well (Díaz-García et al. 2017).
Building on these findings, here we use the Bayesian inference machine Prospector (Johnson & Leja 2017; Leja et al. 2017) to examine the ability of straightforward UVJ color-color cuts to diagnose stellar populations properties. Bayesian inference is the natural tool for this task as it is designed to deal with complex correlations such as those that exist between galaxy properties and rest-frame colors.
Throughout the paper we use a Chabrier (2003) IMF and a WMAP9 (Hinshaw et al. 2013) cosmology. All parameters are reported as the median of their respective probability distribution and all magnitudes are in the AB system.
2 Data and Models
We use the Prospector Bayesian inference machine (Leja et al. 2017; Johnson & Leja 2017) to translate galaxy photometry into parameter posteriors. This approach uses the Flexible Stellar Population Synthesis (FSPS) stellar populations (Conroy, Gunn, & White 2009) code to construct a physical model and the nested sampler dynesty (Speagle 2019) to sample the posterior space.
Within the Prospector framework we construct two closely related physical models, one optimized to fit observed panchromatic galaxy SEDs and one to fit synthetic UVJ fluxes.
2.1 Fitting Observed Panchromatic Photometry
To better understand how the properties of observed galaxies correlate with their rest-frame UVJ colors, we take the physical parameters derived from Prospector fits to the 3D-HST photometric catalogs (Skelton et al. 2014) from Leja et al. (2019b).
These fits use a modified version of the Prospector physical model, described in detail in Leja et al. (2019b). In brief, this model includes a 7-bin nonparametric star formation history (SFH) with a prior emphasizing smoothness in SFR(t) (Leja et al. 2019a), a two-component dust model with a flexible attenuation curve (Charlot & Fall 2000), free stellar metallicity with a mass-metallicity prior, and hot dust emission from an active galactic nucleus (Leja et al. 2018). This model also includes dust emission via energy balance and nebular emission self-consistently powered by the stellar fluxes.
The 3D-HST catalogs provide observed-frame 0.3m24m photometry and redshifts for some 200,000 galaxies. These galaxies are in five well-studied extragalactic fields and are imaged in photometric bands. In this work we use a sub-sample of galaxies with stellar mass M M⊙ in the redshift range , corresponding to 12,235 galaxies.

2.2 Fitting Synthetic UVJ Fluxes
We also fit a grid of rest-frame , , and fluxes to determine the constraining power of UVJ fluxes alone. These fluxes specify a single UVJ color and are given an arbitrary normalization. We generate 625 sets of UVJ fluxes corresponding to a regular grid in and .
We fit these fluxes with the modified Prospector model described above. The mass-metallicity prior is replaced with a flat metallicity prior over to ensure the analysis is independent of stellar mass. The maximum stellar age is set to 6 Gyr, corresponding to the age of the Universe at . The fluxes are assigned errors of 2.5%, though to preserve the UVJ colors the fluxes themselves are not perturbed.
3 Galaxy Properties in the UVJ Diagram
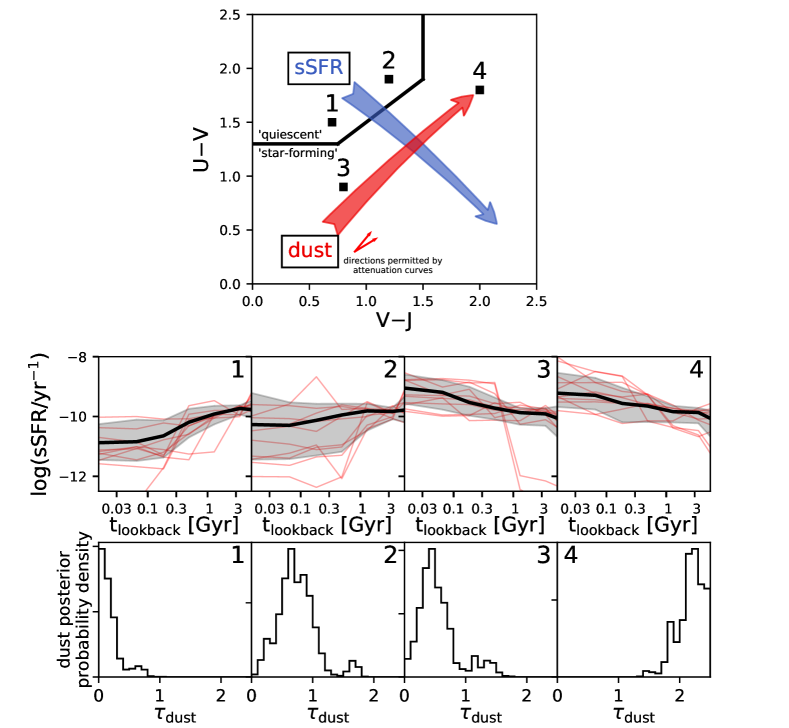
Williams et al. (2009) show that UVJ selection can separate dusty star-forming galaxies from quiescent galaxies because dusty star-forming galaxies are red in while quiescent galaxies are blue in . While largely an empirical finding, this behavior was shown to be consistent with constrained dust models using fixed attenuation curves and parametric SFHs. However, there is a growing body of evidence suggesting that galaxies have a diversity of dust attenuation curves (Salmon et al. 2016; Leja et al. 2017; Salim, Boquien, & Lee 2018; Narayanan et al. 2018) and a diversity of star formation histories (Pacifici et al. 2016; Iyer et al. 2019). Here, we use a more complex two-component dust model allowing variation in the shape of the dust attenuation curve and a flexible nonparametric distribution of stellar ages, allowing us to test the robustness of these conclusions to these assumptions.
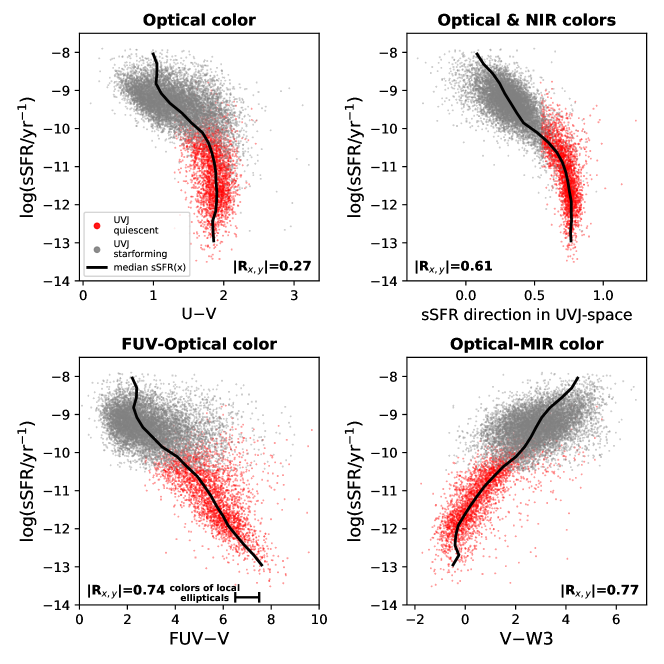
Figure 1 shows how the SFH and dust posteriors change as a function of rest-frame UVJ colors111Here we adopt the UVJ quiescent selection criteria from Whitaker et al. (2012). The posteriors are derived by fitting synthetic UVJ fluxes described in Section 2.2. This illustrates that UVJ colors continue to put robust constraints on both sSFR and dust attenuation even after allowing for the presence of confounding effects like age, stellar metallicity, and flexible dust models.
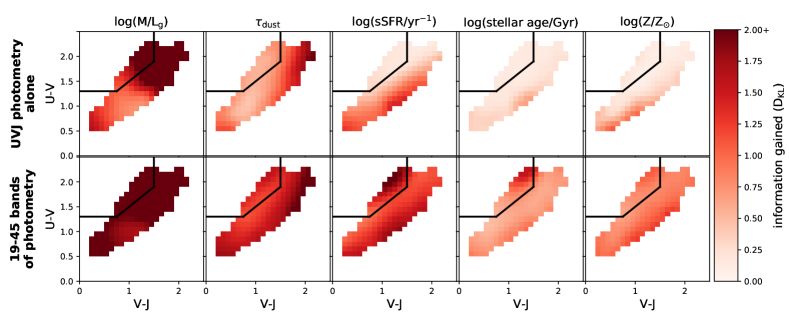
Figure 2 explores further trends between galaxy properties and UVJ colors. Galaxy properties are inferred both from synthetic UVJ fluxes and from fits to the observed UV-MIR SEDs. For the observed galaxies where many objects fall within a single UVJ pixel, the median value is shown. Only pixels containing at least 10 galaxies are shown. The maps are smoothed with a Gaussian with =1 pixel in order to highlight trends.
Some of these parameters, such as M/Lg and dust attenuation, show strong and consistent trends whether fitting simple UVJ fluxes or the full photometric SED. These parameters are well constrained by UVJ colors alone. Other parameters, such as mean stellar age and metallicity, show no structure in UVJ space until constrained by the full photometric SED. These properties are either weakly constrained or not constrained by UVJ colors alone. This suggests that trends in the observed galaxies are induced by galaxy scaling relationships.
sSFR is a special case in this comparison. While the median sSFR of star-forming galaxies is unchanged when constrained with UVJ fluxes or the full SED, the median sSFR of quiescent galaxies becomes much lower. This is because galaxies with moderate sSFRs, e.g. sSFR yr-1, can also fall into the UVJ-quiescent region. This is a key result of this Letter, discussed further in Section 4.
One important caveat is that it is not clear from the parameter maps alone whether these trends are being driven by the data or by assumptions built into the model. One way to distinguish between the two is to measure the difference between the prior and the posterior distributions. A reliable metric for this is the Kullback-Leibler divergence (hereafter DKL), defined as
| (1) |
for two probability distributions and .
In Bayesian analysis, DKL calculated from the prior to the posterior is interpreted as the information gained by fitting the data. If no information is gained, the prior and the posterior are identical and D. As DKL increases, the posterior and the prior become increasingly divergent.
Figure 3 is constructed in an analogous fashion to Figure 2 and shows DKL from the prior to the posterior. The median DKL for the galaxies in the pixel is shown for the full SED fits. The DKL maps for the synthetic UVJ fluxes confirm our previous conclusions: M/Lg, dust attenuation, and the sSFR of star-forming galaxies are fairly well-constrained by UVJ fluxes alone, while ages, metallicities, and the sSFRs of galaxies in the quiescent box are relatively unconstrained.
The average DKL increases substantially when fitting the full photometric SED. This is expected, as the full SED provides more information than UVJ fluxes alone. However this provides necessary confirmation that UV-MIR photometry can put meaningful constraints on these parameters and implies that the trends observed in Figure 2 are reliable – though fitting spectroscopic data has the potential to provide much more precise measurements (e.g. Belli et al. 2018).
These results taken together imply that the age and metallicity trends in the UVJ diagram are not specified by UVJ colors alone. Instead, galaxies must exist on some constrained plane in a high-dimensional parameter space (i.e. are subject to galaxy scaling relationships), with the shape of this plane then inducing correlations with UVJ colors. This means that these relationships can evolve with cosmological time. Indeed this evolution can be seen directly in the data: for example, the age-color trend in the quiescent box in Figure 2 is a combination of a mild age gradient at fixed redshift and the net evolution of the UVJ colors of the galaxy population across redshifts. Also, galaxies with sub-solar metallicity take about 3 Gyr to age into the UVJ-quiescent region (Tacchella et al. 2018), implying that UVJ selection will fail to identify low-metallicity quiescent galaxies at .
We note that DKL is not invariant to the chosen model. For example, the UVJ-quiescent region has a low DKL for sSFR when constrained only by UVJ colors. This is partly because UVJ colors are not correlated with sSFR for sSFR yr-1, but also partly because the model is able to produce star-forming galaxies (sSFR yr-1) with UVJ-quiescent colors by combining significant dust attenuation with steep, SMC-like attenuation curves. Such galaxies likely do not exist in the real Universe due to the physical correlation between increasingly flat attenuation curves and increasing dust attenuation (e.g. Chevallard et al. 2013): however, they are not ruled out a priori by the model, resulting in a lower-than-expected DKL. The full SED fits are robust to this effect as the full SED can reliably rule out the combination of high dust attenuation and steep attenuation curves.
4 Beyond UVJ
The fact that quiescent UVJ colors from the quiescent region do not appear to specify low sSFRs merits further investigation. While the UVJ diagram was designed to distinguish between star-forming and quiescent galaxies, Figures 2 and 3 together suggest that the UVJ quiescent selection cannot distinguish between moderate and low sSFRs. This is consistent with observational findings that % of UVJ-quiescent galaxies host significant ongoing star formation (Díaz-García et al. 2017; Belli et al. 2017; Schreiber et al. 2018).
Figure 4 examines the correlation between rest-frame colors and quiescence directly by plotting the relationship between several rest-frame colors and inferred from the Prospector fits to the 3D-HST photometry. The sSFR direction in UVJ-space is defined as the perpendicular direction to the quiescent selection line (Fang et al. 2018), indicated by the blue arrow in Figure 1.
This figure demonstrates the well-known fact that colors alone cannot distinguish between star-forming and quiescent galaxies (e.g., Eales et al. 2017). It further shows that while UVJ colors partially break this degeneracy, the correlation between color and sSFR begins to saturate at sSFR yr-1 and is fully saturated by sSFR yr-1.
The lower panels show how this relationship can be restored by instead using colors calculated with far-UV (FUV) or mid-infrared (MIR) fluxes, i.e. GALEX FUV ( ) and W3 (m). Colors constructed with these fluxes correlate with sSFR down to low sSFRs. The correlation between rest-frame color and sSFR is calculated using the Pearson correlation coefficient, shown in the corner of each panel. The increasing coefficient suggests that quiescent galaxies can be more cleanly identified with FUV or MIR fluxes. We note that the outliers in the V-W3 – sSFR relationship are almost entirely galaxies with significant mid-IR AGN emission: removing such galaxies using AGN indicators such as X-ray luminosities will further increase the efficacy of this selection.
One concern is that hot evolved stars can produce very blue colors which masquerade as star formation in the FUV (e.g., Han, Podsiadlowski, & Lynas-Gray 2007). We include observed colors from local quiescent galaxies as a rough upper bound for the size of this effect (Jeong et al. 2009). Notably, the abundance of hot evolved stars is difficult to predict even in local star clusters and may evolve significantly with redshift (e.g., Conroy & Gunn 2010).
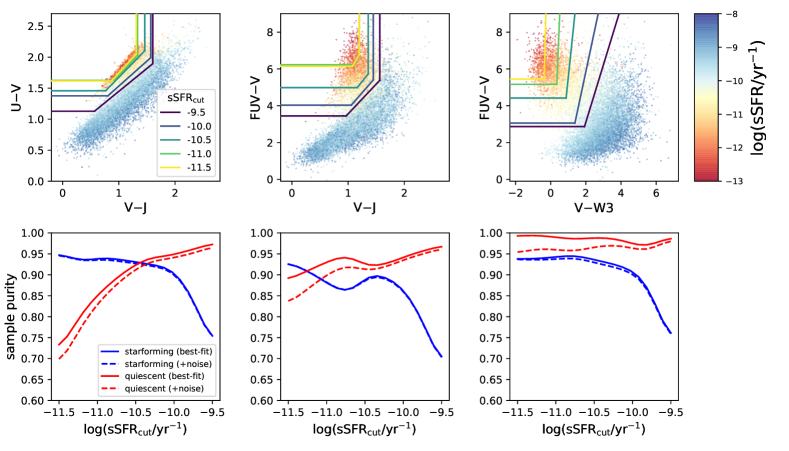
In Figure 5, we plot 3D-HST galaxies color-coded by sSFR to contrast the performance of the UVJ diagram with FUV/MIR color-color diagrams. We optimize the dividing line in color-color space to maximize the ‘purity’ of both quiescent and star-forming populations as sorted by their posterior median colors. Purity is defined as the fraction of galaxies in the quiescent (star-forming) box whose Prospector-inferred sSFRs are below (above) the target sSFR. This is done for a range of target sSFRs, and sample purity as a function of sSFR is shown below each color-color diagram. We simulate the effect of measurement uncertainty by drawing from the color posterior many times. The resulting median purities of the color-color selection are shown as dashed lines.
All of the diagrams perform fairly well at sSFR yr-1. However, for lower sSFRs the UVJ diagram becomes increasingly inefficient while the FUV+MIR color-color diagram remains near 100% purity even after accounting for the effects of measurement uncertainty. This suggests that FUV/MIR fluxes are a more efficient method to select galaxies with low or very low sSFRs.
Here we report the best-fit color-color divisions for log(sSFRcut/yr-1) = , respectively. Galaxies are defined as quiescent when their rest-frame colors meet the following criteria:
| (2) | ||||
| (3) | ||||
| (4) |
For the , diagram, , , , and .
For the , diagram, , , , and .
For the , diagram, , , , and .
5 Summary and Discussion
Here we have used Bayesian inference to show that many galaxy properties are well-correlated with their rest-frame UVJ colors. By comparing these observed correlations to fits to synthetic UVJ fluxes, we have demonstrated that correlations with M/Lg, dust attenuation, and sSFR are caused by a unique mapping from colors to galaxy properties whereas correlations with stellar age and stellar metallicity are most likely driven by galaxy scaling relationships. We have used the Kullback-Leibler divergence to show that these correlations are not driven by our model priors. We have further demonstrated that the relationship between UVJ colors and sSFR begins to saturate at , effectively meaning there is no sSFR-color relationship below this limit. Finally we show that the sSFR-color relationship remains robust to low levels when instead using color-color selection with FUV/MIR fluxes, and we present selection criteria in these new spaces.
First, our findings reaffirm the well-established fact that UVJ selection is largely successful in dividing the galaxy population into star-forming and quiescent systems (Fumagalli et al. 2014). The key niche filled by the proposed new color-color diagrams is their sensitivity to sSFR below sSFR yr-1, permitting the selection of a pure sample of low-sSFR galaxies. Sample selection often involves choosing tradeoffs between purity and completeness, and optimizing for completeness produces different selection criteria which are appropriate for different science goals. A more pure quiescent sample likely will increase the efficiency of searches for high-redshift quiescent galaxies (e.g. Schreiber et al. 2018) and may also produce cleaner distinctions between the structure of quiescent and star-forming galaxies (e.g. Hill et al. 2019).
One challenge is that far-UV and mid-IR photometry is not always readily available. The rest-frame far-UV is easily accessible for high-redshift galaxies as it corresponds to the observed-frame UV/optical. At lower redshifts () the far-UV is only accessible through GALEX, which has lower sensitivity and angular resolution. The most robust color-color diagram requires MIR detections or upper limits. While such data are currently difficult to obtain, the upcoming launch of JWST will allow observations of the rest-frame MIR out to .
This is not the first work which proposes color selection extending farther into the UV. Multiple studies find that GALEX is an excellent indicator of current versus past star formation activity Martin et al. (2007); Arnouts et al. (2007, 2013). Ilbert et al. (2013) note many of the same advantages in that are found here in , such as better dynamic range than and easier access in high-redshift galaxies. We note that tests in our framework have shown that -based colors have a somewhat stronger correlation with sSFR than -based colors.
These results also suggest that UVJ classification should be applied with care to spatially resolved photometry (e.g., Liu et al. 2017). It remains to be seen whether UVJ trends which are significantly affected by galaxy scaling relationships also hold on spatially-resolved scales.
Finally we note that, while color-color diagrams are straightforward and economic choice for sample selection, more precise and accurate statements about galaxy properties can often be made by fitting models to the observed SED.
References
- (1)
- (2) Arnouts, S., Walcher, C. J., Le Fèvre, O., et al. 2007, A&A, 476, 137
- (3)
- (4) Arnouts, S., Le Floc’h, E., Chevallard, J., et al. 2013, A&A, 558, A67
- (5)
- (6) Baldry, I. K., Glazebrook, K., Brinkmann, J., et al. 2004, ApJ, 600, 681
- (7)
- (8) Balogh, M. L., Baldry, I. K., Nichol, R., et al. 2004, ApJ, 615, L101
- (9)
- (10) Barro, G., Faber, S. M., Pérez-González, P. G., et al. 2014, ApJ, 791, 52
- (11)
- (12) Belli, S., Newman, A. B., & Ellis, R. S. 2018, ArXiv e-prints, arXiv:1810.00008
- (13)
- (14) Belli, S., Genzel, R., Förster Schreiber, N. M., et al. 2017, ApJ, 841, L6
- (15)
- (16) Brinchmann, J., Charlot, S., White, S. D. M., et al. 2004, MNRAS, 351, 1151
- (17)
- (18) Chabrier, G. 2003, PASP, 115, 763
- (19)
- (20) Charlot, S., & Fall, S. M. 2000, ApJ, 539, 718
- (21)
- (22) Chevallard, J., Charlot, S., Wandelt, B., & Wild, V. 2013, MNRAS, 432, 2061
- (23)
- (24) Conroy, C., & Gunn, J. E. 2010, ApJ, 712, 833
- (25)
- (26) Conroy, C., Gunn, J. E., & White, M. 2009, ApJ, 699, 486
- (27)
- (28) Daddi, E., Cimatti, A., Renzini, A., et al. 2004, ApJ, 617, 746
- (29)
- (30) Davé, R., Rafieferantsoa, M. H., & Thompson, R. J. 2017, MNRAS, 471, 1671
- (31)
- (32) Díaz-García, L. A., Cenarro, A. J., López-Sanjuan, C., et al. 2017, ArXiv e-prints, arXiv:1711.10590
- (33)
- (34) Donnari, M., Pillepich, A., Nelson, D., et al. 2018, arXiv e-prints, arXiv:1812.07584
- (35)
- (36) Eales, S., de Vis, P., W. L. Smith, M., et al. 2017, MNRAS, 465, 3125
- (37)
- (38) Fang, J. J., Faber, S. M., Koo, D. C., et al. 2018, ApJ, 858, 100
- (39)
- (40) Fumagalli, M., Labbé, I., Patel, S. G., et al. 2014, ApJ, 796, 35
- (41)
- (42) Han, Z., Podsiadlowski, P., & Lynas-Gray, A. E. 2007, MNRAS, 380, 1098
- (43)
- (44) Hill, A. R., van der Wel, A., Franx, M., et al. 2019, ApJ, 871, 76
- (45)
- (46) Hinshaw, G., Larson, D., Komatsu, E., et al. 2013, ApJS, 208, 19
- (47)
- (48) Ilbert, O., McCracken, H. J., Le Fèvre, O., et al. 2013, A&A, 556, A55
- (49)
- (50) Iyer, K. G., Gawiser, E., Faber, S. M., et al. 2019, arXiv e-prints, arXiv:1901.02877
- (51)
- (52) Jeong, H., Yi, S. K., Bureau, M., et al. 2009, MNRAS, 398, 2028
- (53)
- (54) Johnson, B., & Leja, J. 2017, bd-j/prospector: Initial release, , , doi:10.5281/zenodo.1116491. https://doi.org/10.5281/zenodo.1116491
- (55)
- (56) Kauffmann, G., Heckman, T. M., White, S. D. M., et al. 2003, MNRAS, 341, 33
- (57)
- (58) Leja, J., Carnall, A. C., Johnson, B. D., Conroy, C., & Speagle, J. S. 2019a, ApJ, 876, 3
- (59)
- (60) Leja, J., Johnson, B. D., Conroy, C., & van Dokkum, P. 2018, ApJ, 854, 62
- (61)
- (62) Leja, J., Johnson, B. D., Conroy, C., van Dokkum, P. G., & Byler, N. 2017, ApJ, 837, 170
- (63)
- (64) Leja, J., Johnson, B. D., Conroy, C., et al. 2019b, ApJ, 877, 140
- (65)
- (66) Liu, F. S., Jiang, D., Faber, S. M., et al. 2017, ApJ, 844, L2
- (67)
- (68) Martin, D. C., Wyder, T. K., Schiminovich, D., et al. 2007, The Astrophysical Journal Supplement Series, 173, 342
- (69)
- (70) Merlin, E., Fontana, A., Castellano, M., et al. 2018, MNRAS, 473, 2098
- (71)
- (72) Moresco, M., Pozzetti, L., Cimatti, A., et al. 2013, A&A, 558, A61
- (73)
- (74) Narayanan, D., Davé, R., Johnson, B. D., et al. 2018, MNRAS, 474, 1718
- (75)
- (76) Pacifici, C., Kassin, S. A., Weiner, B. J., et al. 2016, ApJ, 832, 79
- (77)
- (78) Papovich, C., Kawinwanichakij, L., Quadri, R. F., et al. 2018, ApJ, 854, 30
- (79)
- (80) Salim, S., Boquien, M., & Lee, J. C. 2018, ApJ, 859, 11
- (81)
- (82) Salmon, B., Papovich, C., Long, J., et al. 2016, ApJ, 827, 20
- (83)
- (84) Schreiber, C., Glazebrook, K., Nanayakkara, T., et al. 2018, A&A, 618, A85
- (85)
- (86) Skelton, R. E., Whitaker, K. E., Momcheva, I. G., et al. 2014, ApJS, 214, 24
- (87)
- (88) Speagle, J. S. 2019, arXiv e-prints, arXiv:1904.02180
- (89)
- (90) Straatman, C. M. S., Labbé, I., Spitler, L. R., et al. 2014, ApJ, 783, L14
- (91)
- (92) Strateva, I., Ivezić, Ž., Knapp, G. R., et al. 2001, AJ, 122, 1861
- (93)
- (94) Tacchella, S., Bose, S., Conroy, C., Eisenstein, D. J., & Johnson, B. D. 2018, ApJ, 868, 92
- (95)
- (96) Whitaker, K. E., Kriek, M., van Dokkum, P. G., et al. 2012, ApJ, 745, 179
- (97)
- (98) Whitaker, K. E., van Dokkum, P. G., Brammer, G., et al. 2013, ApJ, 770, L39
- (99)
- (100) Williams, R. J., Quadri, R. F., Franx, M., van Dokkum, P., & Labbé, I. 2009, ApJ, 691, 1879
- (101)
- (102) Wuyts, S., Labbé, I., Franx, M., et al. 2007, ApJ, 655, 51
- (103)