Plasmonic Properties of Close-packed Metallic Nanoparticle Mono- and Bilayers
Abstract
The self-assembly of metallic nanoparticles is a promising route to metasurfaces with unique properties for many optical applications, such as surface-enhanced spectroscopy, light manipulation, and sensing. We present an in-depth theoretical study of the optical properties of mono- and bilayers assembled from gold and silver nanoparticles. With finite-difference time-domain simulations, we predict the occurence of two plasmon modes, a bright and a dark mode, which exhibit symmetric and antisymmetric dipole configurations between the layers, respectively. The dark mode resonance energy depends sensitively on the size of the particles and the interparticle gaps. Hotspots with a nearfield intensity enhancement of up to 3000 are expected, which, together with the fact that the dark mode is roughly four times narrower than the bright mode, reveals how promising these materials are for spectroscopy purposes.
keywords:
self-assembly, gold nanoparticles, silver nanoparticles, bilayer, finite-difference time-domain (FDTD), dark plasmonContributed equally to this work \altaffiliationContributed equally to this work
This document is the unedited Author’s version of a Submitted Work that was subsequently accepted for publication in The Journal of Physical Chemistry C, copyright ©American Chemical Society after peer review. To access the final edited and published work see the following link: https://pubs.acs.org/doi/10.1021/acs.jpcc.9b03859.
1 Introduction
Noble-metal nanoparticles (NMNPs) have been studied for many years due to the unique way in which they interact with light. The interaction is mediated by the free electrons inside the nanoparticles (NPs) that are collectively excited by the incident light, which is known as a localized surface plasmon resonance (LSPR)EtchegoinBook2009, MaierBook2007. These resonances are strongly dependent on the structural parameters of the nanoparticles, such as shape and sizeKelly2003. Due to the strong electric nearfield generated by those excitations in the vicinity of the NMNPs, there is a remarkable enhancement of the optical properties of any material that is close to the metal surface. Consequently, the NMNPs are considered to be excellent systems for applications in high-resolution imaging beyond the diffraction limitGramotnev2010 and in spectroscopy techniques, such as, fluorescenceFlauraud2017, infrared absorptionHartstein1980 and surface-enhanced Raman scattering (SERS)Benz2016, Zhang2013, Kneipp1997, Moskovits1985. In fact, there are many other areas in which the NMNPs may be employed, for instance, in optoelectronic devices, as they can shape the light patterns on the nanoscaleSchuller2010, in biological and chemical sensingMayer2011, in signal-processing systemsGramotnev2010 and in photovoltaic devicesAtwater2010.
Beyond single nanoparticle systems, it is also possible to cluster nanoparticles together to form more complex structures, bringing up a whole branch of possibilities of novel materials. Due to the coupling between the plasmon modes of each individual particle, these ensembles of NMNPs are known to have optical properties that differ from those of individual nanoparticles and their corresponding bulk materialsRoss2016, Nie2009. Their optical properties can be additionally tuned by changing the particles distance and arrangement. The self-assembly of NMNPs is an attractive synthesis technique for close-packed ensembles of nanoparticles. The control over structural parameters has been greatly improved in the past yearsJulin2018, Schulz2017, Gong2017, Hanske2017, Klinkova2014, Grzelczak2010, Tao2008. For instance, Schulz et al. Schulz2017 were able to synthesize large films (hundreds of m2) of close-packed gold nanospheres with particle sizes of up to 46 nm and interparticle distances of 2 nm with a precision of 0.5 nm. Besides being a relatively low cost synthesis method in comparison to electron-beam lithography, it is very versatile, as many different molecules can be used as ligands to achieve various gap sizes and join together particles with a wide range of sizes. In addition, as those nanoparticle films extend over length scales far beyond the diffraction limit, optical measurements can be easily done on them without the need of complex experimental apparatusMueller2018, Mueller2018a.
The optical properties of close-packed ensembles of metallic nanoparticles has been subject in a number of theoretical works. Tao et al.Tao2008 considered polyhedral silver nanoparticles colloids of up to three layers and investigated their optical response in both low density and high density configurations. Alaeian et al.Alaeian2012 studied spherical and octahedral nanoparticles superlattices and showed that they behave as metamaterials with magnetic response. Our recent studies also provided some theoretical analysis on the self-assembly of NMNPs, but the focus was mostly on experimental measurements and potential applications of these materialsMueller2018, Mueller2018a. Furthermore, there is a number of theoretical studies on arrays of metal-insulator-metal particles (MIMs)Chang2012, Wang2017, Frederiksen2013, Verre2015, Cai2016. Although the MIMs are synthesized in a process different from the self-assembly, their optical response has similarities with the response of close-packed nanoparticle bilayers, which makes them great to compare with. Although the interest in NMNP layers increases and the development of self-assembly techniques improves at a rapid pace, there is still a lack of a systematic theoretical investigations on the role of geometrical parameters on the plasmonic properties.
In this paper, we provide a thorough theoretical framework about the plasmonic properties of layered structures of gold and silver nanoparticles. We will focus on the properties of mono- and bilayers, which are the fundamental building blocks for more complex layered structures. We predict that the monolayers have one plasmon mode, characterized by a non-zero net dipole moment (bright mode), and the bilayers enable the excitation of a bright mode and a second mode that has a vanishing dipole moment (dark mode). This dark mode is activated due to field retardation, that induces an anti-parallel dipole configuration between the layers. The plasmonic modes can be excited by illumination with a plane electromagnetic wave at normal incidence and the optical response is polarization insensitive. We provide a systematic study on the influence of the structural parameters, including particles size (diameter), their separation (gap) and particle arrangement. From the size analysis, we were able to predict the minimum diameter for which the dark mode is activated. By an analysis of the local nearfield enhancement, we demonstrate the potential of the nanoparticle layers for surface-enhanced spectroscopy.
This paper is organized as follows. We first introduce the details of the theoretical approach used throughout the paper (Sect. 2). In Sect. 3, we show the results for the monolayers with emphasis on the effect of particle separation and size. The simulations for the bilayers are presented in Sect. 4. We study the dependence of the plasmon modes on structural parameters, such as particles size, particle separation and layer stacking. Finally, we study the nearfield enhancement of the bilayers and offer conclusions (Sect. LABEL:sec:conc).
2 Methods
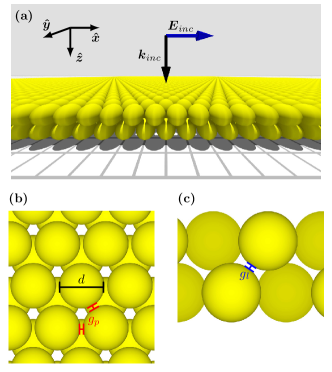
In this work, we consider mono- and bilayers of close-packed metallic nanospheres of equal size, as illustrated in Fig. 1. In all simulations, we considered vacuum as the surrounding medium () and a linearly polarized plane wave with propagation normal to the layers as the light source. The polarization direction was set as the direction, although any other polarization direction would lead to the same spectra because of the hexagonal symmetry of the nanoparticle lattice. Throughout the paper, we will use the following notation regarding the layers structural parameters: is the particles diameter, is the the edge-to-edge spacing (gap) between particles within one layer and is the gap between the layers [see Figs. 1(b) and (c)]. The variable without subscript is used when and have equal values and are simultaneously changed (). Regarding the spectral features of the plasmon modes, we will denote their excitation energy (peak position) as and their full width at half maximum (FWHM) as .
All simulations were performed with Lumerical FDTD Solutions, a commercial software package. The monolayers were considered as two-dimensional crystal lattices and simulated by defining a square unit cell and using periodic boundary conditions. The bilayers were implemented by adding more NPs to the unit cell such that the NPs arrangement determines the layers stacking (align and hcp). Mesh-override regions of 0.25 nm were used for systems with particle diameters below 15 nm and gap sizes below 3 nm while, for larger diameters and gaps, an override mesh size of 1 nm was used. Two power monitors were included; one behind the layers to capture the transmittance , and another one behind the source for the calculation of the reflectance . The absorbance was later computed as . A plane-wave source was used for the layers simulations while a total-field scattered-field source was used to calculate the cross-section (CS) of nanoparticle dimers. The gold and silver dielectric functions were implemented by fitting the experimental data provided by Johnson and ChristyJohnson1972 and by PalikPalikBook1985, respectively. Convergence tests were performed by varying the mesh sizes in order to assure the accuracy of the simulation results. The polarization density was calculated from the simulation data for the electrical current density by using the relation and assuming a harmonic time dependence. The spatial average over the unit cell region of each layer () was then computed in order to observe just the mean behavior of the polarization.
3 Nanoparticle Monolayer
We start our investigation by analyzing the simplest case, i.e., a monolayer of hexagonally packed metallic nanospheres. Figure 2 shows the absorbance and reflectance spectra of a single layer of gold nanospheres with nm. Its optical response is polarization insensitive as the monolayers have a hexagonal symmetry (Point Group ) Jorio2017. The distinct curves in each panel indicate the influence of the gap between the particles (). A plasmon mode is excited around 2.35 eV in all the cases and increases in intensity as decreases. This mode corresponds to the dipole-active mode in which all nanoparticles have parallel dipole moments of similar magnitude (see inset of Fig. 2). The absorbance spectrum is dominant over reflectance, because small spheres are poor scatterers of light as they do not have a large amount of material to prevent light from being transmitted. There is a slight redshift that stems from the increased coupling between the particles as is reduced. Similar shifts has been observed previously in the optical response of nanosphere colloidsLiz-Marzan2006 and metallic nanoparticle oligomers, such as spherical and elliptical dimersRoss2016, Halas2011, Lassiter2008, LeRuInBook2009, Ghosh2007, Romero2006, Zhong2004, Su2003, Jensen1999, nanorod dimers and bowtie antennasPeyskens2015.
To get a deeper understanding of the spectra of the nanoparticle monolayers, we draw a comparison to the simple case of a dimer of spheres illuminated from the top. Figure 3 exhibits the absorption and scattering cross-sections (CS) of a dimer of particles with nm (same as in Fig. 2). Simulations for light polarization along and perpendicular to the dimer axis are presented in order to account for the different angles between the incident light polarization and each of the particle pairs in the layer. As expected, there is a redshift with decreasing for light polarization along the dimer axis, Fig. 3(a), and a blueshift for perpendicular polarization, Fig. 3(b). The shifts are overall small due to the small size of the nanoparticlesRoss2016, Halas2011, LeRuInBook2009, Ghosh2007, Jensen1999. For better visualization, the zoomed spectral range of the scattering CS spectra are shown as insets in Figs. 3(a) and (b). The parallel polarization causes a binding plasmon mode in the structure, i.e., the induced dipole configuration makes the particles to have an attractive interaction, see inset in Fig. 3(c). On the other hand, the perpendicular polarization excites an anti-binding mode (repulsive interaction between the particles), as in the inset of Fig. 3(d). As is reduced, the binding (anti-binding) coupling increases, which causes the mode to shift towards lower (higher) energies, i.e., a redshift (blueshift). The dipoles of binding mode are oriented parallel to the dimer axis while the dipoles of the anti-binding mode are perpendicular to it. This orientation difference indicates that the binding coupling is more intense than the anti-binding coupling, an effect that is similar to the observed difference in coupling strength for and bonds in molecules. It is expected then that the binding mode is subjected to a redshift that is larger in magnitude than the blueshift of the anti-binding mode.
Back to the monolayer of nanoparticles, there are pairs of particles with a dipole configuration similar to each of the dimer modes shown in Fig. 3 (binding and anti-binding modes) while others have a dipole configuration that is a combination of these two modes depending on their orientation (a more detailed description of this coupling will be given further on). Therefore, the fact that the monolayer absorbance shows a redshift with decreasing similarly to exciting the dimer with polarization along its axis means that the overall binding contribution of the particles affects the energy stronger than the total anti-binding contribution. The behavior was also observed for silver nanoparticle monolayers (see Fig. S1 in the Supporting Information).
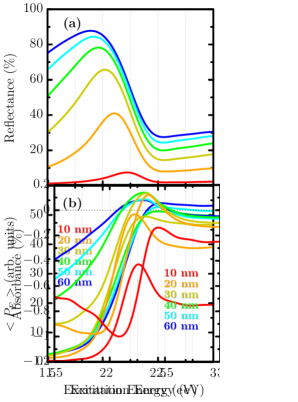
Let us now evaluate how the particles diameter affects the optical properties. In Fig. 4 the absorbance and reflectance spectra are displayed for various using a gap size nm. The plasmon mode observed in Fig. 2 is also excited in larger spheres. As increases, an absorbance tail above 2.25 eV rises and overlaps the plasmonic peak. This behavior stems from the increase of the interband transitions of gold, caused by the increasing amount of material, in the case of the larger spheres. As LSPRs are surface effects and the interband transitions are related to the NP volumePinchuk2004, MaierBook2007, the damping of the plasmon mode is indeed expected due to the decrease of the NPs surface-to-volume ratio with increasing . The volume increase is also responsible for the overall enhancement in the reflectance spectra that goes from less than 10% for nm to a peak of almost 90% for nm, see Fig. 4(a). For the absorbance in Fig. 4(b) we note that the spectrum at nm is slightly out of the trend with respect to the larger diameters, indicating that the plasmon mode is still not completely damped away by the interband transitions for 20 nm diameter particles.
4 Nanoparticle Bilayer
Figure 5(a) shows the absorbance and reflectance for a gold bilayer of nanospheres with nm and nm. A prominent absorbance peak emerges at eV together with a reflectance dip at 1.79 eV. The peak has a FWHM of meV. The dipole-active plasmonic mode () observed for the monolayer structures is no longer visible in Fig. 5(a). In the bilayers, the interband transitions of gold are further increased in comparison to the monolayers due to their larger amount of gold, similarly to the effect observed for the monolayers with larger NPs. Therefore, the dipole-active mode is completely damped. A very similar optical response was found for bilayers of silver nanoparticles with an absorbance peak at eV and a reflectance dip at 1.93 eV. The plasmon mode is observed as an absorbance peak and a reflectance dip around eV. This peak is expected because the interband transitions of silver occur at energies larger than eVPinchuk2004, which means that less damping should occur to this plasmonic mode in silver in comparison to gold. Regarding the modes linewidth, the peak at has a FWHM of meV, whereas the peak at has meV, i.e., it is almost four times narrower (see Fig. S3 in the Supporting Information).
To identify the plasmon modes that are being excited, we investigate the charge distribution in the nanoparticles of each layer. We calculate the mean polarization density of each layer as a function of the excitation energy (Figs. 5c and d). A peak in both layers is observed at , but the sign of is opposite in the two layers. This indicates that the associated absorbance peak and reflectance dip are due to the excitation of a plasmon mode with anti-parallel dipole moments between the two layers. The net dipole moment of the bilayer vanishes, which means that this is a dark plasmon modeMueller2018, Chu2009. Dark plasmons have become more relevant in the last years since they exhibit little or no radiative damping and, consequently, longer lifetimes and narrower resonances compared to bright plasmonsZhang2016, Yanai2014, Sancho-Parramon2012, Chang2012. This expectation agrees nicely with the remarkable difference between and in the bilayers.
Dark plasmons normally do not interact with far-field radiation. However, various approaches have been proposed (and partly demonstrated) for their excitation, such as breaking the symmetry of a system to turn the dark plasmon slightly brightHumphrey2016, Panaro2014, Chuntonov2011, Chu2009, using light sources with spatial polarization profiles Sakai2015, Yanai2014, Gomez2013, Sancho-Parramon2012 and using localized emitters to excite the dark plasmons through evanescent fields Peyskens2015, Liu2009. Dark plasmons can also be observed indirectly through their interaction with a bright mode, which generates asymmetric line shapes called Fano resonancesLuk'yanchuk2010, Zhou2011. In our case, the dark plasmon excitation is explained by field retardation. Although the particles ( nm) are approximately a tenth of the wavelength of the incident light ( for gold), the bilayer is more than 100 nm thick and the quasi-static approximation is no longer valid. At specific times, the incident electric field points in opposite directions in the two layers, inducing anti-parallel dipole moments in the top and bottom layer. Also the activation of the dark mode is facilitated by the large refractive index of the nanoparticle layers which shrinks the internal wavelength of light inside the metafilmKim2018. Similar dark plasmons were previously observed in studies for metal-insulator-metal (MIM) nanodisks, in which the same retardation effects take place Wang2017, Chang2012, Frederiksen2013, Verre2015, Zhang2015, Cai2016, Pakizeh2006. Moreover, Mueller et al. were able to probe by microabsorbance measurements that such plasmons can indeed be excited in bilayers of colloidal nanoparticlesMueller2018. We stress also that, due to the rotational symmetry of the lattice, this dark plasmon can be excited with any linearly polarized light.
The dark mode is observed in both bilayers of gold, Fig. 5(a), and silver nanoparticles, Fig. 5(b). The dark plasmon in silver nanoparticle layers occurs at larger energies than for gold and should even remain in the visible range when the nanoparticles are embedded in a surrounding medium with larger refractive index. For silver, the bright mode at can also be studied. Although there is no corresponding peak in the polarization at this energy region, has the same sign in both layers, indicating that this mode is bright with the net dipole of each layer pointing in the same direction. It is worth emphasizing that the possibility of activating a dark mode with linearly polarized light makes it much easier to use such dark excitations for applications such as SERS.
4.1 Diameter Dependence
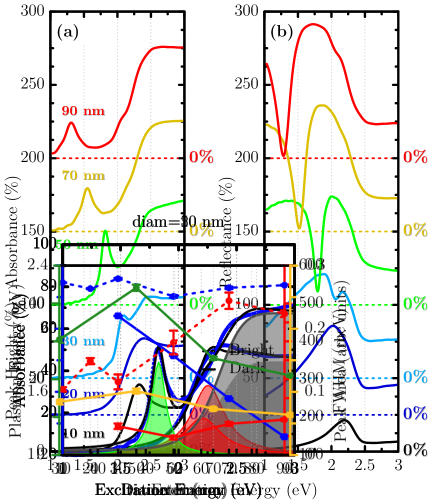
In the following, we will evaluate the influence of the structural parameters on the plasmon resonances of the bilayers, beginning with particles sizes. In Fig. 6 the absorbance and reflectance spectra for bilayer systems with different are presented. The mode is excited for particles with nm. For nm, the retardation effect is weaker and the system gets closer to the quasi-static limit, making it more difficult to excite . We note a redshift in with increasing , which stems from the fact that the amount of material per unit volume increases, making the coupling between both layers stronger. The anti-parallel dipole configuration of corresponds to a binding configuration. Therefore, stronger coupling decreases the mode energy, i.e., a redshift. Similar shifts were observed in MIM nanodisk arrays when changing disk size Wang2017, Chang2012. There is also a slight increase in , which stems from the increase in radiative damping. However, the peak integrated area is not significantly affected by the peak broadening, since a proportional decrease in the peaks height is also observed (see Fig. S4 of the Supporting Information). The bright mode is well pronounced for particles with nm but gets damped by the interband transitions for nm. The results for silver are shown in Fig. S5 of the Supporting Information. Similarly to gold, also goes towards smaller energies when increases. The mode shows a weak redshift for larger and an increase in absorbance intensity. In addition, as the interband transitions get far away on the energy scale, higher-order modes, such as quadrupoles and hexapoles, are also excited for nm.
To provide a relation between and the plasmon energy and lifetime, the absorbance spectra were fitted by
| (1) |
where is the excitation energy, is the number of plasmon modes, is the intensity, is the spectral position and is the FWHM of the j-th plasmon mode. For gold, is the characteristic absorbance of a gold thin filmLodenquai1991, Kovalenko1999, in which we considered the dielectric function of gold calculated by the Lorentz-Drude modelLeRuInBook2009-2, while for silver, is a step-like (sigmoid) function that mimics the absorbance spectrum of a silver thin film. is included in order to take the interband transitions into account in the fittings and is the fitting parameter that accounts for the intensity of these transitions in the material.
In Fig. 7, we plot the peak positions and widths of the spectra in Fig. 6(a) as a function of particle diameter. As for nm only the bright mode is present in the spectra, there are no results for the dark mode at this range of diameters. As already mentioned, shifts to smaller energies with increasing , full blue line in Fig. 7. It follows an approximately linear behavior with 13 meV/nm. Mode , in contrast, remains constant in energy. The small apparent oscillations of the bright mode position may be due to the interference with the interband transitions, since they entirely overlap (see Fig. S3 of the Supporting Information), making it hard to capture the real behavior of the mode. The FWHM is approximately constant for mode with a small increase for nm (full red line in Fig. 7), while mode becomes broader for larger spheres because radiative damping scales with sphere volume (dashed red line).
4.2 Influence of Lattice and Stacking
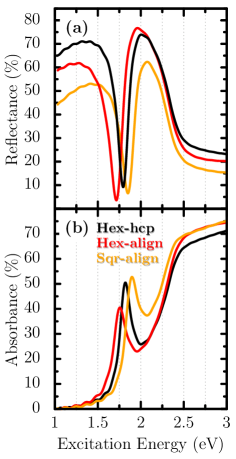
We now investigate the effect of the lattice and the stacking of the layers on the plasmonic properties of the bilayers. Figure 8 presents the optical response for bilayers with three different particle arrangements: layers formed by a hexagonal lattice with a hexagonal close-packed stacking (Hex-hcp) and with the particles aligned along (Hex-align) and layers formed by a square lattice with aligned stacking (Sqr-align). The main features of the spectra are present in all three configurations. is redshifted by 64 meV for Hex-align and blueshifted by 82 meV for Sqr-align with respect to Hex-hcp. This can be understood from the inset of Fig. 5(d). In the Hex-hcp stacking, the positive (negative) charges in the particle are closer to each other than in Hex-align, which causes a larger repulsion and blueshift. The blueshift for Sqr-align stacking stems from the lower particle density in this configuration compared to Hex-align. The smaller density results in less coupling and the plasmon energy has a smaller redshift than in the Hex-align configuration. The reduced coupling induced from the in-plane lattice configuration has a stronger effect than the layers stacking, as the blueshift in the Sqr-align configuration (compared to the Hex-align) is larger than the blueshift for Hex-hcp.
4.3 Gap Dependence
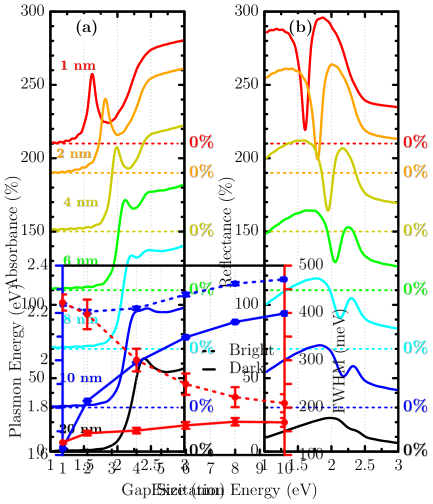
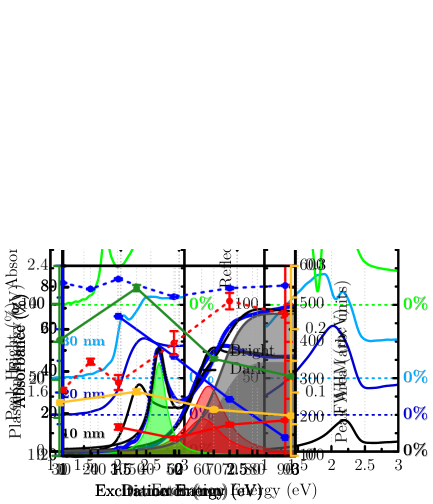
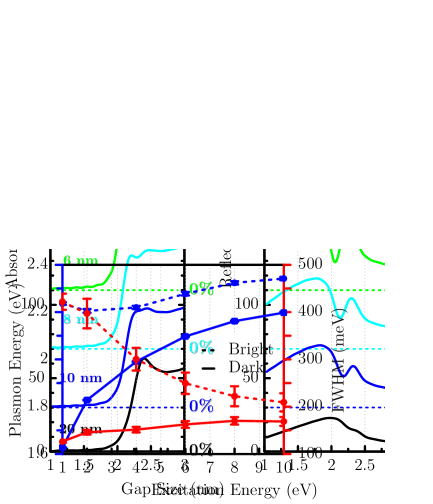
We now turn our attention to the influence of the gap size () on the optical properties. In Fig. 9 the absorbance and reflectance spectra for systems with varying are shown. The dark mode starts to be effectively activated for nm. As is further reduced, shifts towards smaller energies due to stronger coupling. The bright mode shows a similar behavior with shrinking as that observed for increasing , i.e., it becomes completely suppressed by the interband transitions. Similar calculations for silver (Fig. S6 of the Supporting Information) show qualitatively the same effect. Remarkably, even for nm, the modes and of silver can still be distinguished, which does not occur for gold. By fitting the calculated spectra similar to the diameter analysis, the strong redshift of with decreasing becomes apparent. Figure 10 shows that (full blue line) goes from 2.2 to 1.6 eV when changes from 10 to 1 nm. (full red line) is reduced when decreases while (dashed red line) increases. These results reveal that the energy of can be tuned over a broad spectral range in the visible/near-infrared by changing the gap size. Colloidal samples in which spreads over many values are expected to show modes with broader FWHM than that of perfect NP crystals (simulated layers) as indeed observed experimentallyMueller2018.
We now investigate the influence of and separately. We consider hexagonal bilayers with aligned stacking (Hex-align), as and are linearly independent in this structure. Figure 11 shows that changes in the intralayer gap affect the optical properties in a similar fashion as when varying both gaps simultaneously. A strong redshift of is verified when is reduced, which indicates that this mode is highly sensitive to it. Also, for nm, this mode enters the interband transitions region and can no longer be identified.
Regarding the interlayer gap dependence, Fig. 12 shows already in the near-infrared ( eV) for nm and that it blueshifts with decreasing . Note that the range in which is varied ( nm) is much larger than that used for ( nm), as, otherwise, no change would be observed. This fact suggests a low sensitivity of on , in contrast to the high sensitivity on . This difference is explained by verifying that, for each nanoparticle and at any given distance, there are always more neighbors from the same layer (related to ) than from the other layer (related to ). For example, for the Hex-align configuration, each nanoparticle has six first neighbors within the same layer while there is just one from the other layer. Regardless of the magnitude of this effect, it appears surprising to observe a blueshift when decreases considering the dipole hybridization model. One might expect the inverse in layer-layer coupling and a redshift with decreasing .