Exploring a new definition of the green valley and its implications
Abstract
The distribution of galaxies on a colour-magnitude diagram reveals a bimodality, featuring a passively evolving red sequence and a star-forming blue cloud. The region between these two, the Green Valley (GV), represents a fundamental transition where quenching processes operate. We exploit an alternative definition of the GV using the 4,000 Å break strength, an indicator that is more resilient than colour to dust attenuation. We compare and contrast our GV definition with the traditional one, based on dust-corrected colour, making use of data from the Sloan Digital Sky Survey. Our GV selection – that does not need a dust correction and thus does not carry the inherent systematics – reveals very similar trends regarding nebular activity (star formation, AGN, quiescence) to the standard dust-corrected . By use of high SNR stacked spectra of the quiescent GV subsample, we derive the simple stellar population (SSP) age difference across the GV, a rough proxy of the quenching timescale (t). We obtain an increasing trend with velocity dispersion (), from t1.5 Gyr at =100 km s-1, up to 3.5 Gyr at =200 km s-1, followed by a rapid decrease in the most massive GV galaxies (t1 Gyr at =250 km s-1), suggesting two different modes of quenching, or the presence of an additional channel (rejuvenation).
keywords:
galaxies: evolution – galaxies: formation – galaxies: interactions – galaxies: stellar content.¡
1 Introduction
Broadband photometry is widely used to assess the properties of the underlying stellar populations of galaxies. Among the many diagnostic diagrams adopted to study galaxy evolution are the colour-magnitude, or colour-mass, diagram (e.g., Martin et al., 2007, hereafter M07), and the UVJ bi-colour plots (e.g., Whitaker et al., 2011). These diagrams allow us to separate galaxies with respect to the stellar age distribution. However, a colour-based selection requires correcting for dust attenuation, possibly introducing a model-dependent systematic, especially as the attenuation law is found to vary widely among galaxies (e.g., Kriek & Conroy 2013, Narayanan et al. 2018; Tress et al. 2018). An alternative approach would ideally involve the use of age-sensitive indicators that are not so severely affected by dust, suggesting the use of spectral features that could be measured on relativelly low S/N spectra.
The distribution of galaxies on a colour vs magnitude (or vs stellar mass) diagram reveals a conspicuous bimodality (Strateva et al., 2001; Baldry et al., 2004; Bell et al., 2004; Mateus et al., 2006), featuring a Red Sequence (RS), mostly dominated by old and passive galaxies, and a Blue Cloud (BC), made of star-forming galaxies. The area separating these two populations, termed the Green Valley (GV), represents a transition region where star formation is quenched (Menci et al., 2005; Faber et al., 2007; Schawinski et al., 2007; Gonçalves et al., 2012; Salim, 2014). However, the interpretation of GV galaxies and the process of quenching remains one of the key open questions of galaxy evolution (Schawinski et al., 2014; Taylor et al., 2015; Bremer et al., 2018; Eales et al., 2018).
2 Sample
We make use of a large set of high quality spectra from the Sloan Digital Sky Survey (SDSS) to define the GV using the standard Dn(4000) feature (Balogh et al., 1999) that quantifies the 4,000Å break strength. This selection is compared with the standard (colour-based) definition of the GV. We select from the SDSS Data Release 14 all individual galaxy spectra (Abolfathi et al., 2018) with a median S/N in the SDSS band above 10, within the redshift interval 0.05z0.10. The original data set comprises 228,880 spectra. We choose the stellar velocity dispersion as the main stacking parameter, instead of the standard choice of either the total luminosity or the stellar mass of the galaxy. The velocity dispersion () is found to correlate more strongly with the underlying population properties (see, e.g., Bernardi et al., 2003; Thomas et al., 2005), and is less prone to potential systematics, as it is measured in a straightforward way from the absorption line spectra. The velocity dispersion can be mapped onto stellar mass () by use of , with the uncertainties quoted at the 68% level. Note also that the velocity dispersion of the spheroidal component correlates well with black hole mass, more strongly than does stellar mass (Gültekin et al., 2009). This will enable us to refine AGN fractions in the GV. The sample is divided into six velocity dispersion bins between =70 and 250 km s-1 in steps of =30 km s-1. We note that with the adopted range of , along with the constraint on the S/N of the spectra, the estimates of velocity dispersion provided by the SDSS SpecObj catalogue are reliable111http://classic.sdss.org/dr7/algorithms/veldisp.html.
3 Defining the Green Valley
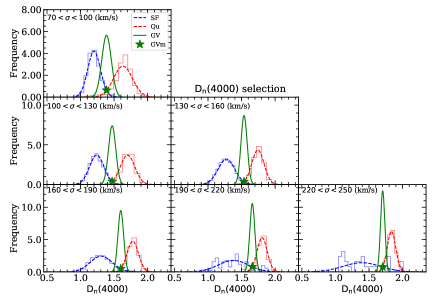
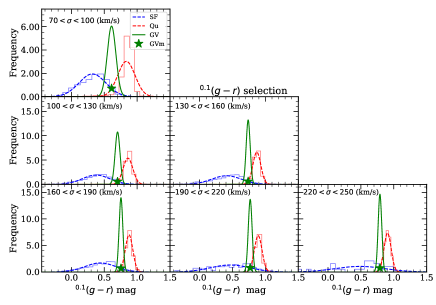
We base our definition of the GV on the relative distribution of the star-forming (SF) and quiescent (Q) subsamples. We make use of the MPA-JHU SDSS catalogues (Kauffmann et al., 2003; Brinchmann et al., 2004) that provide a classification of the galaxy spectra from nebular emission lines into star-forming, AGN, mixed, or quiescent (with the latter class meaning no emission lines are present). We follow a probability-based approach, defining a probability distribution function (PDF) for the BC, , and a PDF for the RS, . These functions are assumed to depend on two parameters only, the stellar velocity dispersion () and an additional parameter () that serves as a proxy of the stellar age of the underlying populations. We will compare here two choices, the dust-corrected colour – defined by () as observed at a fiducial redshift z=0.1 – and the dust uncorrected strength of the 4,000Å break. We adopted the dust correction values from Kauffmann et al. (2003), using the Calzetti et al. (2000) attenuation law, thus enabling a fair comparison to the analysis of M07. Note we use , instead of as baseline for the correction, where we find, at z=0.1, and . For each choice of the second parameter, , we define the GV as the region where , at fixed velocity dispersion. More specifically, within a velocity dispersion bin, we use the number of observed spectra of star-forming and quiescent galaxies to define the PDFs of the BC and RS, respectively, fitting them to a Gaussian distribution. The PDF of the GV is then defined as another Gaussian with mean given by the value of at which , and standard deviation given by one half of that corresponding to the PDF of the quiescent subsample.
Figure 1 illustrates the definition of the GV for the choice of =Dn(4000) (left panels), or (dust corrected, right panels), as the population parameter. Both cases show the well-known trend towards higher break strengths or redder colours as velocity dispersion increases. The mean position of the GV is represented by a star symbol. Note the significant difference between the choice of break strength and colour regarding the overlap of the SF and Q subsets. A colour-based approach produces more mixed subsamples that complicates the selection of GV galaxies, whereas the 4,000Å break strength produces a sharper separation222Colours such as or produce very similar results to , however we chose the latter as the observations have markedly lower uncertainties.. Note, Dn(4000) provides an alternative, clean separation between BC, GV and RS without requiring any dust correction. Therefore, Dn(4000) carries a lower systematic uncertainty from the modelling associated to these corrections. This alternative definition of the GV requires low SNR spectroscopic data, as the 4000 Å break is relatively wide and can be measured even at low spectral resolution (e.g., Hathi et al., 2009; Hernán-Caballero et al., 2013). Our proposed selection of GV galaxies is timely with future spectroscopic surveys on the horizon such as WAVES (Driver et al., 2019), WEAVE (Dalton, 2016), DESI (DESI Collaboration et al., 2016), MSE (McConnachie et al., 2016) or J-PAS (Benitez et al., 2014).
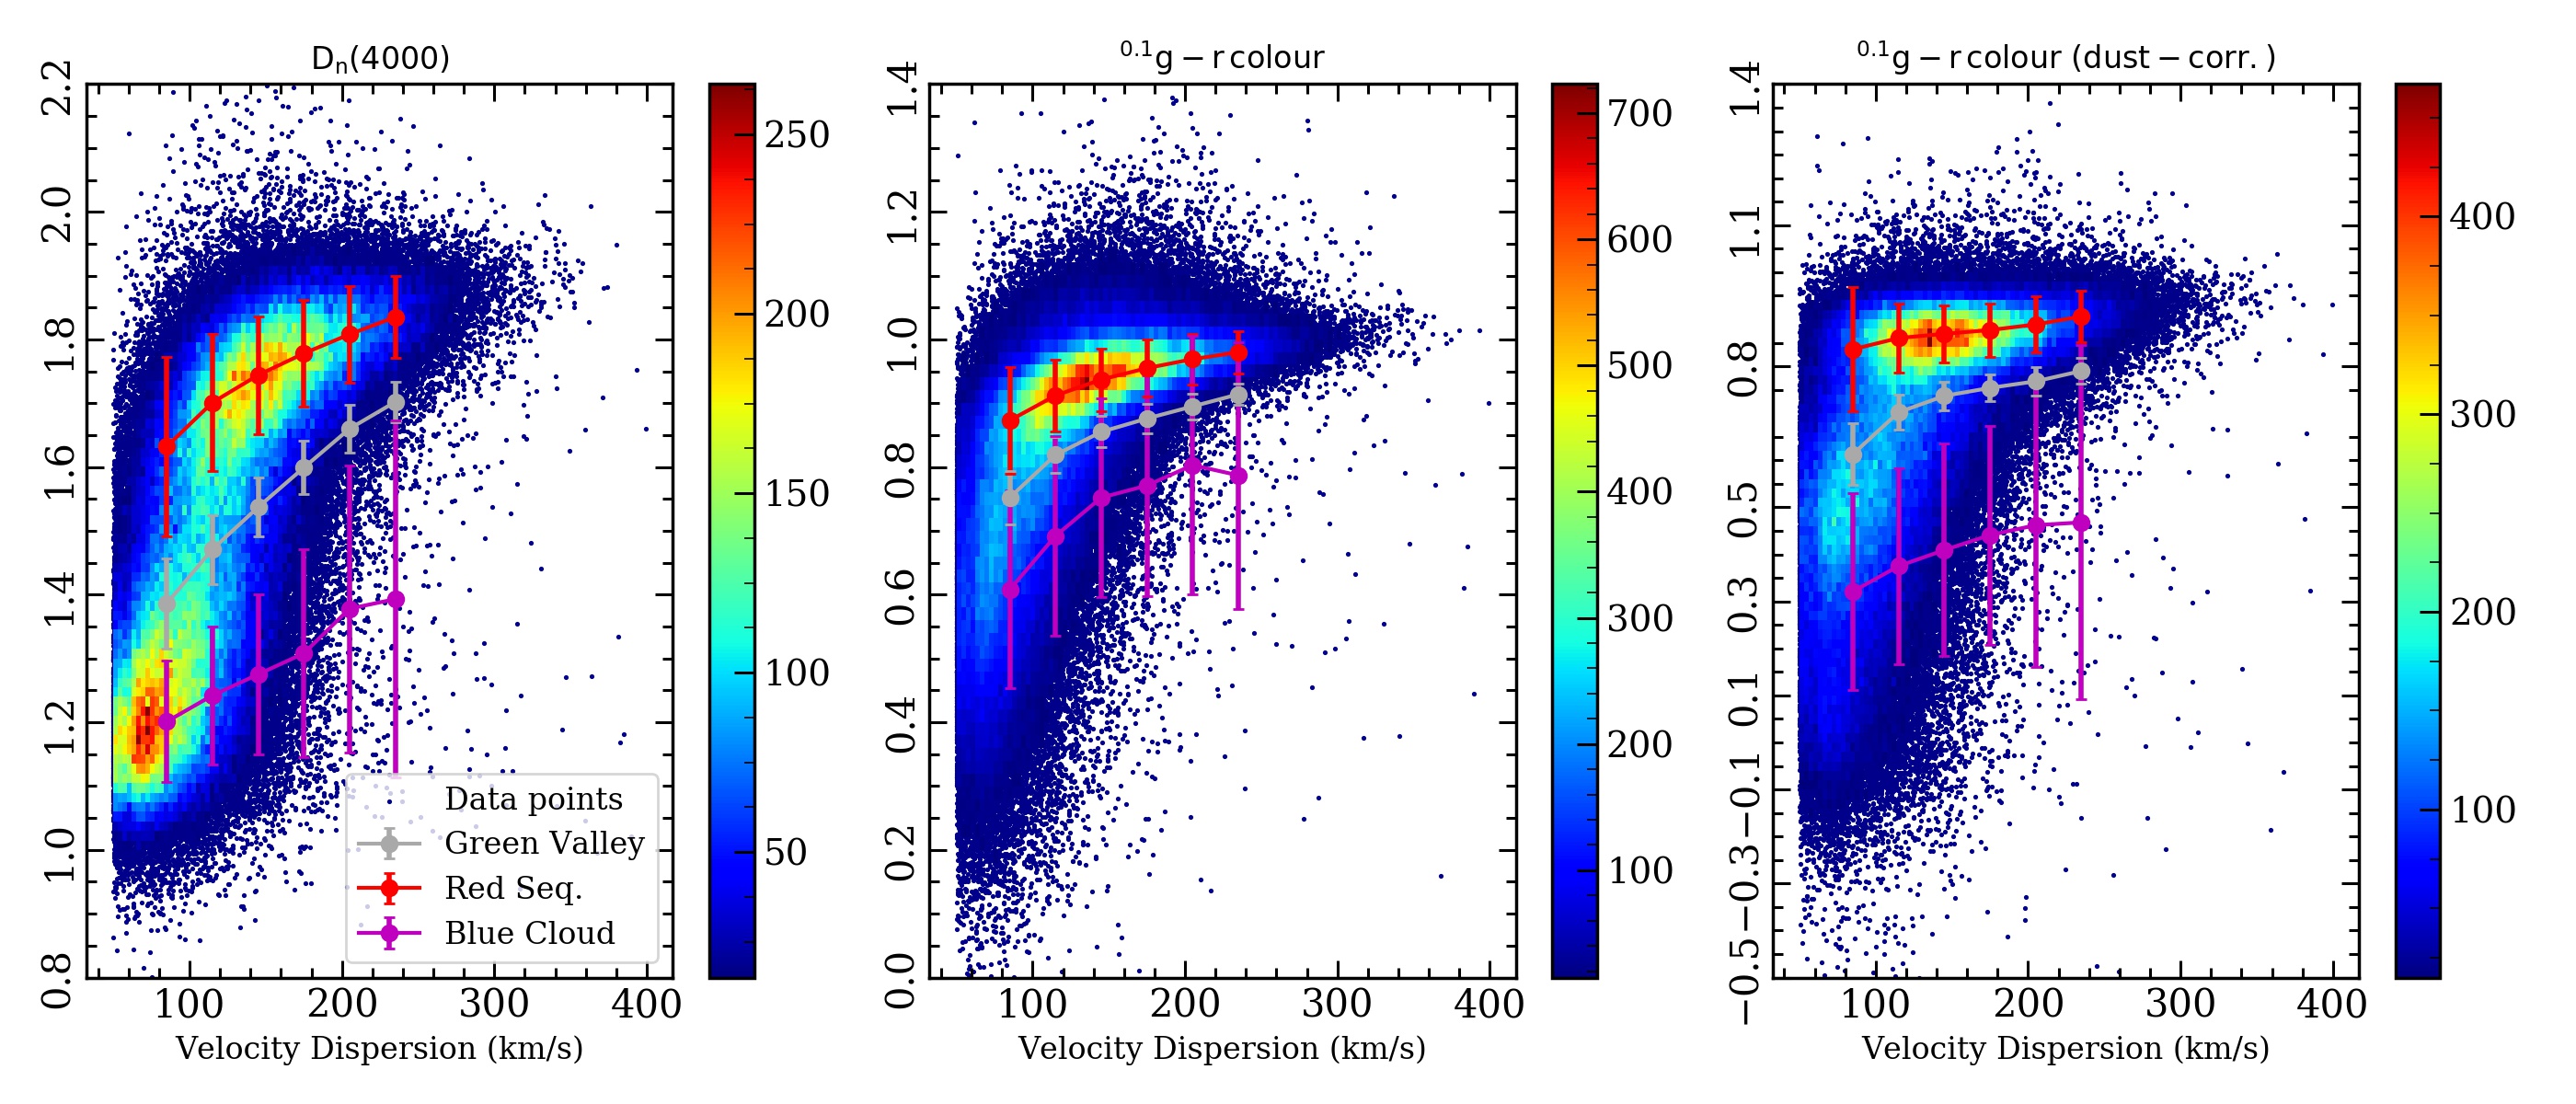
Figure 2 shows the location of the three key evolutionary regions following this methodology, according to Dn(4000) (left panel), (uncorrected, centre panel, shown for reference), or (dust-corrected, right panel). The points with error bars show the mean and standard deviation of each subsample. For reference, individual data points are shown as a density plot. Note the impact on the GV definition between the colour distribution before and after the dust correction is applied. Comparatively, the equivalent dust correction for Dn(4000) is smaller, resulting in a minor shift of mean in the definition of the RS, BC and GV subsets, with a maximum Dn(4000) 0.06 dex. Thus, the 4,000Å break strength produces a clean representation, even without dust correction, of the three phases of evolution under study.
Once the GV is defined, we further separate it into terciles. The lower tercile represents galaxies closer to the BC, and is hereafter defined as the lower Green Valley (lGV). The upper tercile is closer to the RS and is termed the upper Green Valley (uGV). If we interpret the GV as a transition region where galaxies quench their star formation, we can portray the lGV and uGV as the starting and ending stages of this transition, respectively.
4 Looking into the Green Valley
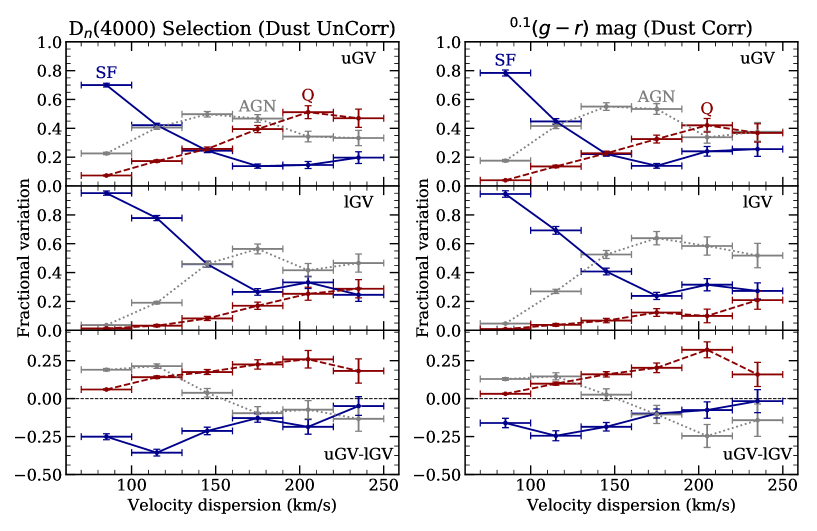
Figure 3 shows the fraction of star-forming, quiescent and AGN galaxies as a function of velocity dispersion, on the upper and lower GV, contrasting the difference between a selection based on break strength (left), or dust-corrected colour (right). Both methods give the expected decreasing (increasing) trend of star-forming (quiescent) galaxies towards increasing velocity dispersion, reflecting the effect of downsizing. At the massive end (=200-250 km s-1), the fraction of AGN in the uGV (lGV) is 305% (507%) according to the Dn(4000) definition, comparable to the equivalent fractions from the dust-corrected colour selection, namely 376% (518%). Our estimate of the fractional contribution of AGN is compatible with the analysis of M07 (see Martin et al., 2007, Fig. 20), further supporting the idea that the 4,000Å break strength can be accurately used to define the GV without the need for dust correction. Moreover, looking at the distribtuion of the 4,000Å break strength of M07 in their transition region (see Martin et al., 2007, Fig. 3), the index range is fully compatible with our definition of the GV.
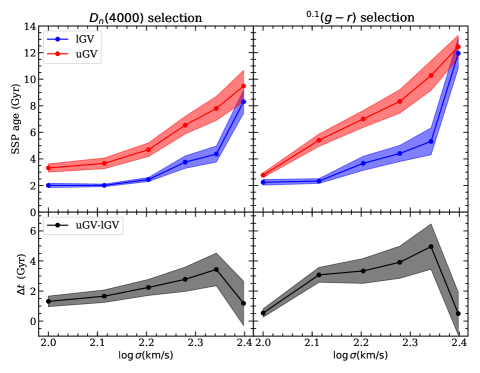
If we view the GV as a transition region where galaxies evolve from a star-forming state into a passive phase, we can compare the stellar age difference, derived from stellar spectra, to produce an estimate of the timescale expected to traverse this region. This is a highly non-trivial issue as GV galaxies constitute a motley distribution of systems, and the presence of star formation will bias the estimates of stellar age, as all photo-spectroscopic indicators are inherently luminosity-weighted, thus heavily biased towards the younger stellar components. The analysis of star-forming systems typically produce a complex and extended star formation history. Note we have avoided AGN galaxies in the definition and analysis of the GV, as prominent AGN will significantly affect the spectral continuum of the underlying stellar populations, compromising the interpretation of the Dn(4000) index as a stellar age-sensitive indicator. Therefore, at the zeroth order, we focus on the subsample of quiescent galaxies in the upper and lower portions of the GV. The difference in stellar age of the quiescent galaxies serves as a proxy of the time galaxies spend on the GV. We now resort to stacking all the quiescent spectra from SDSS, following standard procedures (see, e.g. Ferreras et al., 2013). Within a given bin of velocity dispersion, we create one stack in the upper GV and another one in the lower GV. The resulting spectra – mostly featuring S/N above 100 per Å in the regions of interest – are analysed by measuring a set of age- and metallicity-sensitive spectral indices: H, Mgb and Fe(Fe5270+Fe5335)/2 (Trager et al., 1998); H and H (Worthey & Ottaviani, 1997); [MgFe]′ (Thomas et al., 2003) and the 4,000Å break strength (Balogh et al., 1999). We include a correction for nebular emission in the Balmer lines, following the methodology laid out in appendix B of La Barbera et al. (2013). The observed line strengths are compared with synthetic stellar population models (Vazdekis et al., 2012), producing SSP-equivalent ages (more details will be provided in a follow-up paper to be published in the main journal). The top panels of Figure 4 show the SSP-equivalent ages of uGV and lGV galaxies with respect to , and the bottom panels plot the age difference between these two regions (), that can be interpreted as a effective quenching timescale. We emphasize that these differences concern GV galaxies spectroscopically classified as quiescent. The well-known mass-age trend is readily apparent, with more massive galaxies (higher ) featuring older ages (Gallazzi et al., 2005). It is worth noticing that both the colour and break strength selection produce very similar trends. However at the highest values of velocity dispersion (190 km s-1) the dust-corrected colour selection seems to provide, as absolute SSP ages, older galaxies.
A clearer visualization of this putative GV “traversing time” can be provided by the difference between SSP ages between the uGV and the lGV. The data feature a trend of increasing t with velocity dispersion, implying the GV transit times in more massive galaxies become longer, from t1.5 Gyr at =100 km s-1 to 3.5 Gyr at =200 km s-1. These values are roughly in line with recent estimates of observed and modelled GV galaxies (Smethurst et al., 2015; Wright et al., 2018; Rowlands et al., 2018), and our analysis suggests a clear trend with respect to velocity dispersion.
Intriguingly, the figure suggests a mass scale – corresponding to the highest velocity dispersion of the stacks – above which the age difference t decreases, towards GV transition times around 1 Gyr at =250 km s-1. These trends can also be found in M07, where a high fraction of AGN with high luminosity is suggestive of short quenching timescales. In line with M07, we also see a slower quenching regime at lower velocity dispersion (200 km/s). Such behaviour can be interpreted as two different modes of quenching on either side of this mass scale (if we assume that the transition always proceeds from BC to RS), or the presence of a substantial amount of rejuvenation in higher mass galaxies. Rejuvenation might be due to positive feedback from AGN. This is expected to play a role in early gas-rich phases of massive galaxies, where AGN outflows and precessing jets are likely to overpressurise interstellar gas clouds and induce star formation as in Cen A (Crockett et al., 2012; McKinley et al., 2018; Keel et al., 2019). The simple, clear-cut definition of GV galaxies presented in this letter provides strong constraints on numerical models of galaxy formation (Gabor et al., 2011; Schaye et al., 2015; Dubois et al., 2016; Springel et al., 2018).
References
- Abolfathi et al. (2018) Abolfathi B., et al., 2018, ApJS, 235, 42
- Baldry et al. (2004) Baldry I. K., Glazebrook K., Brinkmann J., Ivezić Ž., Lupton R. H., Nichol R. C., Szalay A. S., 2004, ApJ, 600, 681
- Baldwin et al. (1981) Baldwin J. A., Phillips M. M., Terlevich R., 1981, Publications of the Astronomical Society of the Pacific, 93, 5
- Balogh et al. (1999) Balogh M. L., Morris S. L., Yee H. K. C., Carlberg R. G., Ellingson E., 1999, ApJ, 527, 54
- Bell et al. (2004) Bell E. F., et al., 2004, ApJ, 608, 752
- Benitez et al. (2014) Benitez N., et al., 2014, arXiv e-prints, p. arXiv:1403.5237
- Bernardi et al. (2003) Bernardi M., et al., 2003, AJ, 125, 1882
- Bremer et al. (2018) Bremer M. N., et al., 2018, MNRAS, 476, 12
- Brinchmann et al. (2004) Brinchmann J., Charlot S., White S. D. M., Tremonti C., Kauffmann G., Heckman T., Brinkmann J., 2004, MNRAS, 351, 1151
- Calzetti et al. (2000) Calzetti D., Armus L., Bohlin R. C., Kinney A. L., Koornneef J., Storchi-Bergmann T., 2000, ApJ, 533, 682
- Crockett et al. (2012) Crockett R. M., et al., 2012, MNRAS, 421, 1603
- DESI Collaboration et al. (2016) DESI Collaboration et al., 2016, arXiv e-prints, p. arXiv:1611.00036
- Dalton (2016) Dalton G., 2016, in Skillen I., Balcells M., Trager S., eds, ASP Conference Series Vol. 507, Multi-Object Spectroscopy in the Next Decade. p. 97
- Driver et al. (2019) Driver S. P., et al., 2019, The Messenger, 175, 46
- Dubois et al. (2016) Dubois Y., Peirani S., Pichon C., Devriendt J., Gavazzi R., Welker C., Volonteri M., 2016, MNRAS, 463, 3948
- Eales et al. (2018) Eales S. A., et al., 2018, MNRAS, 481, 1183
- Faber et al. (2007) Faber S. M., et al., 2007, ApJ, 665, 265
- Ferreras et al. (2013) Ferreras I., La Barbera F., de la Rosa I. G., Vazdekis A., de Carvalho R. R., Falcón-Barroso J., Ricciardelli E., 2013, MNRAS, 429, L15
- Gabor et al. (2011) Gabor J. M., Davé R., Oppenheimer B. D., Finlator K., 2011, MNRAS, 417, 2676
- Gallazzi et al. (2005) Gallazzi A., Charlot S., Brinchmann J., White S. D. M., Tremonti C. A., 2005, MNRAS, 362, 41
- Gonçalves et al. (2012) Gonçalves T. S., Martin D. C., Menéndez-Delmestre K., Wyder T. K., Koekemoer A., 2012, ApJ, 759, 67
- Gültekin et al. (2009) Gültekin K., et al., 2009, ApJ, 698, 198
- Hathi et al. (2009) Hathi N. P., Ferreras I., Pasquali A., Malhotra S., Rhoads J. E., Pirzkal N., Windhorst R. A., Xu C., 2009, ApJ, 690, 1866
- Hernán-Caballero et al. (2013) Hernán-Caballero A., et al., 2013, MNRAS, 434, 2136
- Kauffmann et al. (2003) Kauffmann G., et al., 2003, MNRAS, 341, 33
- Keel et al. (2019) Keel W. C., Banfield J. K., Medling A. M., Neff S. G., 2019, AJ, 157, 66
- Kriek & Conroy (2013) Kriek M., Conroy C., 2013, ApJ, 775, L16
- La Barbera et al. (2013) La Barbera F., Ferreras I., Vazdekis A., de la Rosa I. G., de Carvalho R. R., Trevisan M., Falcón-Barroso J., Ricciardelli E., 2013, MNRAS, 433, 3017
- Martin et al. (2007) Martin D. C., et al., 2007, ApJS, 173, 342
- Mateus et al. (2006) Mateus A., Sodré L., Cid Fernandes R., Stasińska G., Schoenell W., Gomes J. M., 2006, MNRAS, 370, 721
- McConnachie et al. (2016) McConnachie A. W., et al., 2016, arXiv e-prints, p. arXiv:1606.00060
- McKinley et al. (2018) McKinley B., et al., 2018, MNRAS, 474, 4056
- Menci et al. (2005) Menci N., Fontana A., Giallongo E., Salimbeni S., 2005, ApJ, 632, 49
- Narayanan et al. (2018) Narayanan D., Conroy C., Davé R., Johnson B. D., Popping G., 2018, ApJ, 869, 70
- Rowlands et al. (2018) Rowlands K., et al., 2018, MNRAS, 473, 1168
- Salim (2014) Salim S., 2014, Serbian Astron.l J., 189, 1
- Schawinski et al. (2007) Schawinski K., Thomas D., Sarzi M., Maraston C., Kaviraj S., Joo S.-J., Yi S. K., Silk J., 2007, MNRAS, 382, 1415
- Schawinski et al. (2014) Schawinski K., et al., 2014, MNRAS, 440
- Schaye et al. (2015) Schaye J., et al., 2015, MNRAS, 446, 521
- Smethurst et al. (2015) Smethurst R. J., et al., 2015, MNRAS, 450, 435
- Springel et al. (2018) Springel V., et al., 2018, MNRAS, 475, 676
- Strateva et al. (2001) Strateva I., et al., 2001, AJ, 122, 1861
- Taylor et al. (2015) Taylor E. N., et al., 2015, MNRAS, 446, 2144
- Thomas et al. (2003) Thomas D., Maraston C., Bender R., 2003, MNRAS, 339, 897
- Thomas et al. (2005) Thomas D., Maraston C., Bender R., Mendes de Oliveira C., 2005, ApJ, 621, 673
- Trager et al. (1998) Trager S. C., Worthey G., Faber S. M., Burstein D., González J. J., 1998, ApJS, 116, 1
- Tress et al. (2018) Tress M., et al., 2018, MNRAS, 475, 2363
- Vazdekis et al. (2012) Vazdekis A., Ricciardelli E., Cenarro A. J., Rivero-González J. G., Díaz-García L. A., Falcón-Barroso J., 2012, MNRAS, 424, 157
- Whitaker et al. (2011) Whitaker K. E., et al., 2011, ApJ, 735, 86
- Worthey & Ottaviani (1997) Worthey G., Ottaviani D. L., 1997, ApJS, 111, 377
- Wright et al. (2018) Wright R. J., Lagos C. d. P., Davies L. J. M., Power C., Trayford J. W., Wong O. I., 2018, arXiv e-prints,