A study of gamma-ray burst afterglows as they first come into view of the Swift Ultraviolet and Optical Telescope
Abstract
We examine the the emission from optically bright gamma-ray burst (GRB) afterglows as the Ultraviolet and Optical Telescope (UVOT) on the Neil Gehrels Swift Observatory first begins observing, following the slew to target the GRB, while the pointing of the Swift satellite is still settling. We verify the photometric quality of the UVOT settling data using bright stars in the field of view. In the majority of cases we find no problems with the settling exposure photometry, but in one case we excise the first second of the exposure to mitigate a spacecraft attitude reconstruction issue, and in a second case we exclude the first second of the exposure in which the UVOT photocathode voltage appears to be ramping up. Of a sample of 23 afterglows which have peak V magnitudes , we find that all are detected in the settling exposures, when Swift arrives on target. For 9 of the GRBs the UVOT settling exposure took place before the conclusion of the prompt gamma-ray emission. Five of these GRBs have well defined optical peaks after the settling exposures, with rises of mag in their optical lightcurves, and there is a marginal trend for these GRBs to have long . Such a trend is expected for thick-shell afterglows, but the temporal indices of the optical rises and the timing of the optical peaks appear to rule out thick shells.
keywords:
gamma-ray bursts : general1 Introduction
Gamma-ray bursts are the most powerful cosmic explosions. They are observed as transient sources of gamma-rays, which typically last between and s (Kouveliotou, 1994). This gamma-ray emission, which is usually referred to as the prompt gamma-ray emission, is followed by a longer lasting afterglow from X-ray to radio wavelenghts (e.g. De Pasquale et al., 2006). The standard paradigm for the prompt emission is that it arises from shocks associated with the collisions of shells ejected with different Lorentz factors in a highly relativistic explosion. The radiation generation mechanism(s) for the prompt emission remain the subject of debate, with possibilities including synchrotron emission from the shocks (e.g. Rees & Mészáros, 1994), Compton upscattering of photospheric emission (e.g. Rees & Mészáros, 2005) or magnetic reconnection (e.g. Zhang & Yan, 2011). The emission in these models is often described as internal emission because it takes place within the relativistic ejecta, before the ejecta are slowed significantly through interaction with the surrounding medium. The afterglow is thought to originate in the shocks arising from the collision of the ejecta with the surrounding interstellar medium; these shocks are therefore described as the external shocks (Rees & Mészáros, 1992).
Observational data are most constraining for models of the prompt emission and afterglow when the afterglow observations are obtained very quickly after, if not simultaneously with, the prompt emission. The Neil Gehrels Swift Observatory (hereafter Swift) carries a suite of instruments on a platform with rapid repointing capabilities and a significant degree of autonomy to permit the study of GRBs and their early afterglow emission (Gehrels et al., 2004). Swift begins its afterglow observations most rapidly when it detects and localises GRBs on-board with the Burst Alert Telescope (BAT; Barthelmy et al., 2005), prompting Swift to execute an automatic slew to point the Ultraviolet and Optical Telescope (UVOT; Roming et al., 2005) and X-ray Telescope (XRT; Burrows et al., 2005) at the target. Response times of 1-2 minutes are common.
During the slew, the UVOT is protected from damage by bright stars passing through the field of view by maintaining the photocathode in a low-voltage state. At the conclusion of the slew, Swift signals to the UVOT that it has arrived at the target, and the UVOT begins its first exposure. At this point, Swift’s reaction wheels are stabilising the satellite, such that the pointing direction is in transition from a motion of many arcseconds per second to a stable pointing. The exposure taken by UVOT during this transition is known as the settling exposure; its nominal duration is 10 s. The settling exposure is almost always taken through the filter; exceptions are found in a small period at the beginning of the mission when the default settling filter was UVM2, and occasions when the field of view of UVOT contains one or more stars which are recorded in the on-board catalogue as being too bright for safe observations through the filter.
Despite being the earliest UVOT exposure of Swift-discovered GRBs, the settling exposure is frequently ignored or discarded (e.g. Oates et al., 2012). The main reason is that photometry derived from the settling exposure is regarded as uncertain because of the changing UVOT photocathode voltage at the beginning of the exposure; the rapidly changing spacecraft attitude can also be a cause for concern (Roming et al., 2017). The settling exposure usually begins 10-15 seconds before the first settled exposure, and so represents a significant shifting forward of the afterglow observations, if the photometry can be trusted.
The detector of the UVOT is a micro-channel plate (MCP) intensified charge coupled device (CCD) (MIC; Fordham et al., 1989). It detects the photons individually with a time resolution limited by the frame time of the CCD, which is usually 11 ms. Data can be recorded and relayed to the ground as event lists, in which the arrival times and positions of the individual photons are retained, or as an image accumulated over a time interval. To meet data and telemetry limits, most UVOT data are recorded as images. Settling exposures are recorded as event lists. Although the satellite is moving during the settling exposure, the changing attitude of the satellite is taken into account when the photons are assigned sky coordinates. Thus an image of the sky can be constructed from the settling-exposure event list in which stars have shapes consistent with the normal UVOT point spread function, and there is no evidence of trailing.
In this paper, we verify the photometric quality of the settling exposures of a group of relatively bright GRB afterglows observed with Swift UVOT. Photometry of the GRB afterglows is then derived from the settling exposures, and the implications of these very early data are examined. In Section 2 we describe the sample selection, observations and data reduction. Our results are presented in Section 3 and discussed in Section 4. Our conclusions are given in Section 5. An appendix provides the measurements which were used to verify the photometric quality of the settling exposures. All magnitudes are given in the UVOT Vega system (Poole et al., 2008). All GRB times are referenced to the beginning of , which is the time period containing 90 per cent of the gamma-ray emission, as recorded in the Swift BAT on-line processing111http://gcn.gsfc.nasa.gov/swift_gnd_ana.html.
2 Sample selection, observations and data reduction
2.1 Sample Selection
Our objective is to examine the early periods of gamma-ray burst optical afterglow light curves to determine what fraction of the sample shows significant afterglow emission when Swift UVOT first arrives on target. Therefore we require a sample of gamma-ray burst afterglows that (a) are optically bright enough that we can expect to detect the afterglow in settling observations at a significant fraction of the peak flux, (b) were observed soon after the trigger and (c) have redshifts so that their observed properties can be transformed to the rest-frame.
With these criteria in mind, we have started with the sample of GRBs studied by Oates et al. (2012). The sample of Oates et al. (2012) was drawn from the second UVOT GRB catalogue (Roming et al., 2017), which contains all of the GRBs observed with Swift UVOT from the launch of Swift until 25 December 2010. For inclusion in their sample, Oates et al. (2012) required that a GRB must have been observed by UVOT within the first 400s after the BAT trigger and have a measurement of redshift, reflecting our criteria (b) and (c). For a typical settling exposure duration of 10 s, the limiting magnitude for a measurement with a signal to noise of 3 is mag. Our criterion (a) must therefore be more stringent than the peak brightness limit ( mag) adopted by Oates et al. (2012). For our study we have included only objects which have a peak magnitude of , which corresponds to a sample of 23 GRBs that are listed in Table 1.
| GRB | Redshift | Brightest mag | Settling mag | ||
| post-settling | (mag) | (s) | (s) | ||
| (mag) | |||||
| GRB 050525A | 0.606 | 70.2 | 8.8 | ||
| GRB 050801 | 1.38 | 56.3 | 19.4 | ||
| GRB 050922C | 2.198 | 104.3 | 4.5 | ||
| GRB 060418 | 1.489 | 136.7 | 144.0 | ||
| GRB 060607 | 3.43 | 103.5 | 60.5 | ||
| GRB 060908 | 2.43 | 75.0 | 19.3 | ||
| GRB 061007 | 1.261 | 72.0 | 75.3 | ||
| GRB 061021 | 0.77 | 63.9 | 46.2 | ||
| GRB 061121 | 1.314 | 39.5 | 81.2 | ||
| GRB 070318 | 0.836 | 58.8 | 108.0 | ||
| GRB 080319B | 0.937 | 51.0 | 45.1 | ||
| GRB 080721 | 2.602 | 118.5 | 64.0 | ||
| GRB 080810 | 3.35 | 77.1 | 108.8 | ||
| GRB 081008 | 1.967 | 125.6 | 185.5 | ||
| GRB 081203A | 2.05 | 93.4 | 221.0 | ||
| GRB 081222 | 2.77 | 46.5 | 33.0 | ||
| GRB 090401B | 3.1 | 67.8 | 186.5 | ||
| GRB 090424 | 0.544 | 79.7 | 49.5 | ||
| GRB 090618 | 0.54 | 105.9 | 113.2 | ||
| GRB 090812 | 2.452 | 73.7 | 66.7 | ||
| GRB 091018 | 0.971 | 56.0 | 4.4 | ||
| GRB 091020 | 1.71 | 80.2 | 39.0 | ||
| GRB 100906A | 1.727 | 73.7 | 14.3 |
2.2 Observations, data reduction and analysis
All of the GRBs in the sample were observed with Swift UVOT in Automated Target (AT) mode, and the analysis is restricted to those observations obtained in the initial observing segment, roughly the first 24 hours from the detection of the burst.
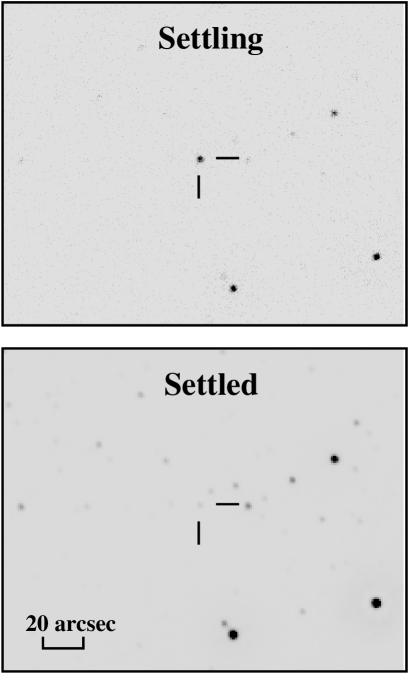
For each GRB the UVOT -band sky images and event data were retrieved from the UK Swift Science Data Centre222http://www.swift.ac.uk. Images were screened visually for problems such as source trailing and any affected images were discarded. Then, for each GRB all remaining images except for that of the settling exposure were summed using the standard Swift ftool task uvotimsum to produce a single settled image. For the settling exposures, sky images were constructed from the event lists using evselect. The resulting sky images were inspected for attitude problems indicated by trailing of stars. Only in the case of GRB 061007 was a problem identified; in this case the problem was solved by discarding the first second of the settling exposure. Then, for each GRB the settling image and settled image were registered and aspect corrected to the same astrometric reference frame using the USNO-A2.0 source catalogue (Monet et al., 1998). Examples of the settling and settled images constructed in this way are shown in Fig. 1.
Photometric measurements of between one and 3 reference stars in the settling and settled images of each GRB field were then obtained to assess the photometric properties of the settling images. The brightest non-saturated stars in each field were chosen as the reference stars in order to maximise the accuracy of the photometry. Circular apertures of 5 arcsec radius were employed for the source measurements, as is standard practice for measurement of bright sources in UVOT (Poole et al., 2008), and background was measured from a source-free circular aperture of 25 arcsec radius. The measurements were carried out with the standard Swift ftool task uvotmaghist, which corrects for coincidence-loss, the evolution of the UVOT sensitivity with time, and the large scale sensitivity variations over the detector (see Breeveld et al., 2010).
Photometric measurements of the GRB afterglows in the settling exposures were carried out by following the same procedure as for the reference stars.
3 Results
Fig. 2 shows the photometric offsets of the settling exposures with respect to the later, settled exposures as measured with the reference stars in each field. Further details of the reference-star measurements are given in Appendix A. The majority of the offsets are negative, indicating that the reference stars appear to be fainter in the settling exposures, but most offsets are small (all bar two are below 0.1 magnitude) and only one, corresponding to GRB 091020, is individually significant at . Where a bright enough comparison star is available, we have further investigated the photometric stability of the settling exposures by splitting them into 1 s chunks and generating lightcurves for the comparison stars; the lightcurves are given in Appendix A. In only one case do we see evidence that the ramp-up of the photocathode voltage impinges on the settling exposure: the comparison star in the field of GRB 091020 appears a magnitude fainter in the first second than in the remainder of the settling exposure. This problem can be remedied by excluding the first second of the settling exposure from our analysis. So doing, the photometric offset of the GRB 091020 field changes from to , consistent with zero at 1 . After this correction to the GRB 091020 field, the weighted mean offset for all GRB fields is mag. This mean offset is sufficiently marginal (2 ) that we cannot distinguish whether it is a genuine instrumental effect or a statistical fluctuation. The size of the mean offset is sufficiently small (less than half of the 1 uncertainty on the best settling-exposure photometry in our GRB sample) that we do not consider any correction to the settling-exposure photometry to be necessary.
Photometry for the GRBs from the settling exposures are given in Table 1, together with their redshifts, some optical measurements at later times from the lightcurves constructed by Oates et al. (2012), and the durations of their gamma-ray emission from the on-line BAT processing1. All of the GRBs were detected in the settling exposure with a significance of with respect to the Poission fluctuations in the background. Note that in the case of GRB 061007, the count rate of the afterglow exceeds the calibrated limit for coincidence-loss correction in UVOT (see Poole et al., 2008; Page et al., 2013) during the settling exposure. Consequently, we report an upper limit for the magnitude, corresponding to the maximum calibrated count rate, in Table 1. In statistical terms, GRB 061007 is securely (3) brighter than this limit, using the statistical uncertainties derived by Kuin & Rosen (2008).
Fig. 3 shows the difference between the magnitude recorded in the settling exposure () and the brightest magnitude recorded either in the settling exposure or the subsequent UVOT lightcurve () against the time of the peak optical emission () in the rest frame of the GRB. When the brightest magnitude for a GRB is recorded in the settling exposure, is shown as an upper limit. The majority of the data points are clustered at the bottom left of the figure. For these sources the settling exposure is either the brightest measurement or differs by less than 0.4 mag from the brightest measurement. Away from the bottom left corner are five GRBs which brighten significantly (by 0.5 – 3 mag) after the settling exposure, and therefore have optical lightcurves which show a well defined peak.
Fig. 4 shows the mid-time of the settling exposure against the gamma-ray duration , with both times transformed to the rest-frame of the GRB. The solid line indicates . Nine out of 23 points lie below the line, implying that UVOT took its first exposures while the prompt gamma-ray emission was still underway.


4 Discussion
For our sample of 23 GRBs with bright optical afterglows, the optical emission had already begun by the time of the Swift UVOT settling exposure in every single case. In 9 cases, the settling exposure took place before the end of the period in which most of the prompt gamma rays are emitted. We do not observe a delay between the end of the gamma-ray emission and the beginning of that in the optical in any GRB. Such a statement could be made on the basis of some previous studies of GRB samples with rapid optical follow up (e.g. Rykoff et al., 2009; Oates et al., 2009), but the homogeneity and size of our sample place this conclusion on a firmer statistical footing.
Our study also provides a useful statistical context for studies of gamma-ray bursts which show peaks in their optical lightcurves (e.g. Molinari, 2007; Panaitescu & Vestrand, 2011; Panaitescu, Vestrand & Woźniac, 2013). At the peak-magnitude limit () of our study, only 5 out of 23 GRBs show well-defined optical peaks, or per cent, within the time-frame of the observations. The need for even faster optical response times for GRBs is brought into sharp focus: while a significant anti-correlation has been observed between the timing and brightness of the optical peak by Panaitescu & Vestrand (2011) when such a peak is observed, for the majority of GRBs we have only upper and lower limits for these two quantities respectively, because our observations begin too late to measure the optical peak.
Broadly speaking, there are two possibilities for the origin of the optical emission which we observe when the GRB first comes into view of Swift UVOT. The optical emission could be produced by the shocks which are generated as the ejecta are slowed by the external medium, and/or the optical emission could be related to prompt gamma-ray emission, which in turn is thought to be produced internally to the outflow. It is possible that a combination of both possibilities could contribute to the observed emission and that the dominant contributor could be different at the time of the settling exposure in different GRBs.
We start by examining the possibility that the earliest optical emission comes from the internal emission. Of our sample of 23 GRBs, there are 14 GRBs for which the settling data were taken after the conclusion of T90; for these GRBs we can assume that the earliest optical emission is observed too late to be attributed to internal emission. The remaining 9 GRBs, for which T90 encompasses the settling exposure, are now examined in more detail. Fig. 5 shows the UVOT and BAT lightcurves for these 9 GRBs. For GRBs 060418, 070318, 081203A, and 090401B, the settling exposure matches well the extrapolation of data from later times, and appears to have little correspondence to the prompt gamma-ray emission. In GRB 090618 the settling exposure shows enhanced optical emission compared to the later time optical lightcure, and corresponds approximately to one of the peaks in the prompt emission. Therefore the prompt emission could plausibly contribute to the optical flux at the time of the settling exposure for this GRB. In GRB 061007 the settling exposure is consistent with the extrapolation of the UVOT lightcure, but the UVOT measurement is beyond the bright coincidence-loss limit, and hence we have only a lower limit to the optical flux; the settling exposure coincides with one of the peaks in the prompt emission, so for GRB 061007 we also consider it possible that the prompt emission contributes to the optical flux measured in the settling exposure. In GRBs 061121, 080810 and 081008 the settling exposures correspond to times of little or no gamma-ray emission, but are followed by significant pulses of gamma rays and peaks in the optical that suggest that the optical emission at the time of the settling exposure and for some period subsequently might be related to the prompt emission. Thus there are five GRBs, 061007, 061121, 080810, 081008 and 090618, for which the prompt emission might be contributing to the optical flux at the time of the settling exposure, and/or at the time of the peak optical flux.
We consider next the scenario in which the earliest optical emission comes from the external shock, which is the standard paradigm for the afterglow emission. Either the forward shock propagating into the external medium, or the reverse shock propagating back into the ejecta (Mészáros & Rees, 1993) are viable mechanisms for producing the early optical emission. Emission from an external shock at an observed time after the beginning of the GRB implies that the external shock is producing detectable optical emission at a distance from the explosion site (Zhang & Meszaros, 2004):
| (1) |
where is the speed of light, is the redshift of the GRB and is the Lorentz factor of the relativistic outflow. For a characteristic and the observed range of 10 s 70 s, ranges from and cm. For the majority of the GRBs in our sample the optical lightcurve is already declining at the time of the settling observation, so represents an upper limit to the deceleration radius.
In Fig. 4 it is notable that four of the five GRBs for which a robust optical peak is detected have , whereas the majority of the GRBs which are declining in the optical from the first observation have . To evaluate the significance of the apparent trend for a larger proportion of GRBs with optical peaks to have a than those without, we apply Fisher’s exact test, obtaining a -value of 5.6 per cent for the null hypothesis that there is no trend. The trend is therefore of marginal (approximately 2) significance. However, it is interesting to note that two of the GRBs in our sample have observations from ground based observatories which caught the peak of the optical emission: GRB 061007 with ROTSE (Rykoff et al., 2009) and GRB 080319B with TORTORA (Racusin et al., 2008). In both cases, the ground-based observations began before the end of ; if these observations were substituted for those of UVOT in Fig. 4 the Fisher’s exact test would instead yield a -value of just 1.8 per cent.
Naturally, it would be expected that the earlier the observations begin, the greater the likelihood of observing the peak in the optical emission, irrespective of , so it is worth investigating whether this is responsible for the tendency to observe the peak if . A Komogorov Smirnov (KS) test on the distributions of for GRBs with and without optical peaks results in a -value of 99.6 per cent for the null hypothesis that the two distributions are the same, hence the two distributions are indistinguishable. In contrast, a KS test on the distributions of for the two groups of GRBs gives a -value of just 4.8 per cent. This suggests that within our sample, optical peaks are observed preferentially in GRBs with long , rather than in GRBs with early optical observations.

Theoretically, the timing of the peak in the optical lightcurve with respect to depends on whether the afterglow is produced by the collision of a thin or thick shell with the surrounding interstellar medium. Specificially, the thick shell case corresponds to where is the thickness of the shell, is the kinetic energy of the shell, is the initial Lorentz factor of the shell, is the density of the surrounding medium, is the speed of light in vacuum and is the mass of a proton (Sari & Piran, 1999). It is common to assume that the duration of the burst, is approximately , with the implication that for thick shells the peak time of the optical emission should be comparable to (Sari & Piran, 1999; Kobayashi, 2000). A peak time for the optical emission which is significantly delayed with respect to the end of is therefore usually taken to imply the thin shell case (Molinari, 2007; Rykoff et al., 2009). The numerical modelling of Kobayashi & Zhang (2007) would suggest that may be a realistic expectation for a thick shell. Thick shells should also exhibit relatively shallow afterglow rise profiles, with where (Kobayashi, 2000; Kobayashi & Zhang, 2007). For the afterglows with well defined peaks, can be estimated from the timing and magnitude of the peak relative to the settling exposure:
| (2) |
For the five gamma-ray bursts in our sample for which a secure peak has been observed in the UVOT lightcurve, the values of and for the rise phase are given in Table 2. None of the GRBs satisfy both and , implying that all of them have thin shell afterglows. Consequently, if there is a connection between and the observability of the optical peak, it is not because the outflows are thick shells.
In the thin shell regime, the peak of the optical emission is expected to occur when the shell reaches the deceleration radius, at which the shell has swept up a mass of material from the surrounding interstellar medium equal to times the initial rest mass of the shell (Zhang & Meszaros, 2004). In this case, the timing of the afterglow peak relative to the start of the GRB should be independent of , and therefore a connection between and the observability of the optical peak emission is not expected in the thin shell case.
An alternative explanation for the trend for GRBs with large to present well-defined peaks in their optical emission would be for the prompt emission to be contributing to the optical peak. As we have already discussed, the prompt emission is unlikely to contribute to the observed optical emission except, perhaps, in a small minority of the GRBs in our sample. Of those with well-defined optical peaks, only GRB 061121 (see also Page et al., 2007) is a good candidate for a prompt contribution to the optical peak. Nonetheless, the trend relating to detection of optical peaks is based on such a small number of sources, that it could be explained as a combination of prompt optical emission in GRB 061121 together with a statistical fluctuation in these properties amongst the remaining GRBs.
| GRB | |||
|---|---|---|---|
| (s) | |||
| GRB 060418 | 264.5 | 1.84 | |
| GRB 060607 | 207.3 | 3.42 | |
| GRB 061121 | 69.5 | 0.85 | |
| GRB 070318 | 340.8 | 3.15 | |
| GRB 081203A | 358.4 | 1.62 |
5 Conclusions
We have examined the optical emission from a sample of optically-bright (peak mag) GRB afterglows as they first came into view with Swift UVOT. In one case (GRB 061007) the first second of the settling exposure was excluded because the spacecraft attitude reconstruction was not good enough to prevent trailing of stars at the beginning of the exposure. In another case (GRB 091020) the first second of the settling exposure was excluded because we found evidence that the UVOT photocathode voltage is still ramping up during that first second. The photometric quality of the UVOT settling exposures was verified using photometry of bright stars in the field of view. These stars were found to be of very similar brightness in the settling exposures to subsequent UVOT images (differing on average by mag). The settling exposures are therefore considered to be good enough to derive photometry for the GRB afterglows.
Of the sample of 23 GRBs, all are detected in the UVOT settling exposures, and hence in every case the optical emission had already begun by the time of the settling exposure. In 9 of the GRBs, the settling exposure took place within of the prompt gamma-ray emission. Five GRBs have well defined optical peaks, with measured rises of mag in their optical lightcurves following the settling exposure. A trend is found, with marginal statistical signficance (2), for these GRBs with well-defined optical peaks to have large values of , and to be observed before the conclusion of . Such a trend would be expected from thick-shell afterglows, but the timing of their optical peaks and the temporal indices of their optical rises rule out thick-shell behaviour. Instead, a contribution from the prompt emission to the optical peak in one or more GRBs could account for the trend.
Acknowledgments
This work has been supported by the UK Space Agency under grant ST/P002323/1 and the UK Science and Technology Facilities Council under grant ST/N00811/1. This work has made use of the UK Swift Science Data Centre, hosted at the University of Leicester, UK. SRO gratefully acknowledges the support of a Leverhulme Trust Early Career Fellowship.
References
- Barthelmy et al. (2005) Barthelmy S.D., et al., 2005, Space Science Reviews, 120, 143
- Breeveld et al. (2010) Breeveld A.A., et al., 2010, MNRAS, 406, 1687
- Burrows et al. (2005) Burrows D.N., et al., 2005, Space Science Reviews, 120, 165
- De Pasquale et al. (2006) De Pasquale M., et al., 2006, A&A, 455, 813
- Fordham et al. (1989) Fordham, J.L.A., Bone D.A., Read P.D., Norton T.J., Charles P.A., Carter D., Cannon R.D., Pickles A.J., 1989, MNRAS, 237, 513
- Gehrels et al. (2004) Gehrels N., et al., 2004, ApJ, 611, 1005
- Kobayashi (2000) Kobayashi S., 2000, ApJ, 545, 807
- Kobayashi & Zhang (2007) Kobahashi S. & Zhang B., 2007, ApJ, 655, 973
- Kouveliotou (1994) Kouveliotou C., 1994, ApJS, 92, 637
- Kuin & Rosen (2008) Kuin N.P.M. & Rosen S.R., 2008, MNRAS, 383, 383
- Mészáros & Rees (1993) Mészáros P., Rees M.J., 1993, ApJ, 405, 278
- Molinari (2007) Molinari E., et al., 2007, A&A, 469, L13
- Monet et al. (1998) Monet D., et al., USNO-A2.0, Flagstaff: US Naval Observatory.
- Oates et al. (2009) Oates S.R., et al., 2009, MNRAS, 395, 490
- Oates et al. (2012) Oates S.R., Page M.J., De Pasquale M., Schady P., Breeveld A.A., Holland S.T., Kuin N.P.M., Marshall F.E., 2012, MNRAS, 426, L86
- Page et al. (2007) Page K.L., et al., 2007 ApJ, 663, 1125
- Page et al. (2013) Page M.J., et al., 2013, MNRAS, 436, 1684
- Panaitescu & Vestrand (2011) Panaitescu A., Vestrand W.T., 2011, MNRAS, 414, 3537
- Panaitescu, Vestrand & Woźniac (2013) Panaitescu A., Vestrand W.T., Woźniac P., 2013, MNRAS, 433, 759
- Poole et al. (2008) Poole T.S., et al., 2008, MNRAS, 383, 627
- Racusin et al. (2008) Racusin J.L., et al., 2008, Nature, 455, 183
- Rees & Mészáros (1992) Rees M.J. & Mészáros P., 1992, MNRAS, 258, 41
- Rees & Mészáros (1994) Rees M.J. & Mészáros P., 1994, ApJ, 430, L93
- Rees & Mészáros (2005) Rees M.J. & Mészáros P., 2005, ApJ, 628, 847
- Roming et al. (2005) Roming P.W.A., et al., 2005, Space Science Reviews, 120, 95
- Roming et al. (2017) Roming P.W.A., et al., 2017, ApJS, 228, 13
- Rykoff et al. (2009) Rykoff E.S., et al., 2009, ApJ, 702, 489
- Sari & Piran (1999) Sari R. & Piran T., 1999, ApJ, 520, 641
- Zhang & Meszaros (2004) Zhang B. & Mészáros P., 2004, International Journal of Modern Physics A, 19, 2385
- Zhang & Yan (2011) Zhang B., & Yan H., 2011, ApJ, 726, 90
APPENDIX A: PHOTOMETRIC PERFORMANCE OF THE UVOT DURING THE SETTLING EXPOSURES
Settling exposures are taken at the final stage of the Swift spacecraft slew, when the target has entered the field of view of UVOT, but the spacecraft is still moving. Bright stars observed simultaneously with the GRB afterglows were used to verify the photometric validity of the UVOT photometry used in this study. Source measurements were made using uvotsource with a five arcsec radius aperture and background measurements were made using the same larger apertures that were employed in the afterglow photometry (Section 2.2). Two measurements were made for each star. The first is from the image formed from the settling data that was used for afterglow photometry. The second measurement was made using the sum of the other -band images obtained during the same observation sequence of the GRB afterglow, excluding any images exhibiting attitude problems. Photometry obtained from the second measurement is invariably of higher precision than that obtained from the settling data because the exposure times are much longer, and as the photocathode voltage is stable after the settling exposure the photometry is reliable. Table A1 gives the photometry for the stars in each GRB field of view.
![[Uncaptioned image]](/html/1907.01889/assets/x6.png)
Figure A1 Lightcurves of comparison stars brighter than mag during the settling exposures. is computed as where is the magnitude in the subsequent settled exposures, so that negative values correspond to the reference star appearing fainter in the settling exposure. Note the large, negative during the first time bin for the GRB 091020 comparison star 11 42 48.02 +50 59 57.4 (indicated by the dashed circle in the bottom left panel), suggesting that the voltage ramp-up of the photocathode took place during the first second of the settling exposure in this case. On two occasions, once each for the two brightest comparison stars (GRB 050922C, star 21 09 39.53 08 46 18.9 and GRB 081008, star 18 39 51.47 –57 30 13.9) positive fluctuations push the count rate above the bright calibration limit for coincidence loss (Poole et al., 2008; Page et al., 2013). These two datapoints have been omitted from the relevant lightcurves.
Table A1. Photometry of bright stars within the UVOT fields of view for the GRB afterglows used in the study. is computed as where is the magnitude in the settling exposure and is the magnitude in the subsequent settled exposures, so that negative values correspond to the reference star appearing fainter in the settling image. GRB Star mag in mag in RA dec settling subsequent (mag) (J2000) (J2000) data images GRB 050525A 18 32 31.75 26 13 45.2 18 32 45.71 26 15 28.6 GRB 050801 13 36 21.27 22 00 04.8 13 36 23.93 21 59 04.2 13 36 40.88 21 55 58.7 GRB 050922C 21 09 39.53 08 46 18.9 21 09 13.68 08 46 56.3 21 09 36.04 08 42 47.8 GRB 060418 15 45 52.89 03 38 17.3 15 45 56.35 03 36 26.3 15 45 48.90 03 40 17.8 GRB 060607 21 58 45.54 22 30 47.9 21 58 53.31 22 26 31.4 GRB 060908 02 07 10.34 00 23 16.6 02 07 20.98 00 18 44.8 02 07 23.32 00 20 39.1 GRB 061007 03 05 01.35 50 28 19.6 03 05 40.60 50 31 35.0 GRB 061021 09 40 52.12 21 57 45.0 09 40 48.14 21 55 42.2 09 40 45.48 22 00 13.9 GRB 061121 09 48 57.93 13 07 26.7 09 49 03.24 13 09 28.4 09 49 04.68 13 10 31.0 GRB 070318 03 13 55.40 42 53 14.1 03 14 10.25 42 55 32.5 03 13 59.07 42 57 08.4 GRB 080721 14 57 53.23 11 44 10.4 14 58 04.47 11 41 22.6 GRB 080810 23 47 05.23 00 15 45.2 23 46 58.49 00 18 30.7 23 47 02.82 00 22 06.9 GRB 081008 18 39 51.47 57 30 13.9 18 39 54.02 57 29 27.5 18 40 00.95 57 27 17.5 GRB 081203A 15 32 17.11 63 29 26.4 15 31 51.63 63 29 47.6 15 32 27.45 63 32 34.2 GRB 081222 01 30 58.79 34 02 18.6 01 30 42.75 34 06 07.2 01 31 11.68 34 06 24.0 GRB 090401B 06 20 12.49 08 56 50.1 06 20 21.95 08 59 30.1 06 20 16.32 08 59 48.6
Table A1. continued GRB Star mag in mag in RA dec settling subsequent (mag) (J2000) (J2000) data images GRB 090424 12 38 04.01 +16 52 21.2 12 38 08.61 +16 50 23.9 12 37 50.82 +16 50 11.7 GRB 090618 19 36 44.84 +78 20 52.2 19 34 58.43 +78 21 12.4 19 36 34.28 +78 19 20.7 GRB 090812 23 32 36.14 -10 39 02.2 23 33 01.04 -10 37 06.4 23 32 40.95 -10 36 11.2 GRB 091018 02 08 32.08 -57 30 08.9 02 09 02.29 -57 36 00.8 02 08 50.91 -57 33 58.0 GRB 091020 11 42 48.02 +50 59 57.4 11 43 07.16 +50 57 28.8 11 42 47.24 +50 57 24.2 GRB 100906A 01 54 31.65 +55 40 14.7 01 54 38.13 +55 37 14.5 01 55 00.63 +55 38 55.3
We can further examine the photometric performance of the UVOT during the settling exposures by dividing the settling exposure into smaller time bins. In this way, we can investigate whether the photocathode voltage ramp-up is complete, and the detector is stable when the settling exposure begins, or whether the detector performance is changing during the settling exposure. Due to the small integration times involved, this is only practical for the brighter comparison stars. Therefore, for each of the comparison stars in Table A1 brighter than mag (except for those in the field of GRB 061007)333As noted in Section 2.2, there is a problem with the spacecraft attitude reconstruction in the first second of the GRB 061007 settling exposure, and so this is not an appropriate dataset for investigation of the photometric performance at the beginning of the settling exposure., we have generated lightcurves with a cadence of 1 s. The lightcurves are shown in Fig. A1.