DVP: Data Visualization Platform
![[Uncaptioned image]](/html/1906.11738/assets/Graphics/FigPrototype.png)
![[Uncaptioned image]](/html/1906.11738/assets/Graphics/FigPrototypeOnline.png) Two snapshots for DVP. Left: the DVP integrated locally to Matlab on the
desktop and acts as a Matlab toolbox, where all variables are communicated from/to
Matlab. Right: the online version of the DVP where all actions, interactions, and dynamics can
be performed.
Two snapshots for DVP. Left: the DVP integrated locally to Matlab on the
desktop and acts as a Matlab toolbox, where all variables are communicated from/to
Matlab. Right: the online version of the DVP where all actions, interactions, and dynamics can
be performed.
Abstract
We identify two major steps in data analysis, data exploration for understanding and observing patterns/relationships in data; and construction, design and assessment of various models to formalize these relationships. For each step, there exists a large set of tools and software. For the first step, many visualization tools exist, such as, GGobi, Parallax, and Crystal Vision, and most recently tableau and plottly. For the second step, many Scientific Computing Environments (SCEs) exist, such as, Matlab, Mathematica, R and Python. However, there does not exist a tool which allows for seamless two-way interaction between visualization tools and SCEs. We have designed and implemented a data visualization platform (DVP) with an architecture and design that attempts to bridge this gap. DVP connects seamlessly to SCEs to bring the computational capabilities to the visualization methods in a single coherent platform. DVP is designed with two interfaces, the desktop stand alone version and the online interface. To illustrate the power of DVP design, a free demo for the online interface of DVP is available [1] and very low-level design details are explained in this article. Since DVP was launched, circa 2012, the present manuscript was not published since today for commercialization and patent considerations.
Index Terms:
Data Visualization, Scientific Computing, Data Analysis, Graphics Interaction, Dynamic Plots1 Introduction
1.1 Why Data Visualization?
Data acquisition is ubiquitous; and data arise from diverse areas and applications, including medical, financial, industrial, governmental, among others. Data of size consist of records/observations, and each consists of dimensions/features. When increases dramatically data is high dimensional. An example is DNA microarray data where the number of observations (here are patients) is in the order of hundreds, while the number of dimensions (here are genes) is in the order of thousands. When increases dramatically data is called “big”. An example is astronomical data where the number of observations reaches billions!
Regardless to the origin of data or its application—data analysis, including statistics, statistical learning, machine learning, and pattern recognition, collectively are concerned with understanding data, recognizing patterns, and learning input-output relationships hiding in data. Modeling such a pattern/relationship can be described by a regression function, classification rule, clustering analysis, or mere statistical testing and summaries. This modeling is used for prediction (or decision support), and interpretation. Two steps usually are involved:
-
1.
Data exploration and visualization for understanding and observing patterns/relationships in data. This step involves visualizing data in many interactive and dynamic plots. Each plot conveys part of the story, which is emphasized by the interaction with each plot and linking among different plots; [see, e.g., 2, 3, 4, 5, 6, 7]. The term “Data Visualization” is used interchangeably with “Exploratory Data Analysis” (EDA) and recently more fashionably “Visual Data Mining”; all convey the meaning and objective behind such a step.
- 2.
Each of these two steps accounts for a field by itself with its own literature, theory, and software. Although inclusion of the two steps results in a consolidated design and great understanding of data, not all practitioners adopt such a comprehensive view when analyzing data. The need for the first step, data visualization and exploration, becomes more crucial when data become high dimensional (huge ) or become “big” (huge ). This is true since modeling, analyzing, and processing data with huge or/and become more difficult and complicated. Data visualization and exploration reveal secrets and paves shortcuts to understanding data and building best models.
1.2 Why DVP for Data Visualization?
| Package | SCE support | Interactivity | Linked Plots | Extensibility | Cross Platform | Figure Customisation | Database Servers | Mutliple devices |
| Matlab | - | - | - | x | - | x | ||
| Mathematica | - | - | - | x | x | - | ||
| SigmaPlot | - | - | ||||||
| OriginLab | - | - | ||||||
| Tablue | - | - | - | - | - | x | x | |
| PV-Wave | x | - | - | - | x | |||
| Plot.ly | - | - | - | - | - | x | ||
| Parallex | - | x | - | - | - | |||
| RGgobie | - | x | - | - | ||||
| DVP | x | x | x | x | x | x | x | - |
Many data visualization software (DVSW) exist that can produce similar results with the capabilities of “interaction” and “linking”, which are not supported by any Scientific Computing Environment (SEC) as Matlab, Mathematica, SAS, etc. Then, the right question is this: what is the need for another DVSW, and why do we propose our Data Visualization Platform (DVP)? We provide below, in bullets, an answer for this question and show how DVP design and philosophy is important to scientists, researchers, and data analysts in different fields. Although not all of the following aspects are currently implemented, but the DVP kernel is designed with eyes on the following:
-
•
Seamless communication with any SCE to behave as a single environment. Current DVSWs are standalone software that are detached from SCEs. Any scientist, researcher, or data analyst using any SCE cannot interact with patterns visualized and discovered in the DVSW. For example, if the data analyst uses Matlab to analyze a dataset, and Parallax to visualize data, he cannot do processing on patterns discovered in Parallax; these patterns are not, of course, seen as variables in Matlab workspace. It is impossible to iterate back and forth between the DVSW and the SCE except by tedious data export and import that puts hurdles. DVP is designed to interact seamlessly with any SCE, as if both are one environment, even if DVP and SCE are running on two different machines. This is extremely important for connecting with computing clouds for analyzing big data.
-
•
High extensibility to different plots and methods in various scientific fields. Current DVSWs provide some visualization methods, e.g., ——-coords, scatter plot, matrix plot, projection pursuit, grand tour in 4 dimensions, etc. However, many scientific fields require more sophisticated methods. For example, graph analysis and astronomical data require Multi-Dimensional Scaling (MDS) plots [see, e.g., 2, II.6]. It is almost impossible for any DVSW to provide all the available plotting and charting methods, let alone ones being continuously developed from many fields of science. DVP, in addition to the wide range of plots it provides, it is designed to provide an easy scripting language based on JavaScript that enables users to write their own plotting methods and integrate them to DVP. This will build a wider user community and enrich it with many sophisticated methods.
-
•
Support data from network streams and common local database servers, e.g., SQL, MySQL, and Oracle. Many DVSWs only load data statically from a local machine storage. However, nowadays, many data sources belonging to many applications are available online and updated in real time; e.g., stock market data, data of global enterprises, Yahoo data, etc. Analysts monitoring such data have to be connected all the time. DVP is designed to facilitate connection to network streaming and different online database sources.
-
•
Available API for interfacing with different hardware, e.g., Raspberry Pi and Arduino chips. Data acquisition is not explicit to software and reports; data are acquired from hardware as well, e.g., Arduino and Raspberry Pi chips. Arduino [14] is a micro controller designed with the objective to connect to the ambient; a chip has different sensors for humidity, light, and moisture, etc. Raspberry Pi [15] is a credit-card size computer; yet it is so simple that anyone can program it. DVP is designed to provide API for interfacing with hardware devices.
-
•
Cross platform compatibility, e.g., Windows, Linux, Mac, and iOS. In contrast to many available DVSWs, DVP is designed to operate across different operating systems.
-
•
Multi-device rendering support, e.g., touch screens, big data displays, dashboards, and interactive PDFs Many DVSWs render only to desktop screen, they are not designed for displaying big data on large displays, although there is a demand to render data to large displays as we have entered already the era of big data. DVP is designed to render to small and large displays and to receive input from touch devices as well for wider user community and commercial needs. DVP is designed to offer business solutions, as well, for enterprises by supporting web-based dashboards and online visualization. In addition, DVP is designed to produce interactive PDF documents by exporting figures and plots to PDF with the capability of interacting with those figures in the PDF document itself. This integrates reporting schemes to interactive graphics for portability and wider utility.
-
•
Customizable figures and plots. As opposed to many DVSWs, DVP is designed to provide full customization to its figures and plots. Moreover, the design concept behind DVP is that every activity is a result of a function call with passed parameters. The GUI actions of the DVP do nothing but calling those functions. This means that users can create whatever plots, figures, new methods, and fully customize them with the provided scripting language.
Table I is a more quantitative comparison between the first version of DVP and other well known software available in the market for either data visualization or scientific computing. The comparison is established on 2013 version of all of them, when DVP was launched. It is clear that the majority of aspects important to a complete visualization system are missing in the available systems. DVP is concerned with providing all of these technical features and aspects in one platform. In Section 2.4, below, we elaborate more on those features and detail each of them.
1.3 Organization of Manuscript
The rest of this paper is organized as follows. Section 2 is a high-level design aspects, requirements, and features of DVP. Sections 3–6 detail the design and architecture of DVP components and subsystems. To clarify the power of the DVP kernel design, we had to present in these sections some very low-level technical details at the level of variables and processes. Appendix A is a very short account and tutorial on data visualization and graphics, taken almost from textbooks, that includes history, importance and motivation for exploratory data analysis and Grammar of Graphics (GoG). It is important for a reader who is not fully acquainted with the field; however, it can be trimmed out from the manuscript without affecting its coherence.
2 DVP: high level design aspects
In this section we provide the high level design aspects and philosophy of DVP; some of these aspects are implemented and others are still under development. Even those aspects that are still under development are taken care and accounted for the internal design and architecture of the whole system. For a full account of the implemented aspects the reader may refer to the technical manual of the DVP.
2.1 Formal Scripting Language Based on “Grammar of Graphics”
In this project of designing a data visualization software, we adopted a very sophisticated design of scientific plots and figures. It is based on the so called ‘Grammar of Graphics” (GoG) that was proposed first by [16], and adopted, e.g., in the R package for static plotting ggplot2 [17]. The power of that very formal approach of describing plots and figures lies in its generality and in its procedural design. With GoG, graphics are not a simple render of colored points on a planar area. Rather, with GoG there is a formal language to describe graphics at some level of abstraction. This is so powerful a tool for describing new plotting methods or modifying existing ones, which is ideal for our general purpose DVP that provides a scripting language for coding new plotting methods. For more information on GoG the reader my refer to [16].
2.2 Algorithms, Mathematics, and Properties of Plots
There are many important plots for visualizing data that require rigorous mathematical treatment or algorithm design; e.g., Parallel Coordinates (——-coords), Projection Pursuit (PP), Force-Directed Graphs (FDG), Multi-Dimensional Scaling (MDS), among others.
One example is ——-coords, where designing useful data group selections (queries) requires good knowledge of the geometry of high dimensions in ——-coords. Useful mathematical queries have to be designed for selecting observations of particular interest, e.g., observations with particular slope, observations with some correlation coefficient, etc. Having such queries in DVP enables us, e.g., to interact more smartly with the ——-coords plots. For more information on ——-coords the reader may refer to [18].
In addition, algorithm design is needed for some quiries. For example when selecting some data of interest between two parallel axes in ——-coords. This sounds trivial at the first glance; however, between the axes one has to search where the GUI selecting tool (e.g., mouse) is moving and intersecting with drawn lines. Brute-force search is disastrous if not impossible for large data. Efficient heuristic search algorithms have to be designed, not to sacrifice selection accuracy for performance optimization and rendering speed.
2.3 Global System Architecture
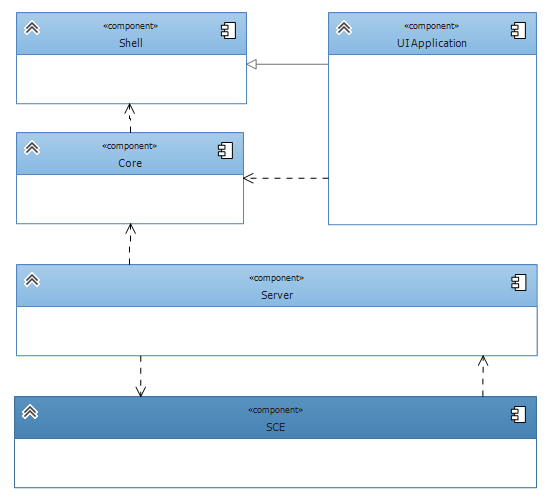
DVP is a complex system that provides a various set of innovative features, and these features depend on a wide set of modules and technologies that construct the main architecture of DVP. As sketched in Figure 1, the architecture design of the DVP system consists of separate cooperating parts (subsystems) that work all together to achieve system functionalities. These parts are responsible for providing the support for cross platform compatibility, multi-device support, communication with SCEs, and rich interactive visualization. The architecture of each subsystem is discussed below with a short description of its functionality, structure, and provided features.
2.3.1 Shell application
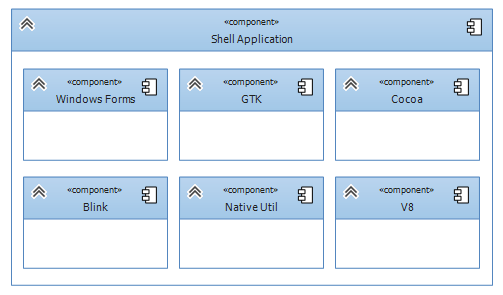
Shell application, as sketched in Figure 2, is a fully functioning web browser that runs as a container and as a host for web content, which accounts for a perfect way to host HTML based applications natively on heterogeneous operating systems supported by the browser. This design can be found in applications like Atom IDE [19], Adobe Brackets [20], and LightTable [21]. This shell application consists of two main subparts on Figure 2. The first is a platform dependent native UI component, which appears in the Figure as Windows Forms for Windows, GTK for Linux, and Cocoa for Mac. The second is Chromium Embedded Framework (CEF), which appears in the Figure as Blink [22], NativeUtil, and V8 [23]. The first is responsible for cross platform compatibility and the second is responsible for accessing native resources, linking third part modules, and performing file operations.
2.3.2 Communication server
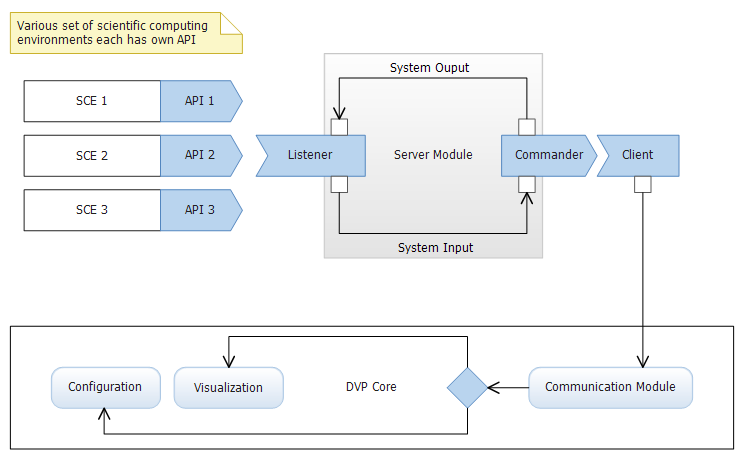
A server module, as sketched in Figure 3, acts as a middle agent between DVP and SCEs. This server module uses web sockets [24] and XML HTTP requests to establish communication between DVP and SCEs, by providing an interface for communication with system. Since the server module is using the common web sockets, any SCE can be seamlessly integrated with DVP by implementing a module that uses DVP interface provided by the system module.
The server acts as a bridge providing an interface for the DVP visualization and configuration functionalities to any other software. It even can communicate with regular programming languages like C++, Java and C#. Key SCEs, e.g., Matlab, Mathematica, and R, along with famous programmable hardware chips, e.g., Arduino and Raspberry Pi, are planned to be supported for seamless integration and communication with DVP.
2.3.3 UI application
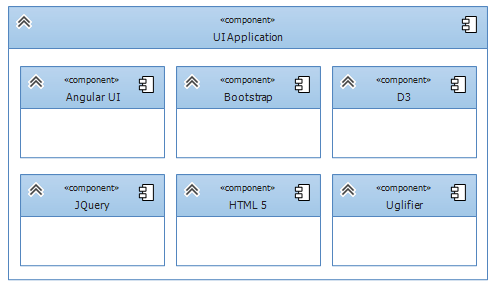
UI application, as sketched in Figure 4, is implemented as a web interface using a set of web tools and a combination of the state-of-the-art work of leading companies and technologies, e.g., Google, Twitter, and D3 [25]. The later is a newly developed library for dynamic and interactive web content. UI application will be hosted by the shell application and they will act together as a single running application providing compatibility on different operating systems and devices.
2.3.4 Large Interactive Display Solution for Big Data
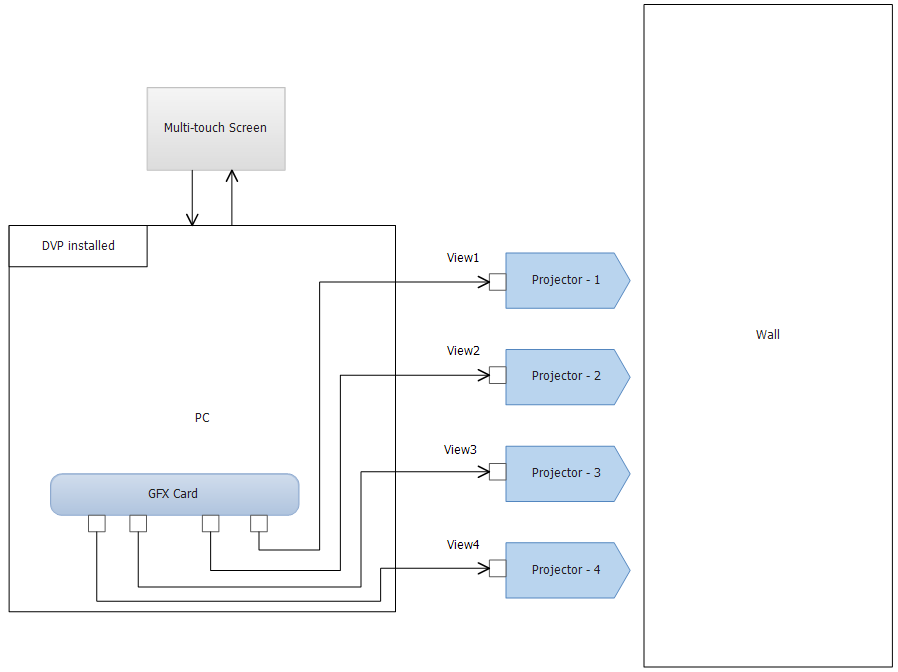
A very large display subsystem to explore big data is to be designed. System architecture is shown in Figure 5. This system projects data on an area (a wall or any white screen) covered by 4 parallel very high definition projectors. This area is estimated to be up to 100 m2. Since data is huge, rendering is divided into 4 quadrants each is processed by a giant GPU and fed into a separate projector. The whole rendered view is complied back by the 4 projectors to the very large display screen.
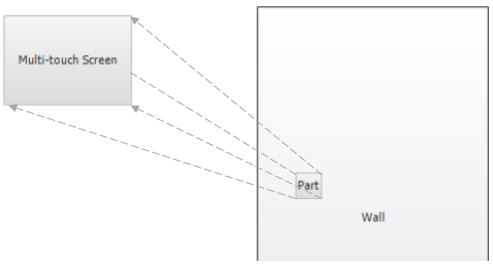
Since, it is almost impossible to interact with data on that very large screen, another large touch screen (80 inches) is connected to the system. If the analyst is interested in some portion of the data displayed on the wall he can select it for interaction on the large touch screen, which can be thought of as a magnifying glass in image processing softwares (Figure 6).
2.4 Features
In this section, we provide and explain all the planned features that the architectural design of DVP supports; we provide them in terms of user stories.
2.4.1 Communication with Scientific Computing Environments (SCEs)
DVP will provide a simple way to establish communication with scientific computing environments in order to make a link between the process of data analysis and data visualization, and also to facilitate reviewing the interpretation. A list of sub-features:
-
•
System can be attached and detached from SCE.
-
•
Connection with single or multiple instances of SCEs.
-
•
Connection can be made to SCEs within the same machine, over LAN, or even a remote machine.
2.4.2 Manipulating data
System has a set of features related to data manipulation that can be listed as follows:
-
•
Data imported will be categorized into one of three types: quantitative, categorical, or ordered categorical; this early categorization will help providing suggestion about the set of figures and plots that visualize data the best.
-
•
DVP will support most common data format used by data analysts like CSV, XML, JSON or SGML.
-
•
Data can be grabbed from online sources like Google drive, social media analytics, stock market, or even other storage types, e.g., SQL or excel sheets.
-
•
System will facilitate processing acquired using basic set of operations like merging datasets from various origins.
2.4.3 Figures
DVP provides a various set of figures and innovative visualization methodologies which have been a result of research in the field of data visualization. A list of sub-features:
-
•
System will provide UI wizard to fill figure required parameters.
-
•
Figures will have a UI selection way to create, modify, and delete groups of figure objects.
-
•
Selection groups can be created using a mapping function to the data source.
-
•
Annotations can be made to the figure itself or to one of its objects.
-
•
Annotation will include creating arrows, circles, and polygons.
-
•
Figure view can be transmitted to SCE.
2.4.4 Extensibility
Making DVP open for extensions will provide users with the power of implementing their own extension that can help them with the process of visualizing or interacting with data, and build wider community that uses DVP. This is achieved by providing a scripting language to facilitate a set of key features:
-
•
Users can develop custom plots and it can be embedded to DVP.
-
•
Also users will be able to implement transformation function that transform data before visualization.
-
•
Users will be able to develop their own parameterized visualization methods with custom interactive behavior.
-
•
Users can also implement post processors that can modify the result of visualization.
-
•
Also all customizable visualization methods will be able to take custom pre and post callbacks as parameters.
-
•
Figures will be reproducible even from the SCE by calling the written script.
2.4.5 Interactivity
Visual interaction with plots and models is a key part of visualization techniques. DVP provides a set of animated and interactive visualization methods, and most importantly provides to users a scripting language, as mentioned above, to produce their own interactive behavior. This feature is divided into:
-
•
UI scroll bar can be used to control thresholds in different visual methods that make use of them.
-
•
User can animate data points up to 2 million points in a non-interactive movie.
-
•
User can use automatic or manual calibration to change constrains of data set sizes considered big or small.
2.4.6 User interface
DVP features related to UX can be listed as follows:
-
•
DVP will be cross platform, running on the three known operating systems Windows, Linux, and Mac.
-
•
DVP will be able to run on most of tablets and smart phones.
-
•
DVP can run on multi-touch screens.
-
•
DVP will support running on multiple screens with providing a way to manage distributing figure among various screens.
-
•
DVP will provide the ability to toggle between free and docked figure.
-
•
DVP will be able to use pre defined set of hand gestures as a means of input.
2.4.7 Exporting visual models
DVP will provide methods to export visual models into the following forms:
-
•
Images with raster format supported by imagemagick.
-
•
Images with SVG vector format.
-
•
Interactive PDF document to encapsulate visualization with reporting.
-
•
Print a single figure or multiple figure to any paper size.
2.4.8 Web access
The system will access web to do the following tasks:
-
•
Store user session information so that user can reload this session later from any machine.
-
•
Save and share current visual models with colleagues or partners using web as if it is a web post.
2.4.9 Business dashboards
-
•
DVP will provide creating both local-machine and online business dashboards with multiple interactive linked figures.
-
•
Dashboards created by DVP can obtain data from web or local data sources.
-
•
Importing data from SQL storage servers to dashboards can be done with a UI wizard without writing any SQL code for the convenience of non-technical oriented users.
3 Global System Architecture and Design
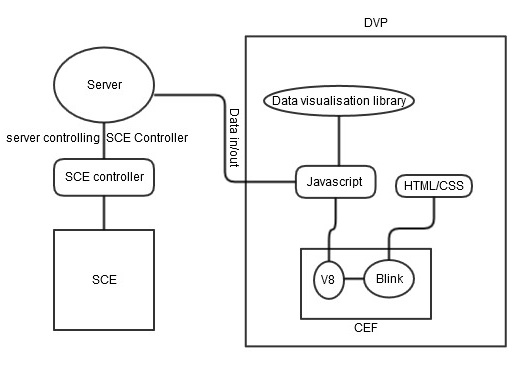
The main target of the design is to create an extensible, easy to use, beautiful visualization platform that integrates seamlessly with all Scientific Computing Environments (SCEs). The current DVP design consists of a Plugin written in Java for the intended SCE, a web server that uses JSON serialization, and the DVP itself built with Web technologies running on CEF (Figure 7). In this section, we first introduce the technologies used for the rest of the paper (Section 3.1). Then we go over several design alternatives and approaches to document some design decisions that we have taken to finally reach this design of DVP.
3.1 Technical background to DVP low level design
3.1.1 D3js
D3 [26] is a Javascript library created by Mike Bostock [27] for visualization. It implements a Data-Driven Document model which works by associating data with DOM elements, in order to facilitate common visualization tasks such as selection, manipulation, addition and deletion of data points. It implements the model using a syntax similar to that of jQuery [28] which facilitates chaining several actions on a data set in one line call. This “chaining” is not just syntax sugar, in fact it has a large effect on performance because browsers can optimize consecutive rendering/relayout/repaint/restyle calls [29].
D3 uses SVG standards introduced with HTML5 for drawing elements. SVG primitives are represented as DOM elements, which allows for using any existing Javascript/CSS libraries to manipulate/style the visualization elements. As an example, attaching an image to a data point represented as a circle in a scatter plot would be as easy as just adding an <img> tag to the circle DOM. Modern browsers can be seen as powerful and efficient rendering engines which is a fact that D3 leverages. However, creating so many DOM elements causes problems with visualizations requiring more than 200,000 elements as seen on our hardware and benchmarks; however, rendering performance does scale with hardware.
3.1.2 Google Chrome
Google Chrome is a modern web browser built by Google. It is multi-threaded and has powerful Javascript and rendering engines which leverage hardware acceleration through GPUs. Google Chrome is based on an open source project called Chromium [30]. There exists a sub-project called Chromium Embedded Framework [31] which is a framework for embedding Chromium-based browsers in other applications. CEF is available as Dynamic Link libraries which one can use to build applications. A new version of CEF is automatically generated for every new version of Chromium through automated code extraction scripts. DVP is built using CEF.
Chrome, Chromium, CEF, all share the same codebase, and the same Javascript/rendering engines, they are in fact at the core, the same thing. They only differ in GUI; Chrome comes with Gmail account synchronization and some other Google services. Chromium has very similar UI but with some few features stripped out. CEF is a DLL. The GPU accelerated compositing [32] of Chromium and its powerful rendering engine, Blink [33], are the reason we currently use CEF.
3.2 General Design Overview
We believe that a client-server model should suffice for the needs of our system. The SCE acting as the server, and a separate process called DVP which will run the visualization code acting as the client. Both processes would then communicate through a serialization interface or Remote Procedure Call (RPC). Following are some aspects to be considered:
-
1.
Due to the different nature of each SCE in terms of available datastructures, language and features, a special component or plugin should be built for each one but have a unified interface with a uniform serialization specifications to reduce the SCE specific code required in the DVP component. This component should be built with maximum re-usability in mind to avoid redundant design and coding.
-
2.
The DVP as a platform should be built with extensibility and re-usability in mind to account for the different scenarios of communication with different SCEs and user-added features/figures.
3.3 Comparison of Platforms
3.3.1 SCE Plugins
SCE plugins can be written in different languages depending on each SCE design. But for the 3 main SCEs we target, namely, Matlab, Mathematica and R, it can be written in:
-
1.
The SCE Language itself.
-
2.
C++.
-
3.
Java.
Writing the plugin in the SCE language itself means having to rewrite it from scratch for every SCE; therefore having a high development and a high maintenance cost, and in some cases, inferior performance to other 2 options. C++ is of course minimalistic and fast, however being native adds a high maintainability cost, which can be avoided with Java, without sacrificing a lot of performance. Depending on the DVP language and architecture, different serialization or RPC methods can be used, each one has its pros and cons, however their impact thus far is not large. We discuss them and their effects on our current design in Section 6.1.
3.3.2 DVP
To build the DVP itself, we had to choose between different languages and platforms. It can basically be built with anything, Java, C++, Javascript or even one of the SCEs. What follows is a discussion of each platform and what it has to offer.
Java
has a cross-platform GUI framework, however its performance in visualization is weak. Therefore to build a visualization tool using Java would require the use of OpenGL, or any Java library or framework building upon it. There exists a programming language with a small platform built for it for visualization using Java called Processing [38]. It was developed by MIT media labs. Even though it has a lot to offer, it was found that building unique interfaces with rich features would require a lot of development effort using it, as compared to other platforms like D3. Also, there exists a Javascript port for the language.
C++
is needless to say it offers the best performance when it comes to speed and efficiency. However, both the development effort required to build the visualization library, the rich interfaces mentioned in the user-stories, and in order to offer the level of extensibility required, it would be very expensive and difficult to both design and build. However C++ may be considered for visualizing large data samples or integrate with native components or libraries needed by our system later on.
SCE Language
One could consider building the visualization platform using one of the free SCEs, like R for instance and taking advantage of the familiarity of the users with it, and take advantage of the primitives already existing. However, this would limit the scope of the product to only scientific applications. Also this would limit the user-base to only those who know that specific SCE and limit the performance of the visualization algorithms to that of the SCE’s GUI rendering engine.
Web technologies
The introduction of SVG standards in HTML5 and the evolution of libraries such as D3, has given Javascript a large set of capabilities when it comes to visualization. Modern browsers are very powerful rendering engines which enables Javascript to render large datasets with ease and take advantage of hardware acceleration. Javascript is also arguably the most popular programming language, which means a very large user base; and since Javascript is an interpreted weak typed language, extensibility design would be very easy. The only shortcoming of this approach is the access to native libraries such as OpenCV, or those needed to integrate with certain hardware like Arduino for instance. However, Chromium and its embedded framework provide a very feasible solution for this issue by allowing for Javascript to execute C++ functions through V8 and retrieve data in a native Javascript format. This means that Javascript can access any memory available to C++. Another problem is handling massive data. By design, Javascript arrays can only have 32 bit indices; this means it cannot handle data with more than 2 billion points. But for such data, a native visualization library would be needed anyway for special visualization. Therefore, a solution would be to have 2 modes: a full interactive mode and a simple heavy visualization mode, where the heavy visualizations would be done through a separate native libraries with specially optimized algorithms.
3.3.3 Javascript and render engines
If Web technologies will be used as a platform for DVP, this needs a further comparison among Javascript/render engines. This comparison revealed that webkit is by far a head in performance if compared to gejko.
3.3.4 Platforms using Webkit and V8
According to what is mentioned in Section 3.3.3, we choose Webkit and v8 to be the DVP engines. This give us another set of options to be compared below.
Google Chrome
- pros
-
-
•
no build problems.
-
•
more portable.
-
•
- cons
-
-
•
no shared memory.
-
•
no advanced integration with javascript since it is closed box run on the web browser.
-
•
cannot handle big data because of lake of control over it.
-
•
no security.
-
•
restrictions on javascript access.
-
•
Chromium
- pros
-
-
•
every con in Google Chrome, above, can be alleviated here.
-
•
- cons
-
-
•
maintenance problem with the update as we must remove google things every time to be up to dated.
-
•
cross platform build requirements.
-
•
CEF
- pros
-
-
•
every con for Google Chrome, above, can be alleviated here.
-
•
no maintenance problem.
-
•
- cons
-
-
•
cross platform build requirements.
-
•
CEF variants
Many development platforms have been built around it, some for desktop development, some for server development, and even some for mobile development. We have decided to go with native simple CEF; however below we keep the discussion and list other forks that we considered.
Crosswalk [39]
is maintained by Intel. It is mainly intended for mobile development and that is where their main development and support goes; therefore it is a viable option when developing the mobile interface.
Awesomium [40] & Tide SDK [41]
Awesomium is a commercial library, built on top of CEF; it offers an SDK with some built-in functionality. It is just like TideSDK; however building on top of such libraries exposes us to bloat, less flexibility in design, and restrictions. E.g., we will be neither able to update nor develop using new features of CEF as soon as they come out (see Section 4.3 for a real usecase).
NodeJs [42]
is a headless V8 engine with no rendering engine such as webkit. Of course this cannot be used directly for visualization; however NodeJs, can act as a very strong server with rich access to native libraries since NodeJs already integrates with a lot of native libraries. However, integrating it with CEF is very difficult and done by applying patches to direct9 source code such as cefode project [43].
Node Webkit [44]
integrates NodeJs with Chromium. Unfortunately, Node Webkit has its own “packaging” system and your app is “packaged” into a special zip format, and it has its own GUI library that builds on top of that of Chromium. Modifying it would be a lot of work. Using most of the libraries munitioned above would offer little help with the DVP development; however the cost of maintainability and control over CEF components and updating would be too high. That is why we resorted to using plain CEF since it meets all the DVP design philosophy aspects.
4 Chromium Embedded Framework (CEF)
This section discusses CEF and all its related issues in depth. This section provides many technical details that seems to be out of scope of the present article. However, we would like to illustrate them because they very much relate to the high level objectives and philosophy of DVP. So, down the rabbit hole we go.
4.1 Getting Started
The CEF project is overall poorly documented; however, project wiki [45] is a good place to start. Some tutorials, e.g., [46, 47], provide a good introduction to most of the functionalities provided by CEF. Some forums, e.g., [48], is also a good resource for help. However, for too many hits questions are left unanswered.
Upon downloading and extracting the binary packages, the sample application can be built using the provided build.sh file on Linux or using the sln file on Windows. These project files are automatically generated through “Generate Your Project” (GYP) [49] scripts; editing these files is quite tedious. Also, editing the GYP files is not possible without downloading almost all of Chromium source. For those reasons, we decided to build our own build scripts using CMake [50] to allow for consistent cross-platform build.
4.2 Building Upon CEF
CEF comes with two sample applications: CefSimple and CefClient. The first is a minimalistic window with a single frame. The second implements almost all of CEF features. We decided to build upon the CefSimple instead of stripping out the CefClient.
Both of CEF sample applications have 3 versions; one for each of Windows, Mac and Linux. It uses native window toolkits on each of those platforms. We wanted to build a cross-platform application; and doing so requires building the GUI 3 times. We know that, by DVP design, the UI will mostly rely on Javascript; however, in the future when adding heavier methods that require, e.g., OpenGL, we might need to build some native controls outside the CEF frame.
Therefore, we decided to use wxWidgets, which is a library built as an abstraction layer on top of native libraries of each platform: windows forms for Windows, GTK for Linux, and Cacoa for Mac. However embedding CEF still requires a native applet, e.g., gtk_vbox, which required digging inside wxWidgets and finding a control that exposes such an applet and extracts a reference to it. This is discussed further in Section 4.4.1.
Also, for some unknown forsaken reason, CEF includes its header files using relative paths, i.e. quotation. This destroys any dreams of building outside the directory of CEF since it requires maintaining the hierarchy where the includes are located. As a solution, we created a CMake file in intended directory, and built everything relative to that path. However, CMake supports out of source directory build, so everything is built into __build.
4.3 Encoding Problems
After CEF is embedded into wxWidgets, we wanted to integrate it with other libraries such as OpenCV to be accessible from Javascript. This required delving into a larger problem, which is encodings. Javascript is not designed to handle binary data. Although typedarrays [51] do exist in Javascript and are supported by all of Chrome variants including CEF, which does not expose an interface for creating these arrays from C++ [52]. The best way to pass binary data, as advised by Google support, is surprisingly by creating an XHTML request, and catch it [52]. The available options for passing binary data are through:
- an XHTML request,
-
which is the worst option in terms of performance, design and implementation.
- encoding into strings,
-
which is implied by the first option. It is similarly bad in performance but not in design.
- converting everything into normal float arrays,
-
then passing that instead. This is feasible, with acceptable performance. However, the overhead of copying data can sometimes be unacceptable if the data size is large.
- direct Proxies [53],
-
which is a sort of overloading the Javascript [] operators using a C++ function; i.e. when arr[0] is executed, a C++ function is called with the parameter “index” with value 0, so we can really make Javascript access any block of memory available to C++ using pointers. Now, Javascript arrays are C++ pointers. That is really cool, but not so fast!
Proxies are a part of ECMA 6, and that is not fully implemented nor supported in Chrome variants at the time of releasing the first version of DVP [54]. However, incomplete support for it is provided through an experimental feature, which is turned on by passing the --harmony flag to V8 and using a library [55] to account for the missing features. However, this should be fixed in later versions after the launch of ECMA 6.
4.4 Integrating Libraries with CEF
4.4.1 wxWidgets
As mentioned above, wxWidgets is an abstraction layer built on top of each platform native window toolkit. This means that using wxWidgets requires using the native windows at the end of the day. However, if, at some point, a direct access is required into the native toolkit objects, a hack or extend is needed. This hacking/extending will be a platform specific code. Since hacking solution was not only disastrous but also quite tedious (since almost none of wxWidgets panels uses gtk_vbox on linux), we decided to extend it. However, even that required a little hacking of its own since its extension is neither documented nor standard.
4.4.2 wxWidgets render Loop
CEF requires a blocking call for its event and render loops to start; this call blocks until CEF is shutdown. This caused a problem with wxWidgets because it required the need for launching another thread for that function to be called from. The optimal solution however is to integrate CEF loop with wxWidget render loop. wxWidgets starts its render loop using a macro; however, it can be overridden to let your own render loop see Making render loop [56]. This required a lot of work. Rather, we proceeded by starting the CEF thread in an event call. Events are multi-threaded but safe(r) when interacting with wxWidget GUI components [57]; until now, no complications have occurred.
Extending wxWidgets on Linux
After diving into the abyss of wxWidgets implementation for linux, we emerged with the fact that there exists a variable named m_widget, which contained the actual GTKWidget being used by any control that inherits from wxControl. However, some solution is already available and posted on wxWidgets forums [58].
Building Problems on Linux
wxWidgets is built using AutoTools, then installed into a folder of choice with symbolic links to compiled files. We wanted to specify the build to use the wxWidgets build available in our repository instead of that coming with linux distros. There exists a CMake variable called wxWidgets_ROOT_DIR, which turned out to work only on Windows. In addition, it turns out that wxWidgets comes with its own wx-config file which is similar to pkg-config. Therefore, it is necessary to specify this file using the CMake variable wxWidgets_CONFIG_EXECUTABLE. Another issue is that wxWidgets adds an isystem flag to the compiler parameters automatically for some reason. This of course destroys any attempt to compile. The only way to disable it is setting the variable wxWidgets_INCLUDE_DIRS_NO_SYSTEM to true.
4.4.3 OpenCV
There are two ways to export OpenCV into Javascript: (1) by making a full fledged interface, with matrix objects that resembles OpenCV Mat class (this is the way nodeJs OpenCV package does it), (2) or by making a limited set of functionality that is called through functions. By the time of releasing the first version of DVP, we have only created a limited set of functions as a proof of concept. Encoding images is also one of the main issues with OpenCV, since Javascript can only handle images encoded in base64 strings, which required using external libraries to encode such images. However, an alternative solution [59] is to use a canvas to display images, and supply it with a typedarray. Also, this can possibly be mixed with a Proxy to avoid copying, which we never investigated yet.
5 Javascript Application
DVP is a standalone application that we had planned to write using web technologies (HTML5, CSS/CSS3, and Javascript) and C++ as its backend using CEF integration. As we mentioned earlier, our general architecture for DVP is a client-server model. This should not lead to the wrong conclusion that DVP cannot run without server side component. It should be very clear that client-server architecture has been chosen to handle SCE integration with DVP; in addition, DVP can run as standalone application without the need for any server side component. On the other hand, had we opted to use something like nodeJS as our backend, DVP would become client-server application. In this section we will compare the different Javascript frameworks and different ways for figure drawing; also, we will elaborate on architecture and on how user requirements are fulfilled.
5.1 Comparison of Web Technologies
5.1.1 Javascript, AngularJS, and HTML
HTML is great for declaring static documents; however, it falters upon using for declaring dynamic views in web-applications. AngularJS allows for extending HTML vocabulary for applications. The resulting environment is extraordinarily expressive and readable with quick develop rate. Other frameworks deal with HTML shortcomings by either abstracting away HTML, CSS, and/or JavaScript on a hand; or by providing an imperative way for manipulating the DOM on the other hand. Neither of these addresses the root problem of that HTML was not designed for dynamic views. AngularJS is a toolset for building the framework that is most suited to application development. It is fully extensible and works well with other libraries. Every feature can be modified or replaced to suit a unique development workflow and feature needs. For more details check angular website [60]
5.1.2 HTML5 Draw types and libraries
Scalable Vector Graphics (SVG)
is used to define vector-based graphics for the Web without sacrificing any quality if they are zoomed or resized. Every element and every attribute in SVG files can be animated; it is easy to make very high interact-able figure.
Canvas
is a raster graphics that is mush faster in drawing; however, it will be too hard to make high interactive figures with it.
When SVG? When Canvas?
We decided that we will make two flows for our application: one using SVG that will be very highly interactive with full features but will have limitations on data size. The other flow will use canvas and will have limited interactive figures but can handle huge data size.
Why D3?
for the SVG flow, D3 is a mature library for drawing interactive figure with very rich ready-made examples and figures.
5.2 Architecture
The application-side architecture should not be confused of course with the architecture discussed in Section 3. There are three main components of the application-side architecture:
- User Interface (UI)
-
should provide excellent user experience. Its implementation relies heavily on mastering:
-
•
Jquery, CSS, HTML.
-
•
Angular and data binding.
-
•
- Core
-
is related to how we mange the underlying layers of application like validation, SCE integration, CEF integration, etc. Its implementation relies heavily on mastering:
-
•
javascript.
-
•
Object Oriented Design (OOD).
-
•
dependency injection design pattern.
-
•
Angular and its services.
-
•
- Figures
-
is related to how the figures themselves, which the user will interact with, are created. Their implementation relies heavily on mastering:
-
•
D3.
-
•
Jquery.
-
•
Angular
-
•
how render engines works.
-
•
data visualization foundations, e.g., geometry, probability statistics, linear algebra, etc.
-
•
5.2.1 Core
This component should:
-
•
manage the underlying layers of the application that the UI reflects.
-
•
keep the system in consistent state by validating every input/output action and by providing both the data structure and logic to handle this.
-
•
integrate with anything outside the javascript application, e.g., SCE or CEF.
Therefore, and because of the lack of classes and OOP in javascript, we had to take care of several technicalities as follows.
Data Structure
Simple lists have javascript objects; each object has a definition for its fields and a unique filed that is used to store/access/delete the object in the list. The unique field name will be given as a parameter in the list constructor. In principle, although not needed so far, the object may have a field that needs a special data structure.
Validation
we need to construct a lot of things:
-
•
object duplication.
-
•
definition for each object type; e.g., data-source object definition is id, name, data, ColumnNames, ColumnTypes.
-
•
validation that each object related to specific type has the required fields to be added in the system.
-
•
validation of required fields values.
OOP
we need to reinvent almost everything in this regards. Validation class has all the required functions to validate an object according to a given set of parameters. List class, a service in angular, can add/delete/modify/validate the Object to the list. This is in addition to some other utilities, e.g., checking for element existence. Its constructor takes object definition, key field name, and list name as parameters. A class X will inherit the class List then add/overload other functions if needed
SCE integration
For integration with SCEs, we simply need to establish the two-way communication between DVP and the SCE. Therefore, we need to send commands from DVP (or SCE) to SCE (or DVP). As mentioned earlier we are following client/server model to handle this communication using JSON objects passed between DVP and SCE. From DVP side we use AJAX functions from JQuery to handle post requests and SSE to handle get requests. Alternatively, the angular service, HTTP, could be used; however, we found that the SCE plugin does not work with this approach, which may need more debugging.
- To receive commands
-
from core architecture mentioned above, e.g., to create a figure, it is only required to get information from the user, construct it in a javascript object, and pass it to the core to be validated and added. Therefore, to receive commands from SCE, there will be a protocol to define the kind of operation needed then pass the object constructed, by the SCE plugin (Section 6), from the user input to the related function in the core; e.g., figure.add(constructedObject). The protocol is also an object definition since it is a JSON object.
- To send commands
-
this is established via ajax post function, which is very straightforward.
6 SCE Plugin
6.1 Data Serialization Options
Since Javascript cannot handle binary data, some sort of serialization is necessary. However, serialization could deteriorate performance with larger datasets. Several serialization methods are possible:
-
•
JSON and its binary variant BSON.
-
•
Google Protocol Buffers [61].
-
•
Protocol Buffer’s Author’s Cap’n Proto [62].
-
•
Previously Facebook, now Apache, Thrift [63].
-
•
Apache Aciteve MQ [64].
-
•
Shared Memory.
Each option has its own pros and cons. The first option, JSON, is the one we currently use. It is the most straightforward and native to Javascript. In addition, we do not observe performance issues at the moment; the time consumption is still acceptable at a matrix size of 200,00050. Other libraries use specific formats; porting them to handle Matlab objects is cumbersome. On the other hand, Cap’n Proto seems very promising since it does not serialize; rather, it just copies bytes in a cross-platform manner.
6.2 Current Implementation
6.2.1 Overview
We have used Jetty because it is minimalistic, small, extensible, and sufficient for our purposes. The designed servlets architecture is meant to be as much extensible and reusable as possible. Adapting these servlets for any SCE should be trivial as discussed in section 6.2.2. For Matlab control, there are many approaches [65]. We have decided to go with “MatlabControl” since it is simple, straightforward, and it works on existing opened sessions without the need to open a new session.
6.2.2 Some low-level details
Component Structure
DVTWebServerInterface is the entry point of the component; it can be extended to modify logic or add functionality for any SCE type if desired. E.g., we have extended it using MatlabDVTServerInterface only to call the constructor with the $sceName parameter and to specify the server post service sse and to specify the default $serializationType (json) since java dose not support compiler directives. DVTWebServerInterface initializes 4 servlets: DVTNewDVTIdServlet, DVTSCEJsonServlet, DVTEventSourceServlet and DVTEventSourceReplyServlet; then maps them to the urls welcome, $sceName, sse, sse-reply.
DVTNewDVTIdServlet is responsible for handshaking with DVP and sending configurations to it including the urls to which all other servlets are mapped. It sends an object of NewDVTIdMessage from messaging serialized in $serializationType. It is also responsbile for assigning IDs to DVP; however, this is done automatically when creating a new NewDVTIdMessage; the ID of the message is thread-safe auto-incrementing.
DVTSCEJsonServlet is responsible for all interfacing with SCE, connection, disconnection, evaluation, and storing variables. It does not need to be extended, e.g., to add support for other SCEs. Rather, simply implement SCEJsonInterface and inject it into the constructor. It talks to DVP through an SCEEvalMessage from messaging serialized in JSON. One possibility is to make an abstract parent class and extend it to save any redundant code in several SCE communication servlets implementing different $serializationType.
DVTEventSourceServlet is responsible for registering SSE connections with and sending SSE events to DVP. It extends jetty implementation of SSE servlet (located at ./org/eclipse/jetty/servlets/EventSource*.java). When an SSE request is sent, it is assigned a thread-safe ID and added to a thread-safe list. DVTEventSourceReplyServlet uses this ID to check for replies to this specific request.
DVTEventSourceReplyServlet is responsible for accepting replies to SSE requests and doing blocking waits for the replies (if required) using thread-safe lists and IDs supplied to it and obtained from DVTEventSourceServlet. Yet, another important to-do task is to make sse message an sse json message. Next, for more clarification, we provide a simple scenario for SSE workflow.
-
1.
SSE initialization is requested by DVP; eclipse implementation calls the function newEventSource, which is an abstract and implemented in this class, and the DVP is added to $eventSources list in DVTEventSourceServlet.
-
2.
SSE request is sent through the function sendDataToDVTClient in DVTEventSourceServlet, the request is assigned a static thread-safe ID that is created once an instance of SSEMessage from messaging is created.
-
3.
The SCE calls waitForSSEReply in DVTEventSourceReplyServlet, providing it with the request ID returned from sendDataToDVTClient and the DvpId. The servlets blocks with a timeout, checking for the thread-safe list for the request arrival.
-
4.
DVP sends a reply to the sse-reply url, and an instance of SSEReplyMessage is created and added to the thread-safe list, which is checked in the waitForSSEReply.
SCEJsonInterface, an interface with SCE, provides connection, disconnection, evaluation and storage functionalities. It is required for use in DVTSCEJsonInterfaceServlet. Another to-do task is to make an abstract parent and extend it to handle other $serializationType. Classes/Interfaces needed to be implemented/extended to add functionalities for other SCEs.
7 Conclusion and Future Work
This article presented the design and implementation of DVP, a Data Visualization Platform, with an architecture that attempts to bridge the gap between the Scientific Computing Environments (SCE) that analyze data and Data Visualization Software (DVSW) that visualize data. DVP is designed to connect seamlessly to SCEs to bring the computational capabilities to the visualization methods in a single coherent platform. DVP is designed with two interfaces, the desktop standalone version and the online interface. A free demo for the online interface of DVP is available [1]. Although the architecture of DVP is flexible to allow for integration with any SCE, the current implementation is only provided for Matlab. The future version of DVP is an open-source version that integrates with Python to provide wider support for the whole Python community, in general, and for the “Data Science” community in particular.
References
- [1] [Online]. Available: http://dvp.mesclabs.com/
- [2] C.-h. Chen, W. Härdle, and A. Unwin, Handbook of data visualization. Berlin: Springer, 2008.
- [3] E. J. Wegman, “Visual Data mining,” Stat Med, vol. 22, no. 9, pp. 1383–1397, 2003. [Online]. Available: https://doi.org/10.1002/sim.1502
- [4] ——, “The Grand Tour in k-Dimensions,” in Computing Science and Statistics. Statistics of Many Parameters: Curves, Images, Spatial Models. Proc. 22nd Symposium on the Interface. Springer-Verlag, New York, 1992, pp. 127–136.
- [5] A. Inselberg, “Visualization & Data Mining for High Dimensional Datasets: tutorial,” Unpublished Work, 2011.
- [6] A. Inselberg and T. Avidan, “Classification and visualization for high-dimensional data,” Boston, Massachusetts, United States, 2000. [Online]. Available: https://doi.org/http://doi.acm.org/10.1145/347090.347170
- [7] A. Inselberg, “Visualization and Data Mining of High-Dimensional data,” Chemometrics and Intelligent Laboratory Systems, vol. 60, no. 1-2, p. 147, 2002.
- [8] V. S. Cherkassky and F. Mulier, Learning from data : concepts, theory, and methods. New York: Wiley, 1998.
- [9] K. Fukunaga, Introduction to statistical pattern recognition, 2nd ed. Boston: Academic Press, 1990.
- [10] T. Hastie, R. Tibshirani, and J. H. Friedman, The elements of statistical learning : data mining, inference, and prediction. New York: Springer, 2001.
- [11] C. M. Bishop, Pattern recognition and machine learning. New York: Springer, 2006.
- [12] V. N. Vapnik, The nature of statistical learning theory, 2nd ed. New York: Springer, 2000.
- [13] ——, Statistical learning theory. New York: Wiley, 1998.
- [14] [Online]. Available: http://www.arduino.cc/
- [15] [Online]. Available: http://www.raspberrypi.org/
- [16] L. Wilkinson, D. Wills, D. Rope, A. Norton, and R. Dubbs, The Grammar of Graphics. Springer Science & Business Media, 2006.
- [17] H. Wickham, Ggplot2 : elegant graphics for data analysis. New York: Springer, 2009.
- [18] A. Inselberg, Parallel coordinates : visual multidimensional geometry and its applications. New York: Springer, 2008.
- [19] [Online]. Available: https://atom.io/
- [20] [Online]. Available: http://brackets.io/
- [21] [Online]. Available: http://lighttable.com/
- [22] [Online]. Available: http://www.chromium.org/blink
- [23] [Online]. Available: https://code.google.com/p/v8/
- [24] [Online]. Available: https://www.websocket.org/
- [25] [Online]. Available: http://d3js.org/
- [26] M. Bostock, V. Ogievetsky, and J. Heer, “D3: Data-Driven Documents.” IEEE transactions on visualization and computer graphics, vol. 17, no. 12, pp. 2301–9, dec 2011. [Online]. Available: https://doi.org/10.1109/TVCG.2011.185
- [27] [Online]. Available: http://bost.ocks.org/mike/
- [28] [Online]. Available: {http://goo.gl/hr8y8e}
- [29] [Online]. Available: http://www.phpied.com/rendering-repaint-reflowrelayout-restyle/
- [30] [Online]. Available: http://www.chromium.org/
- [31] [Online]. Available: https://code.google.com/p/chromiumembedded/
- [32] [Online]. Available: http://www.chromium.org/developers/design-documents/gpu-accelerated-compositing-in-chrome
- [33] [Online]. Available: http://goo.gl/hr8y8e
- [34] [Online]. Available: https://code.google.com/p/protobuf/
- [35] [Online]. Available: http://kentonv.github.io/capnproto/index.html
- [36] [Online]. Available: https://thrift.apache.org/
- [37] [Online]. Available: http://activemq.apache.org/
- [38] [Online]. Available: http://goo.gl/ulgDf
- [39] [Online]. Available: http://crosswalk-project.org/
- [40] [Online]. Available: http://www.awesomium.com/
- [41] [Online]. Available: http://www.tidesdk.org/
- [42] [Online]. Available: http://nodejs.org/
- [43] [Online]. Available: https://github.com/zcbenz/cefode/
- [44] [Online]. Available: https://github.com/rogerwang/node-webkit
- [45] [Online]. Available: https://code.google.com/p/chromiumembedded/w/list
- [46] [Online]. Available: https://code.google.com/p/chromiumembedded/wiki/Tutorial
- [47] [Online]. Available: https://code.google.com/p/chromiumembedded/wiki/GeneralUsage
- [48] [Online]. Available: http://www.magpcss.org/ceforum/
- [49] [Online]. Available: https://code.google.com/p/gyp
- [50] [Online]. Available: http://cmake.org/
- [51] [Online]. Available: https://developer.mozilla.org/en-US/docs/Web/JavaScript/Typed_arrays
- [52] [Online]. Available: http://www.magpcss.org/ceforum/viewtopic.php?f=6&t=10609
- [53] [Online]. Available: http://wiki.ecmascript.org/doku.php?id=harmony:direct_proxies
- [54] [Online]. Available: https://code.google.com/p/v8/issues/detail?id=1543#c37
- [55] [Online]. Available: https://code.google.com/p/v8/issues/detail?id=1543#c36
- [56] [Online]. Available: http://wiki.wxwidgets.org/Making_a_render_loop
- [57] [Online]. Available: http://docs.wxwidgets.org/trunk/overview_thread.html
- [58] [Online]. Available: http://forums.wxwidgets.org/viewtopic.php?f=23&t=24249#p132286
- [59] [Online]. Available: https://hacks.mozilla.org/2011/12/faster-canvas-pixel-manipulation-with-typed-arrays/
- [60] [Online]. Available: https://angularjs.org/
- [61] [Online]. Available: https://code.google.com/p/protobuf/
- [62] [Online]. Available: http://kentonv.github.io/capnproto/index.html
- [63] [Online]. Available: https://thrift.apache.org/
- [64] [Online]. Available: http://activemq.apache.org/
- [65] [Online]. Available: http://code.google.com/p/matlabcontrol/wiki/ApproachesToControl
- [66] [Online]. Available: https://github.com/mbostock/d3/wiki/Gallery
- [67] E. Wegman, “Hyperdimensional Data Analysis Using Parallel Coordinates,” Journal of the American Statistical Association, vol. 85, no. 411, pp. 664–675, 1990.
- [68] [Online]. Available: http://bl.ocks.org/mbostock
- [69] [Online]. Available: http://christopheviau.com/d3list/
Appendix A Background, Tutorials, and Motivation From Textbooks
This section is a very short account and tutorial on data visualization and graphics, taken almost from textbooks, that includes history, importance and motivation for exploratory data analysis and Grammar of Graphics (GoG). It is important for a reader who is not fully acquainted with the field; however, it can be trimmed out from the manuscript without affecting its coherence.
A.1 History and Evolution of Graphics
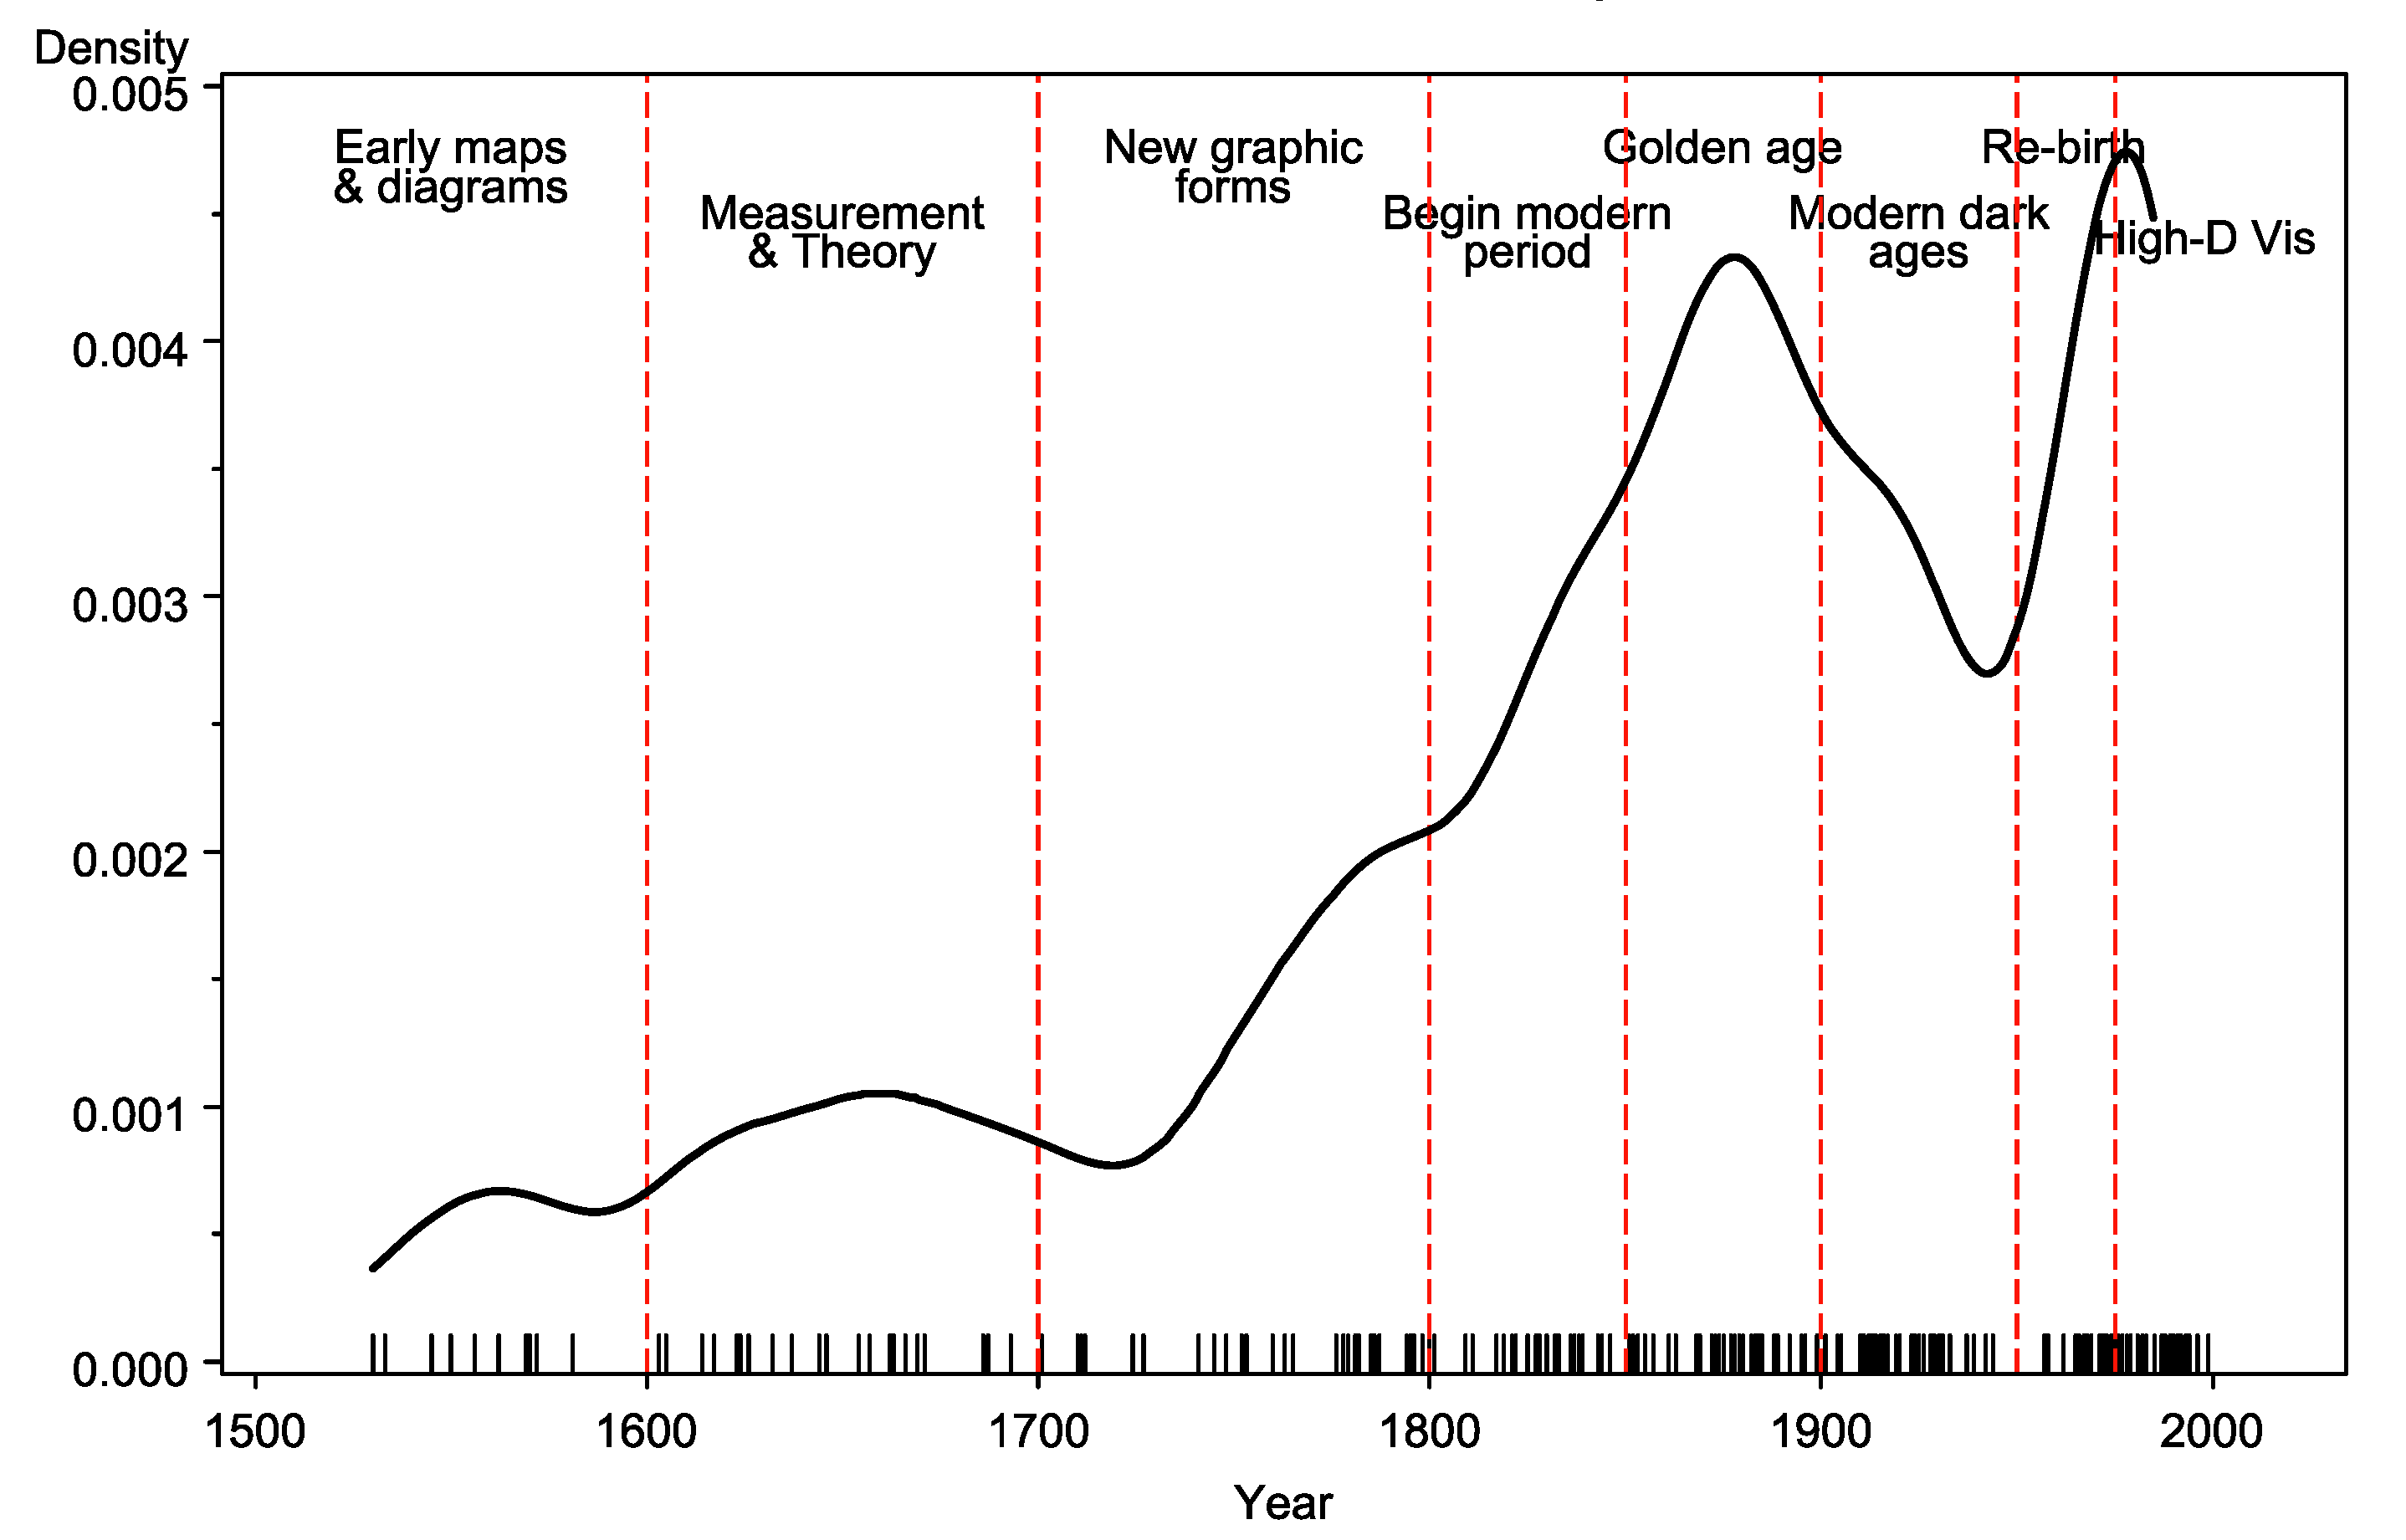
Figure 10, [which appears in 2, as Figure 1.1] provides a graphic overview of the evolution of data visualization presented as density of major developments in the field over time. The epoch of 1850–1900 was named the “golden age” for the many innovations in graphics and thematic cartography that took place for understanding data. The epoch of (1900–1950) was named “modern dark age” for the decline in graphics and visualization development as a result of the rise of quantification and formal models and tendency to quantize and formalize things. The epoch of 1950–1975 was named the “rebirth of data visualization” as a result of the great developments known in the literature by Exploratory Data Analysis (EDA) that connects visualization to analysis and quantification. The epoch of 1975–2000 was named “high-D interactive and dynamic data visualization” for invention of many new methods of visualization, interaction, new methods of visualizing high dimensional data, etc.
On the other hand, “Computing advances have benefited exploratory graphics far more…The importance of software availability and popularity in determining what analyses are carried out and how they are presented will be an interesting research topic for future historians of science…In the world of statistics itself, the packages SAS and SPSS were long dominant. In the last 15 years, first S and S-plus and now R have emerged as important competitors. None of these packages currently provide effective interactive tools for exploratory graphics, though they are all moving slowly in that direction as well as extending the range and flexibility of the presentation graphics they offer.”[2]. We add Matlab and Mathematica, which are two very important and powerful data analytic software, to this list.
A.2 Exploratory Data Analysis: importance and example on
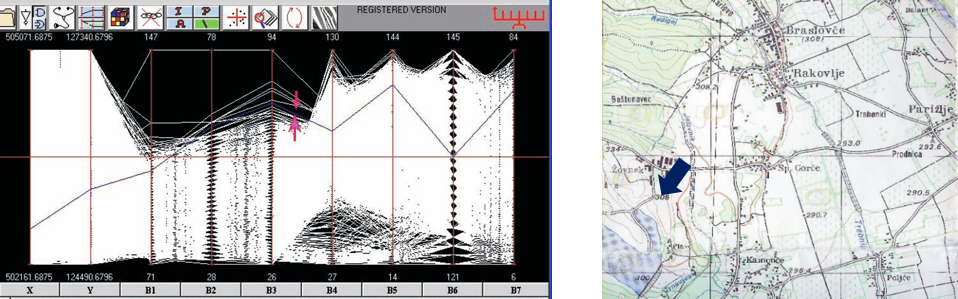
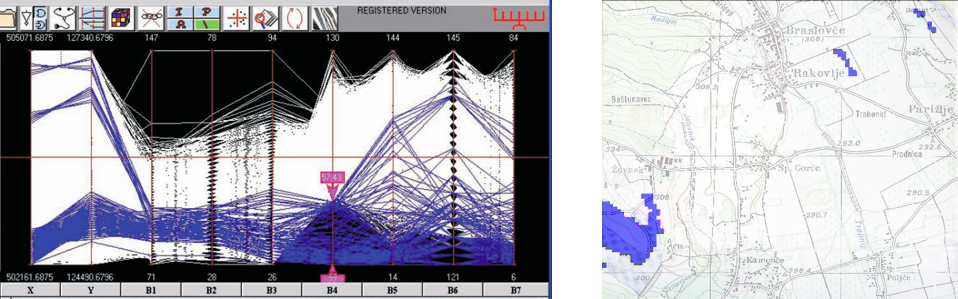
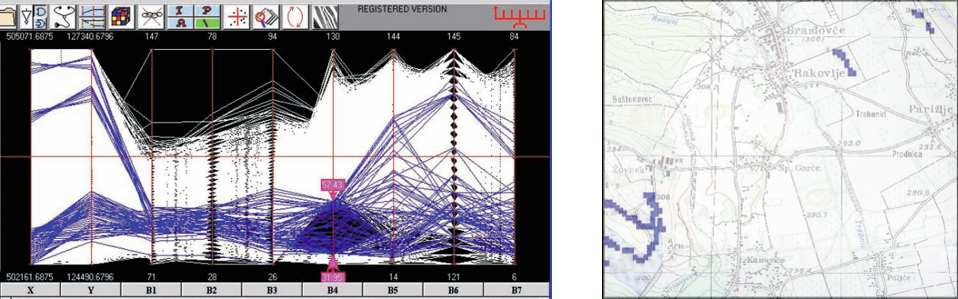
This section conveys both the scientific need and the financial opportunity for a sound and elaborate data visualization software. We borrow Figure 8 with little modification from [18, Sec. 10.2.2]. This dataset is part of hyper spectral satellite data for a portion of Slovenia, in Europe. The map of that portion is on the right of Figure 8. The dataset consists of 9 dimensions and 9,000 observations. Each observation represents a point on the map with 2 dimensions (named X and Y) for its location; the other 7 dimensions (named B1–B7) are data collected from satellite measures for that particular point.
The first aspect of good data visualization is the ability to view data in dimensions higher than three! Figure 8 (first row left) is a parallel-coordinate plot [67, 18] for this dataset produced by Parallax, the commercial software of the author of [18]. In ——-coords, axes are located parallel to each other as opposed to the perpendicular Cartesian coordinate system. A point in ——-coords is represented as connected line segments, which intersect with variable axes at the corresponding feature values of that point. For example, on Figure 8 (first row right) the point on the map pointed to by the blue arrow corresponds to the blue line on the ——-coords (first row left).
The second aspect of good data visualization is the ability of “interaction” with the available figures or plots and “linking” among these plots. “Interaction” is the ability to select parts of the data, using GUI actions, that may be of visual interest. Each group should be colored differently with a transparency level (through an alpha channel) so that different patterns are distinguishable; this is called brushing. “Linking” is the ability to automatically select the same set of observations on other plots when those observations are selected on one plot. For example, when the observation represented by the blue line on the ——-coords is selected the corresponding point should be placed on the map with the same X and Y coordinates value on the ——-coords, and the other 7 features (B1–B7) correspond to its satellite measures.
Examining the ——-coords plot of this data reveals a weired pattern at the bottom of B4. Selecting this pattern (as brushed in Figure 8 (second row left)) surprisingly indicates that those observations are corresponding to the lake of Slovenia (as brushed in Figure 8 (second row right)). Thanks to “linking”. This is a wonderful shortcut to modeling and clustering this dataset. This visual inspection gives us the hypothesis that water in this part of the land can be detected from satellite data by only thresholding the variable B4.
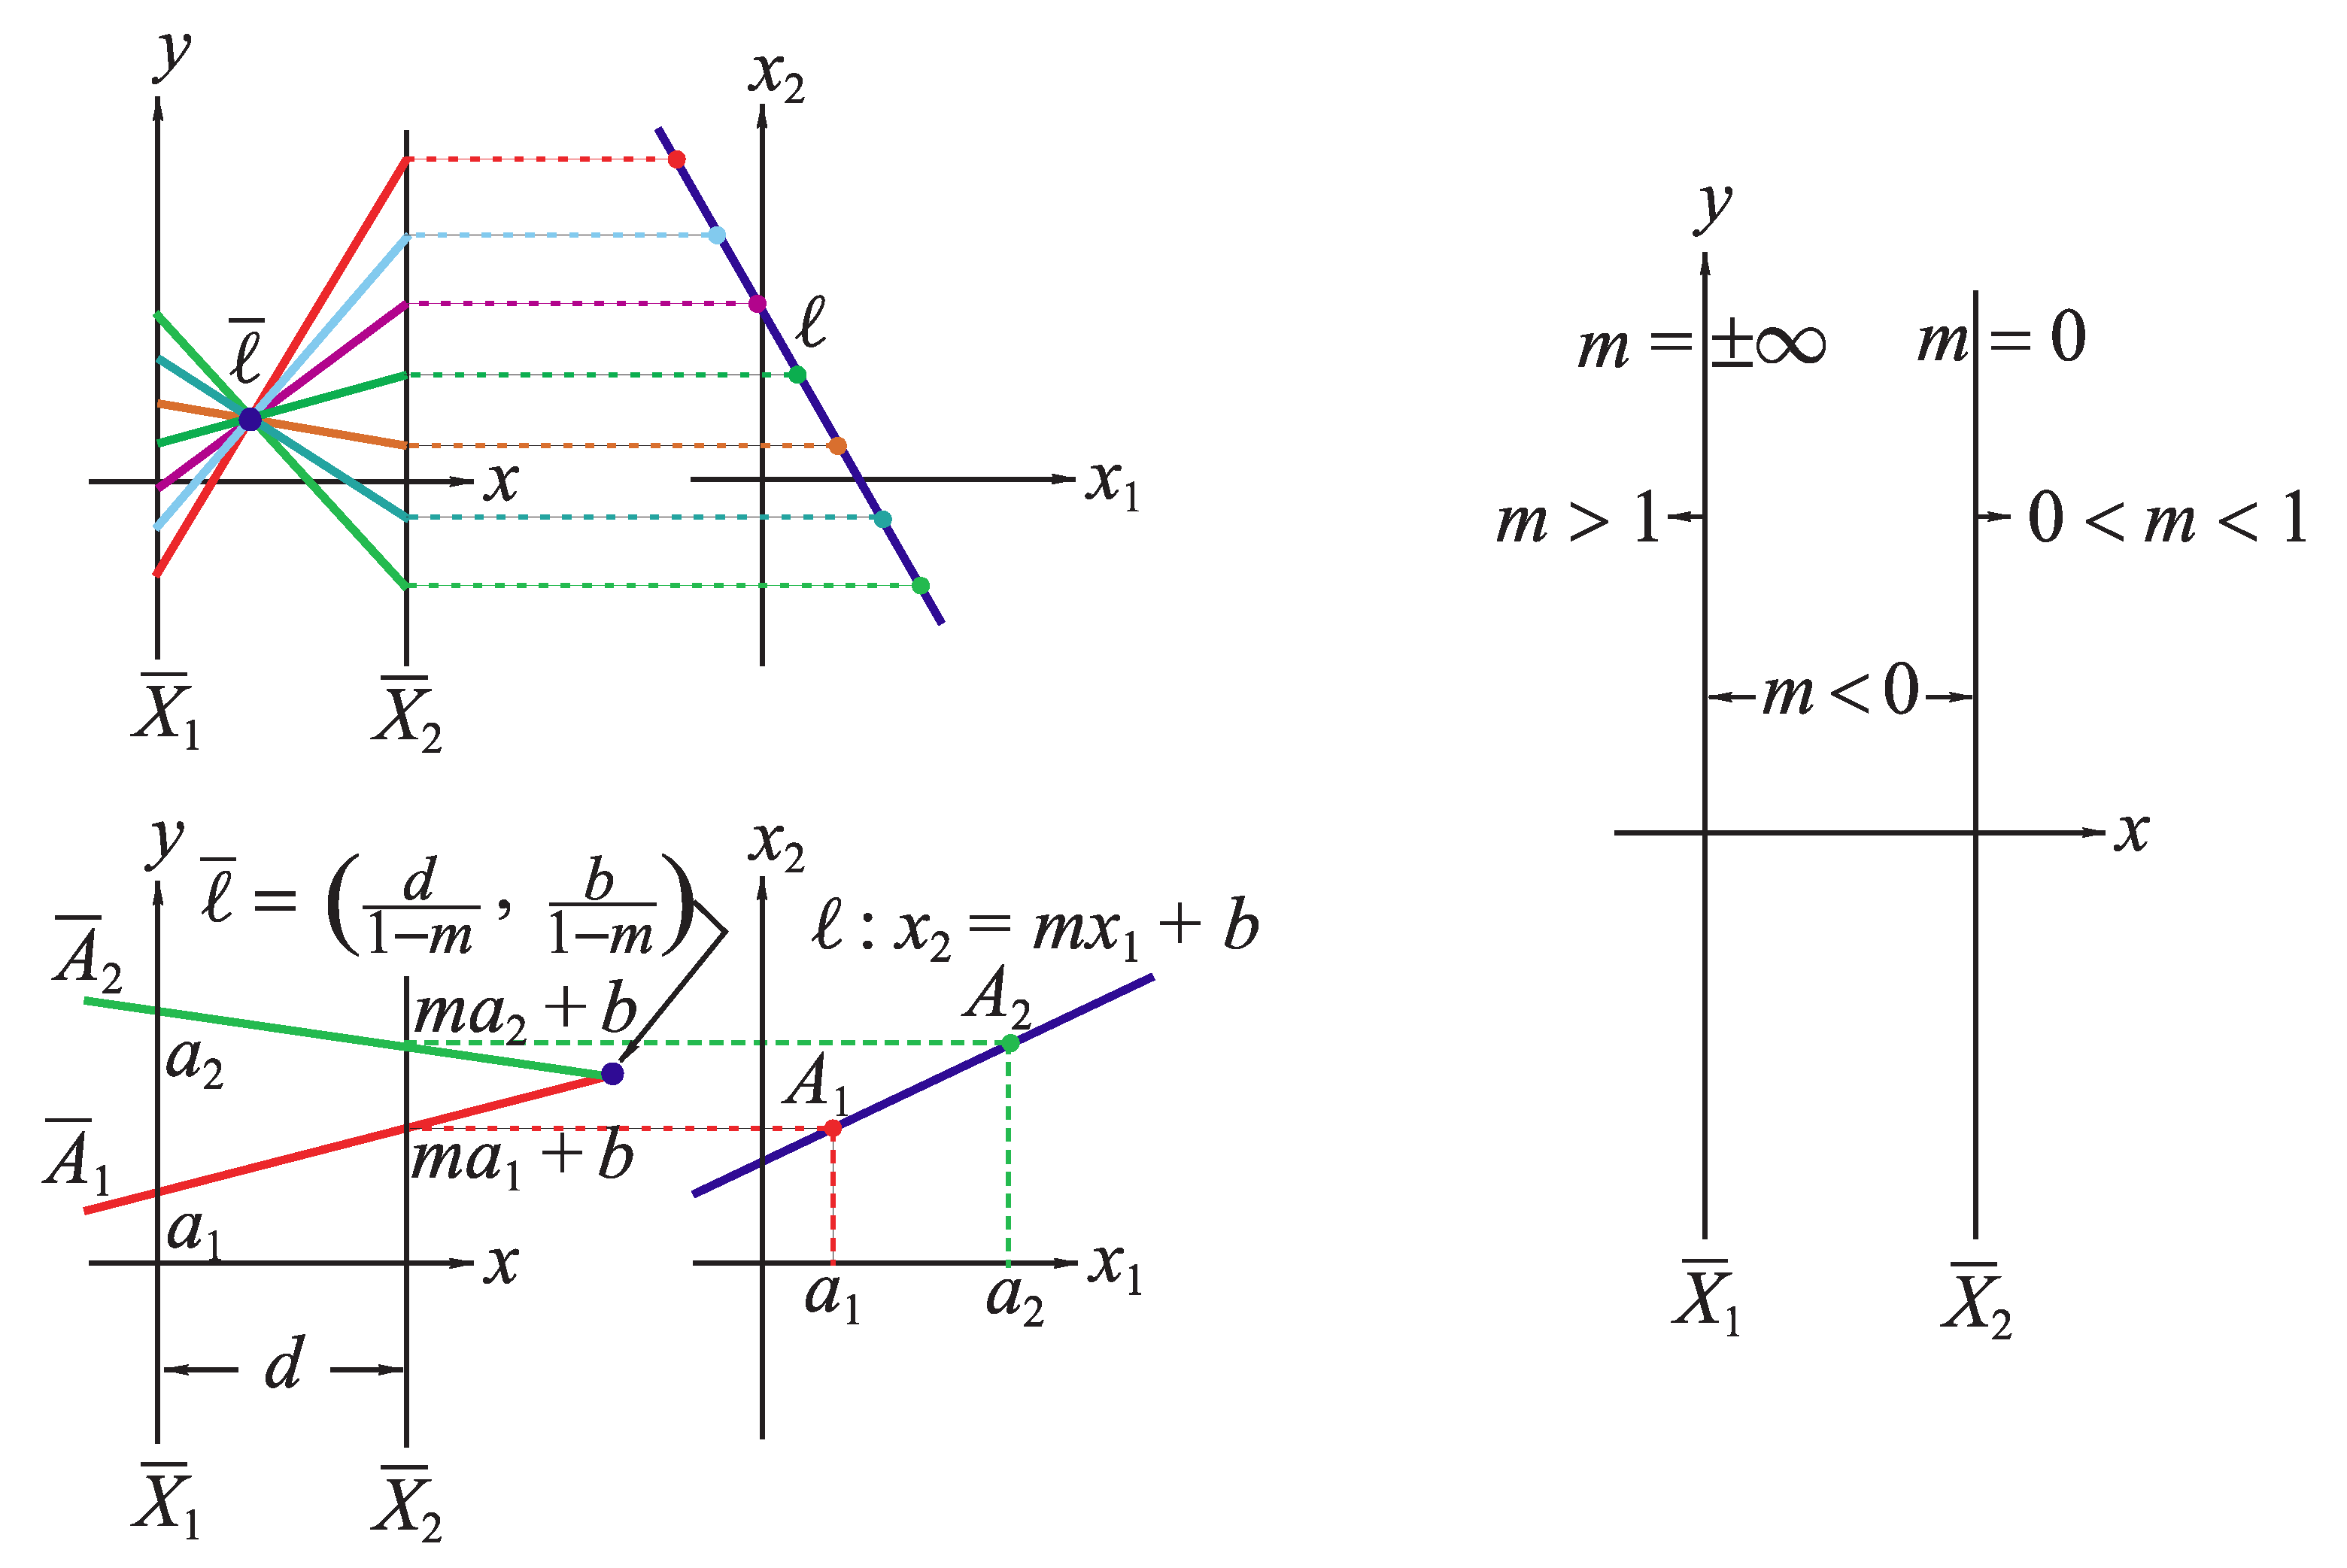
For more elaboration on ——-coords, Figure 13 [as appears in 18, Sec. 10.2.2] explains the geometry of a 2D line in both perpendicular coordinates (the usual Cartesian system) and in ——-coords, which may not be intuitive at all for new comers to ——-coords.
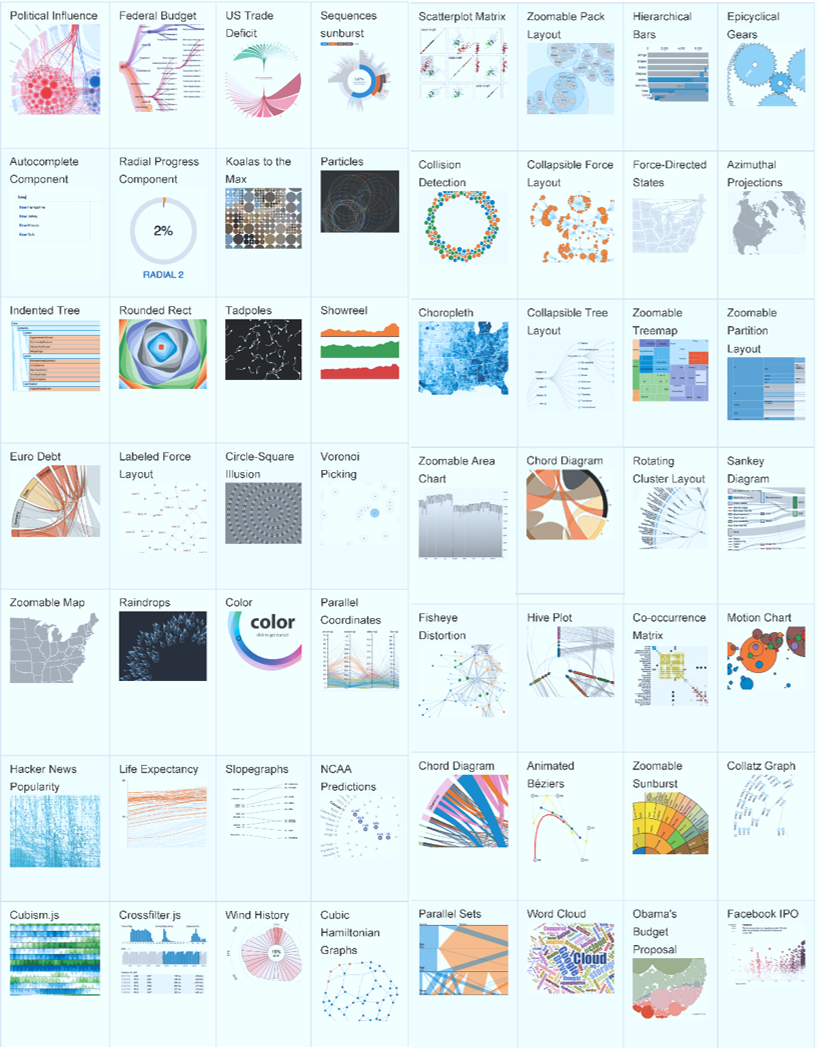
A smart data analyst should study the data visually with many plots and visualization methods than the ——-coords; e.g., matrix plot, histograms, projection pursuit, among other dozens of available methods; all should be linked to each other as mentioned above. A snapshot of few of these methods is illustrated in Figure 9 that is borrowed from [66]. For a good reference of the literature of data visualization methods the reader may refer to [2]; and for a comprehensive interactive gallery and examples refer to [66, 68, 69]. However, we provide this simple example only for illustrating the concept.
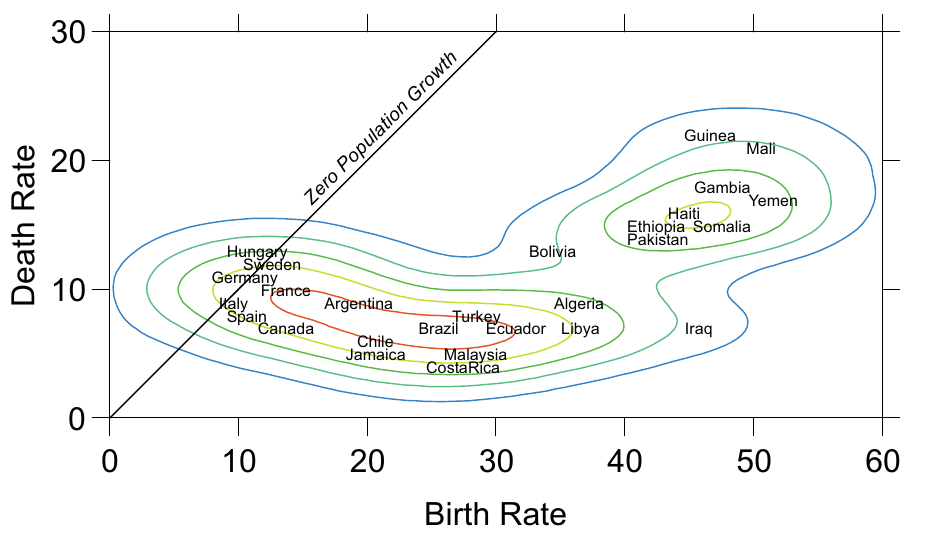
A.3 Grammar of Graphics (GoG)
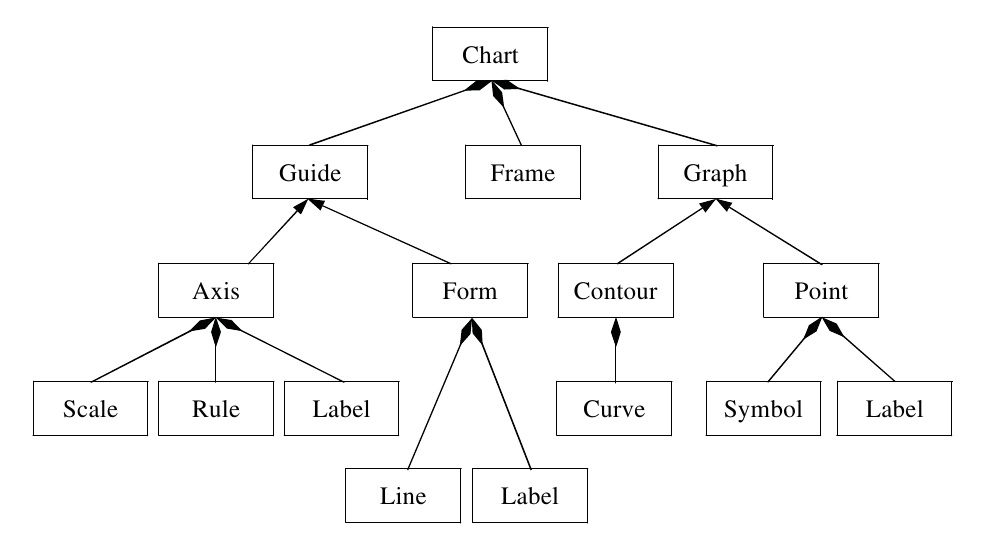
A good example to explain the idea of GoG more is adopted from [16], from where Figures 11–12 are borrowed. We will not talk here about the semantics of the figure and the striking information revealed concerning some countries (which is out of our current scope). We will focus on the GoG that if exists, abstractly and generically enough, it will produce such a figure and other more complicated figures very efficiently.
The design tree of the GoG of Figure 11 is drawn in Figure 11. Each line-ending arrow depicts some relation between its two connectors similar to those adopted in relational databases. The corresponding pseudo code grammar that describes Figure 11 is this:
Notice that the figure is full of information and many overlaid plots, including many colored contour plots, 2-D function (the straight line), and plot labels. However, its GoG descriptor is terse and efficient. Moreover, and most importantly, it is flexible and extensible, which is one of the most important features of DVP. DVP is designed to provide a scripting language that follows the GoG of [16] to accomplish the extensibility feature discussed in Section 2.4.