Variable dust emission by WC type Wolf-Rayet stars observed in the NEOWISE-R survey
Abstract
Photometry at 3.4 and 4.6 of 128 Population I WC type Wolf-Rayet stars in the Galaxy and 12 in the Large Magellanic Cloud (LMC) observed in the WISE NEOWISE-R survey was searched for evidence of circumstellar dust emission and its variation. Infrared spectral energy distributions (SEDs) were assembled, making use of archival , , and photometry to determine reddening and stellar wind levels for the WC stars found in recent IR surveys and lacking optical photometry. From their SEDs, ten apparently non-variable stars were newly identified as dust makers, including three, WR 102-22, WR 110-10 and WR 124-10, having subtype earlier than WC8–9, the first such stars to show this phenomenon. The 11 stars found to show variable dust emission include six new episodic dust-makers, WR 47c, WR 75-11, WR 91-1, WR 122-14 and WR 125-1 in the Galaxy and HD 38030 in the LMC. Of previously known dust makers, NEOWISE-R photometry of WR 19 captured its rise to maximum in 2018 confirming the 10.1-y period, that of WR 125 the beginning of a new episode of dust formation suggesting a period near 28.3 y. while that of HD 36402 covered almost a whole period and forced revision of it to 5.1 y.
keywords:
stars: winds, outflows – stars: Wolf-Rayet1 Introduction
Wolf-Rayet (WR) stars are in an advanced stage of evolution, losing mass through dense stellar winds which give rise to their characteristic emission-line spectra. One of the earliest results from infrared (IR) astronomy was the discovery of ‘excess’ IR radiation by heated circumstellar dust from a variety of stars having emission lines. Amongst these were four WC9 type Wolf–Rayet (WR) stars observed by Allen, Swings & Harvey (1972) and, at longer wavelengths, by Gehrz & Hackwell (1974). Cohen, Barlow & Kuhi (1975) measured optical–IR energy distributions of a sample of WR stars and showed that they could be matched by either free-free or graphite dust emission. Early observations (Hackwell et al., 1976) also showed variations in the IR emission by two out of a sample of ten WR stars, HD 193793 (WR 140) and HD 192641 (WR 137), which the authors interpreted in terms of changes in the electron densities, radii and mass-loss rates affecting their free-free emission. These variations had to be reinterpreted as fading circumstellar dust emission when the subsequent brightening of these stars in the IR showed spectral energy distributions (SEDs) characteristic of heated dust emission (Williams et al., 1978; Williams et al., 1985, respectively). Such stars can be described as episodic dust makers to distinguish them from the (apparently) constant dust makers like the WC9 stars found in the early studies referred to above.
Continued IR photometry of WR 140 discovered another dust maximum in 1985, leading to a period of 7.9 y and allowing re-interpretation of the previously known radial velocity (RV) variations in terms of a very eccentic orbit having periastron passage and closest approach of the WC7 and O5 stars coinciding with maximum dust emission (Williams et al., 1990a). Variations in its strong radio and X-ray emission were also tied to its binary orbit, so that WR 140 has become the prototype colliding-wind binary (CWB). It has continued to attract investigations across the spectrum from radio to X-ray (e.g. Dougherty et al. (2005), Sugawara et al. (2015) and references therein) and continued refinement of its orbit from both RV and astrometric studies (Fahed et al., 2011; Monnier et al., 2011). Usov (1991) showed that dust could form in the collisionally shocked WC7 wind if it cooled efficiently. This was the first step in tackling the underlying problem presented by dust formation by some WC type WR stars: the great difficulty of forming dust in such hostile environments (Hackwell, Gehrz & Grasdalen, 1979; Williams, van der Hucht & Thé, 1987). High-density structures in the WC winds are required to allow dust formation and these can be provided by shocks if their winds collide with those of massive companions. The winds in CWBs collide all the time but dust formation is rarer and requires particular conditions, which are satisfied in WR 140 for only a brief time during periastron passage in its very elliptical ( = 0.896) orbit (Fahed et al., 2011), presumably owing to higher pre-shock wind density when the stars are closest (Williams, 1999). Comparison of the physical conditions in wind-collision regions of well-studied CWBs such as WR 140 at phases when dust does and does not form may provide the key to understanding dust formation in WR systems.
Spurred by the episodic formation of dust by WR 140 when the stars reached a critical separation in their orbit, Williams & van der Hucht (1992) suggested that the persistent WC8–9 dust makers might also be binaries, but in circular orbits having stellar separations and pre-shock densities always conducive to dust formation – as beautifully demonstated by the rotating dust ‘pinwheel’ made by the prototypical WC9 dust maker WR 104 (Tuthill et al., 1999) observed in high resolution near-IR images. From their ‘pinwheel images of WR 104, Tuthill et al. (2008) showed that the dust was being made by the WC9 and companion stars moving in a circular orbit and that the IR flux level, and hence the dust formation rate, did not vary with orbital phase. The circular orbit results in constant separation of the stars and constant densities in the stellar winds before they collide, evidently accounting for the constant dust formation making the pinwheel. The corollary of this is that, within the paradigm of WR dust formation in CWBs, constancy of dust formation implies that such binaries have circular orbits.
Long-term near-IR photometric histories of 14 other WC8–9 dust-makers compiled by Williams & van der Hucht (2015) showed no significant () variation for most of them, with only two to be variable, WR 65 and WR 112. If most dust-making WC8–9 stars turn out to be binaries having circular orbits, this suggests that they may have suffered interaction and circularisation in the course of their evolution (cf. Tuthill et al. (2008) regarding WR 104), perhaps to a greater extent than WC stars of earlier subtypes, amongst which dust formation is much rarer and episodic.
The goal of the present investigation is to search for variation in the IR emission by WR circumstellar dust in a large and homogeneous data set. The Near-Earth Object WISE Reactivation (NEOWISE-R) mission (Mainzer et al., 2014) is well suited for this investigation, providing observations over five years and allowing characterisation of the variability such as periodic variation which could indicate CWB-modulated dust formation, or slow variations similar to those shown by the longer period dust makers WR 137 and WR 140. A by-product is the identification of more dust makers amongst the recently catalogued WR stars.
2 Data sets and search for variability
| WR | Name | Spectrum | N | ||||||
|---|---|---|---|---|---|---|---|---|---|
| 4 | HD 16523 | WC5+? | 7.67 | 0.01 | 0.4 | 7.35 | 0.01 | 0.4 | |
| 5 | HD 17638 | WC6 | 7.24 | 0.02 | 0.3 | 7.01 | 0.01 | 0.3 | |
| 9 | HD 63099 | WC5+O7 | 6.97 | 0.08 | 1.0 | 6.79 | 0.08 | 2.4 | |
| 13 | Ve6-15 | WC6 | 8.56 | 0.01 | 0.3 | 8.16 | 0.01 | 0.3 | |
| 17 | HD 88500 | WC5 | 8.84 | 0.01 | 0.3 | 8.52 | 0.01 | 0.2 | |
| 19 | LS 3 | WC4pd+O9 | 7.74 | 1.05 | 18.8 | 7.28 | 1.32 | 16.6 | * |
| 23 | HD 92809 | WC6 | 6.28 | 0.04 | 0.2 | 6.28 | 0.04 | 0.4 | |
| 27 | MS 1 | WC6+a | 7.91 | 0.01 | 0.5 | 7.50 | 0.01 | 0.4 | |
| 30 | HD 94305 | WC6+O6-8 | 8.96 | 0.03 | 1.2 | 8.62 | 0.03 | 1.5 | |
| 31c | SMSP 4 | WC6 | 8.95 | 0.01 | 0.3 | 8.58 | 0.02 | 0.5 | |
| 33 | HD 95345 | WC6 | 9.56 | 0.01 | 0.3 | 9.22 | 0.01 | 0.4 | |
| 41 | LS 7 | WC5+OB? | 9.81 | 0.01 | 0.2 | 9.44 | 0.01 | 0.2 | |
| 42 | HD 97152 | WC7+O7V | 6.43 | 0.06 | 0.3 | 6.45 | 0.02 | 0.4 | |
| 44-1 | SMG09 740_16 | WCE | 10.08 | 0.00 | 0.2 | 9.74 | 0.01 | 0.4 | |
| 45 | LSS 2423 | WC6 | 8.86 | 0.01 | 0.4 | 8.47 | 0.01 | 0.4 | |
| 46-7 | MV09 | WC5-7 | 8.83 | 0.35 | 12.7 | 8.16 | 0.34 | 14.1 | * |
| 46-10 | SMG09 791_12c | WCE | 11.01 | 0.02 | 0.3 | 10.60 | 0.01 | 0.3 | |
| 46-11 | SMG09 808_14 | WCE | 10.40 | 0.03 | 1.1 | 10.01 | 0.03 | 1.2 | |
| 46-13 | SMG09 807_13 | WC7 | 10.54 | 0.01 | 0.3 | 10.10 | 0.01 | 0.5 | |
| 46-18 | RC17 E3 | WC6-7 | 9.79 | 0.00 | 0.2 | 9.22 | 0.01 | 0.3 | |
| 47c | SMSNPL 7 | WC5 | 9.42 | 0.12 | 3.7 | 9.10 | 0.14 | 4.9 | * |
| 47-2 | SMG09 832_25 | WC5-6 | 9.63 | 0.01 | 0.5 | 9.26 | 0.01 | 0.3 | |
| 47-3 | SMG09 856_13c | WC5-6 | 10.42 | 0.01 | 0.5 | 10.07 | 0.01 | 0.5 | |
| 48-1 | HDM 5 | WC7 | 8.72 | 0.01 | 0.3 | 8.26 | 0.01 | 0.4 | |
| 48b | SMSNPL 8 | WC9d | 7.13 | 0.11 | 0.8 | 6.59 | 0.08 | 1.0 | |
| 48-2 | Danks 2-3 | WC7-8 | 8.06 | 0.03 | 0.5 | 7.66 | 0.03 | 0.4 | |
| 48-3 | SMG09 845_34 | WC8 | 8.20 | 0.02 | 0.5 | 7.95 | 0.01 | 0.4 | |
| 50 | Th2 84 | WC7+OB | 8.52 | 0.00 | 0.2 | 8.22 | 0.01 | 0.5 | |
| 52 | HD 115473 | WC4 | 7.28 | 0.02 | 0.2 | 7.03 | 0.01 | 0.5 | |
| 57 | HD 119078 | WC8 | 7.16 | 0.04 | 0.5 | 6.82 | 0.05 | 1.4 | |
| 59-1 | SMG09 883_18 | WCE | 10.13 | 0.01 | 0.3 | 9.59 | 0.01 | 0.4 | |
| 59-2 | SMG09 885_11 | WC5-6 | 10.32 | 0.03 | 0.5 | 9.79 | 0.02 | 0.4 | |
| 60 | HD 121194 | WC8 | 6.90 | 0.03 | 0.3 | 6.70 | 0.03 | 0.6 | |
| 60-1 | Sm09 897.5 | WC8 | 9.20 | 0.03 | 1.3 | 8.42 | 0.03 | 1.1 | |
| 60-2 | SMG09 903_15c | WC8 | 8.16 | 0.03 | 1.7 | 7.39 | 0.03 | 1.6 | d |
| 60-3 | MDM11-11 | WC7 | 10.80 | 0.03 | 0.4 | 10.31 | 0.03 | 0.4 | * |
| 60-4 | MDM11-12 | WC8 | 9.63 | 0.11 | 5.2 | 8.79 | 0.14 | 6.5 | * |
| 60-5 | WR 60a R11b | WC7 | 9.00 | 0.00 | 0.3 | 8.69 | 0.01 | 0.5 | |
| 60-7 | RC17 B51 | WC7-8 | 9.30 | 0.04 | 2.0 | 8.71 | 0.04 | 1.5 | |
| 61-3 | MDM11-13 | WC9 | 9.32 | 0.03 | 1.1 | 8.68 | 0.03 | 1.4 | |
| 64 | BS 3 | WC7 | 10.71 | 0.03 | 0.6 | 10.41 | 0.02 | 0.6 | |
| 67-2 | WR67b R11a | WC7 | 7.88 | 0.01 | 0.3 | 7.49 | 0.01 | 0.3 | |
| 68 | BS 4 | WC7 | 8.31 | 0.01 | 0.3 | 7.93 | 0.01 | 0.4 | |
| 70-3 | SMG09 1011_24 | WC7 | 8.49 | 0.01 | 0.4 | 8.14 | 0.01 | 0.4 | |
| 70-9 | MDM11 17 | WC8 | 10.22 | 0.01 | 0.3 | 9.55 | 0.01 | 0.5 | |
| 70-12 | SFZ12 1038-22L | WC7: | 8.58 | 0.02 | 0.4 | 8.03 | 0.00 | 0.2 | |
| 70-13 | RC17 B105 | WC8d | 8.61 | 0.05 | 1.6 | 7.92 | 0.06 | 2.6 | |
| 72-1 | HDM6 | WC9 | 7.91 | 0.01 | 0.4 | 7.45 | 0.01 | 0.3 | |
| 72-2 | SMG09 1053_27 | WC8 | 7.24 | 0.03 | 0.3 | 6.91 | 0.01 | 0.3 | |
| 72-3 | MDM11 18 | WC9d? | 10.49 | 0.02 | 0.6 | 9.79 | 0.02 | 0.7 | w |
| 72-4 | SFZ12 1051-67L | WC7: | 9.94 | 0.03 | 0.4 | 9.45 | 0.02 | 0.3 | |
| 73-1 | SMG09 1059_34 | WC7 | 10.58 | 0.05 | 0.8 | 10.13 | 0.03 | 0.8 | |
| 74-3 | SFZ12 1077-55L | WC6: | 10.74 | 0.02 | 0.3 | 10.25 | 0.02 | 0.6 | |
| 75a | SMSNPL 15 | WC9 | 7.91 | 0.01 | 0.4 | 7.50 | 0.01 | 0.6 | |
| 75aa | HBD 1 | WC9d | 8.17 | 0.06 | 2.7 | 7.51 | 0.06 | 2.7 | * |
| 75b | SMSNPL 16 | WC9 | 7.54 | 0.03 | 0.4 | 7.25 | 0.01 | 0.4 | |
| 75c | HBD 2 | WC9 | 10.02 | 0.02 | 1.1 | 9.58 | 0.03 | 1.6 | |
| 75d | HBD 3 | WC9 | 8.21 | 0.08 | 1.6 | 7.65 | 0.09 | 1.8 | * |
| 75-1 | SMG09 1081_21 | WC8 | 9.76 | 0.03 | 0.6 | 9.40 | 0.02 | 0.9 | |
| 75-2 | SMG09 1093_34 | WC8 | 10.22 | 0.02 | 0.2 | 9.60 | 0.03 | 0.6 |
Galactic program stars with mean NEOWISE-R and and their dispersions. WR Name Spectrum N 75-3 SMG09 1093_33 WC8 10.36 0.02 0.4 9.79 0.01 0.3 75-5 SMG09 1096_22 WC8 10.46 0.03 0.5 9.89 0.01 0.4 75-7 MDM11 22 WC9 10.59 0.03 0.4 9.95 0.02 0.4 d 75-11 MDM11-26 WC9d? 9.43 0.06 1.3 8.90 0.07 2.2 * 75-14 SFZ12 1085-72L WC9 10.14 0.05 0.6 9.70 0.04 0.7 75-15 SFZ12 1085-69L WC8 9.95 0.03 0.7 9.24 0.03 0.8 d 75-16 SFZ12 1085-83L WC8 10.55 0.03 0.4 9.92 0.02 0.5 75-19 SFZ12 1093-140L WC7: 11.31 0.03 0.4 10.80 0.06 1.1 75-23 SFZ12 1106-31L WC9 8.34 0.04 1.3 7.88 0.05 2.2 75-24 SFZ12 1105-76L WC8 10.49 0.01 0.2 9.94 0.01 0.3 76-10 SFZ12 1109-74L WC7: 9.85 0.04 0.7 9.30 0.04 0.9 77 He3-1239 WC8+O8 7.45 0.05 0.9 7.04 0.03 1.0 77t HBD 5 WC9d 6.89 0.18 2.0 6.36 0.15 2.1 * 81 He3-1316 WC9 6.06 0.06 0.4 5.90 0.02 0.2 82-2 KSF14 1178-66B WC9 9.48 0.03 0.7 9.04 0.03 0.9 84-2 SFZ12 1181-82L WC8 9.80 0.03 0.3 9.31 0.02 0.4 84-5 SFZ12 1189-110L WC9 10.76 0.05 1.0 10.24 0.07 2.2 91-1 SMG09 1222_15 WC7 9.39 0.25 6.9 8.31 0.37 14.5 * 92 HD 157451 WC9 8.23 0.03 1.4 7.82 0.04 1.5 94-1 SFZ12 1245-23L WC9 9.59 0.03 0.7 8.63 0.03 0.7 98-1 SFZ12 1269-166L WC8 9.44 0.02 0.5 8.92 0.02 0.4 101 DA 3 WC8 6.84 0.06 0.4 6.60 0.02 0.4 102-22 WR 1327-14AF WC7 9.98 0.05 0.9 9.54 0.08 2.0 d 111-3 SMG09 1385_24 WC8 7.60 0.04 0.8 7.10 0.03 1.1 111-7 SFZ12 1395-86L WC8 10.58 0.03 0.4 9.75 0.02 0.4 111-10 KSF14 1389-4AB6 WC7 10.29 0.02 0.4 9.47 0.02 0.6 d 113-2 SMG09 1425_47 WC5-6 7.81 0.01 0.3 7.35 0.01 0.4 118-4 MDM11 39 WC8 8.64 0.01 0.3 8.06 0.01 0.3 118-8 SFZ12 1487-80L WC9 9.94 0.03 0.6 9.11 0.03 1.0 119-2 MDM11 42 WC8 8.81 0.02 0.4 8.41 0.04 0.6 119-4 KSF14 1495-1D8A WC8-9 10.12 0.08 0.5 9.44 0.02 0.3 120-1 HDM 13 WC9 8.75 0.02 0.4 8.26 0.01 0.4 120-5 SCB12 2w02 WC8 8.72 0.04 1.2 8.25 0.05 1.7 120-11 SFZ12 1495-32L WC8 9.58 0.02 0.6 9.11 0.02 0.6 120-13 SFZ12 1522-55L WC9 10.27 0.04 0.9 9.71 0.05 2.1 120-14 SCB12 2w03 WC8 10.67 0.01 0.3 10.22 0.01 0.4 120-15 SCB12 2w04 WC8 9.57 0.02 0.3 9.50 0.02 0.6 120-16 KSF14 1514-AA0 WC8 10.12 0.01 0.2 10.19 0.01 0.3 120-17 KSF14 1509-2E64 WC9 9.75 0.06 0.5 9.01 0.07 0.8 d 121-4 MDM11 49 WC8 9.79 0.02 0.2 9.19 0.03 1.3 121-5 SCB12 2w07 WC8 9.00 0.01 0.3 8.13 0.01 0.3 121-10 SCB12 2w10 WC8 10.82 0.05 0.9 10.09 0.05 1.5 121-13 KSF14 1541-187C WC8 10.06 0.05 0.7 9.30 0.05 1.1 122-1 IPHAS J190015.86+000517.3 WC8 9.38 0.03 1.5 8.83 0.04 1.8 d 122-7 SFZ12 1563-66L WC8 9.94 0.03 0.5 9.19 0.02 0.6 122-8 SFZ12 1563-89L WC7: 11.40 0.04 0.4 10.70 0.02 0.5 122-9 SFZ12 1567-51L WC7: 9.73 0.01 0.2 9.22 0.01 0.5 122-14 KSF14 1553-15DF WC8 9.76 0.10 3.3 8.69 0.11 4.2 * 123-4 SFZ12 1603-75L WC8 10.65 0.02 0.6 9.89 0.03 1.2 123-5 SCB12 2w11 WC7 10.50 0.01 0.2 9.82 0.01 0.4 124-2 SMG09 1671_5 WC8 9.96 0.02 0.2 9.55 0.01 0.2 124-3 MDM11 56 WC7 10.18 0.01 0.4 9.74 0.01 0.4 124-5 MDM11 58 WC8-9d? 9.52 0.02 0.7 8.86 0.03 0.9 w 124-6 MDM11 59 WC7 8.51 0.01 0.2 7.92 0.01 0.3 124-7 MDM11 60 WC8d 8.39 0.04 0.5 7.75 0.09 0.8 124-9 SFZ12 1670-57L WC6: 11.11 0.03 0.4 10.60 0.01 0.2 124-10 SFZ12 1669-24L WC6 10.49 0.02 0.6 9.95 0.02 0.8 d 124-16 KSF14 1647-1E70 WC8: 10.91 0.04 0.9 9.80 0.03 1.3 124-19 KSF14 1660-1169 WC6: 11.61 0.01 0.2 11.15 0.02 0.4 124-20 KSF14 1697-38F WC9 8.53 0.05 1.9 7.88 0.05 2.3 d 124-22 KSF14 1695-2B7 WC9 8.40 0.04 1.9 7.71 0.04 1.7 d 125 IC 14-36 WC7ed+O9 7.73 0.07 2.0 7.38 0.12 6.2 * 125-1 HDM 15 WC8 8.53 0.04 2.1 8.09 0.07 3.2 *
Galactic Program stars with mean NEOWISE-R and and their dispersions. WR Name Spectrum N 132 HD 190002 WC6+? 8.75 0.01 0.4 8.38 0.01 0.3 143 HD 195177 WC4+Be 6.87 0.23 2.2 6.75 0.17 4.4 144 MHM 19-1 WC4 7.18 0.01 0.2 6.86 0.01 0.2 150 ST 5 WC5 9.37 0.00 0.3 8.99 0.01 0.4 154 HD 213049 WC6 8.01 0.01 0.4 7.65 0.01 0.4
| BAT99 | HD/Brey | Spectrum | N | ||||||
|---|---|---|---|---|---|---|---|---|---|
| 8 | 32257 | WC4 | 13.49 | 0.03 | 0.3 | 13.18 | 0.02 | 0.2 | |
| 9 | 32125 | WC4 | 13.52 | 0.03 | 0.6 | 13.22 | 0.01 | 0.1 | |
| 11 | 32402 | WC4 | 12.38 | 0.01 | 0.2 | 12.12 | 0.01 | 0.2 | |
| 34 | 36156 | WC4+OB | 12.81 | 0.02 | 0.4 | 12.56 | 0.02 | 0.4 | |
| 38 | 36402 | WC4(+O?)+O8I: | 9.75 | 0.34 | 10.5 | 8.89 | 0.34 | 8.8 | * |
| 39 | 36521 | WC4+O | 12.59 | 0.01 | 0.3 | 12.53 | 0.03 | 0.3 | |
| 52 | 37026 | WC4 | 13.04 | 0.01 | 0.2 | 12.70 | 0.01 | 0.2 | |
| 53 | 37248 | WC4+O9 | 13.01 | 0.02 | 0.3 | 12.85 | 0.02 | 0.3 | |
| 61 | 37680 | WC4 | 12.48 | 0.01 | 0.2 | 12.16 | 0.01 | 0.2 | |
| 84 | 38030 | WC4 | 12.70 | 0.42 | 8.8 | 12.21 | 0.69 | 10.2 | * |
| 87 | Br 70 | WC4+OB? | 13.52 | 0.02 | 0.2 | 13.30 | 0.02 | 0.2 | |
| 125 | 38448 | WC5+O7 | 12.24 | 0.05 | 1.0 | 11.98 | 0.06 | 1.0 |
The principal data set on which this study is based is the 2019 data Release of the NEOWISE-R survey. The wavelengths of the and bands, 3.4 and 4.6, are well placed for observing 1000-K circumstellar dust emission. Synthetic and magnitudes calculated from a model stellar wind and heated carbon dust show that the – colour is a good measure of the average dust temperature but not of the amount of dust if 1000 K because its – is then similar to that of the wind. The instrument has the sensitivity to cover the fainter and heavily reddened WR stars found in recent IR surveys, e.g. Mauerhan, Van Dyk & Morris (2009), Shara et al. (2009) but, on the other hand, most of the WR dust emitters found in the earlier studies are too bright for NEOWISE-R (see below), so there is little overlap with the earlier studies. The only exceptions are the episodic dust makers WR 19 and WR 125, whose near-IR fluxes had faded to wind level before the first NEOWISE-R observations, and the variable dust maker HD 36402 (Williams et al., 2013b) in the Large Magellanic Cloud (LMC).
The NEOWISE-R data were collected in around ten ‘visits’, akin to observing runs, each including 12 or more observations taken at intervals of one or more 94-min orbital passages and spread over several days, with the visits separated by about six months as the Sun-synchronous orbit of the satellite followed the Earth in its orbit. The length of visit and number of observations in each depend on the overlap of the survey strips, which increase with increasing ecliptic latitude as the overlap increases. The observations were taken between late 2013 and late 2018. The cadence of the observations makes them most useful for studying variations over short ( 1–2 d.) and long ( 1–5 y.) time-scales, of which the latter are of interest for the present investigation.
NEOWISE-R followed the original Wide-field Infrared Explorer (WISE) mission (Wright et al., 2010), which surveyed the whole sky (All-Sky survey) in four bands: , , and at 3.4, 4.6, 11 and 22 respectively. As the cryogen became exhausted, the observations were dropped and surveying continued in three bands (3-Band Cryo) for almost two months, after which observations also ceased and surveying continued in and in the Post-Cryo NEOWISE survey (Mainzer et al., 2011). Altogether, these surveys provide at least another two sets of and photometry, observed mostly in 2010. There is a significant difference, however, between the NEOWISE-R data and those from the All-Sky and 3-Band Cryo surveys: the profile-fit brightnesses of sources brighter than the saturation limits and are significantly overestimated in the NEOWISE-R data. The offsets (Mainzer et al., 2014, figure 6) rise to 0.8–0.9 mag. with considerable dispersion. Such stars were not initially excluded from the present study: data were extracted where possible, and the offsets borne in mind during their interpretation. Useful data were recovered for those as bright as and in NEOWISE-R, corresponding to and in the cryogenic (All-Sky and 3-Band Cryo) surveys, with slightly more scatter in the individual magnitudes.
The NEOWISE-R Single Exposure Source Database in the NASA/IPAC Infrared Science Archive (IRSA) data was searched at the positions of all WC stars in V 1.22111http://pacrowther.staff.shef.ac.uk/WRcat/index.php, dated Mar 2019 of the Galactic Wolf Rayet Catalogue (Rosslowe & Crowther, 2015). Besides saturation of the brighter sources, the principal limitation was source confusion, given the 6.1 and 6.4 arc sec psf and beam sizes (Wright et al., 2010). This effectively excluded the WR stars in crowded regions such as near the direction of the Galactic Centre or massive star clusters, as well as field WR stars which happened to have close neighbours. The Galactic programme stars are listed in Table 1. The WR numbers are from the Galactic Wolf-Rayet Catalogue, together with earlier or ‘discovery’ names. The spectral types, including ‘d’ to mark dust makers, are from the Catalogue, as updated by Rosslowe & Crowther (2015) where appropriate. Stars found to be dust makers in the present study are flagged ‘d’ in the ‘N’ column while those catalogued as possible dust makers (‘d?’) are flagged ‘d’ or ‘w’ where their SEDs were found to show dust or just stellar wind emission.
In addition to the Galactic WR stars, the NEOWISE-R database was examined at the positions of the WC stars in the Large Magellanic Cloud (LMC). Confusion was a significant limitation here, but useful data could be retrieved for 12 WC stars in less crowded regions. The LMC stars are listed in Table 4, by BAT99 (Breysacher, Azzopardi & Testor, 1999) number, and giving the same photometric quantities as in Table 1.

Individual and ‘A’-quality profile-fitted magnitudes were retrieved from the Single Exposure Source Tables, excluding observations from bad frames or found more than 1 arc sec from the nominal position. No hard limit was set for the profile fitting metric, , but individual observations having significantly greater () values than than those of other observations in the same data set were also excluded. This allowed searching for variability by stars having a neighbour always affecting the profile fitting in the same way and not introducing variability to the derived magnitudes.
The individual and were examined for short-term systematic variation within each visit. This was found in one case only: WR 60-3 showed apparent eclipses of mag. lasting less than a day in several of the 1.25-d NEOWISE-R visits, and is discussed in Section 4.4. In order to search for long-term variations, the individual magnitudes in each visit which included at least five acceptable observations were averaged to provide and corresponding the averaged date of that visit, thereby building a set of (usually) ten222There was a hiatus in the observing in early 2014, so that stars between WR 121-4 and WR 125 in Table 1 were observed in nine visits only and the timing of the mission allowed 11 visits for a few stars. independent observations spaced by approximately six months for each star. These averages form the datset for the present investigation. Owing to the high ecliptic latitude () of the LMC and greater overlap of the survey strips, the stars received 5–10 times as many observations per visit as the Galactic stars, so that the accuracies of the average and are comparable to those of the Galactic stars. Their means and dispersions are collected in Tables 1 and 4; they do not include measures in the All-Sky, 3-Band Cryo or NEOWISE Post-Cryo surveys of 2010, which are kept separate, but were subsequently compared with the NEOWISE-R data in the examination of variability. Given the focus of the present study on long-term variability, and in order to reduce the influence of intra-visit variability, whether intrinsic like that of WR 60-3 referred to above, or observational, an additional variability metric was introduced. This is the ratio, , of the inter-visit (semestrial) dispersion to the mean intra-visit (orbital) dispersion. These are also given in Tables 1 and 4.
It is apparent from Tables 1 and 4 that the dispersions in and are generally small (Fig. 1); the median dispersions are 0.026 and 0.022 mag. (respectively) for the sources fainter than the saturation limits. From inspection of the distribution of dispersions, candidate variables are taken to be stars having dispersions and semestral to orbital dispersion ratios . The stars about 1–2 mag. brighter than the saturation limits, having and , show slightly greater dispersions, 0.037 and 0.031 mag. in and but can still be used to search for variability, albeit with a higher threshold: .
Evidently, the variability of WC stellar wind emission is small and the question arises: which of the few stars found to be variable owe this to varying dust emission?
Three stars previously known to be variable can be discounted. Two, WR 9 and WR 30, are optically observed atmospheric eclipsing binaries (Lamontagne et al., 1996) and the third, WR 143, was observed to vary in by Varricatt & Ashok (2006), who ascribed the variation to the Be companion they identified. They are not dust makers and will not be considered further here.
The stars found to be variable are examined individually in Section 4 for periodic or systematic variation suggestive of a CWB, but first we consider the question of whether the stars, including the apparently non-variable sources, are dust makers.
3 Search for dust emission
3.1 Interstellar reddening
Distinguishing the SEDs of heated dust from the free-free emission of the stellar winds requires not only observations at IR wavelengths sensitive to dust emission, but also knowledge of the interstellar reddening. This is important for distant WR stars in the Galactic Plane because the effect of heavy reddening on the near-IR colours can mimic that of Planckian dust emission. For WR stars whose reddening can be determined from optical photometry, uncertainties in the optical reddening translate into much () smaller uncertainties in the IR, so that the effects of dust emission and reddening on the IR SED are almost orthogonal. Of the stars in Tables 1 and 4, about one quarter have and on the narrow-band system optimised for WR stars (Smith, 1968b), from aperture photometry or calibrated spectra (e.g. Shara et al. (1999)). Most of the recently discovered WR stars are too heavily reddened, however, to have such data so it is necessary to look to photometry at slightly longer wavelengths, but still not affected by dust emission.
Most of the brighter southern hemisphere WR stars in the sample have band photometry in the DENIS (Deep Near Infrared Survey of the Southern Sky, Epchtein et al. (1999)) survey. This is currently being superseded by magnitudes from the ongoing VST Photometric Survey, VPHAS+, Drew et al. (2014), and these (often together with ) data from DR2 and DR3 were used where possible. In the northern hemisphere, and photometry measured in the INT/WFC Photometric H Survey (IPHAS, Drew et al. (2005)) were sought, taking data from the IPHAS2 (Barentsen et al., 2014). Owing to their slightly different wavelengths (0.79 vs. 0.77 ), the DENIS and IPHAS/VPHAS magnitudes were treated separately for de-reddening and conversion to monochromatic fluxes.
3.2 The SEDs
To form the SEDs, data were taken from the Two Micron All Sky Survey (2MASS, Skrutskie et al. (2006)) or, for the more heavily reddened stars whose tabulated 2MASS magnitudes are upper limits (ph_qual = U), the UKIRT Infrared Deep Sky Survey (UKIDSS, Lawrence et al. (2007)) Galactic Plane Survey (GPS, Lucas et al. (2008)) or the VVV. In the mid-IR, the WISE phtotometry was augmented with [3.6]. [4.5], [5.8] and [8.0] magnitudes observed in the Spitzer Galactic Legacy Infrared Mid-Plane Survey Extraordinaire (GLIMPSE, Benjamin et al. (2003); Churchwell et al. (2009)).
All data were de-reddened using the ‘Wd1+RCs’ reddening law determined by Damineli et al. (2016), duly adjusted for the wavelengths of photometric bands used in the present study. As pointed out by Damineli et al. (2016) and references therein, there are real differences in the reddening laws in different directions in the Galaxy, on small and large scales, and it is probable that many of the stars in this study are sufficiently heavily reddened for this to be an issue; but not one that can be addressed with the data presently available. The dust-free continua were inially assumed to follow a power law following Morris et al. (1993), who found the UV–1-micron continua of single WR stars to be well fit by power laws, which were found to extend into the IR by Mathis et al. (1992). For each star, was then determined by fitting the shortest wavelength data available; if its continuum followed a different spectral index from that adopted (Morris et al. found a dispersion in spectral indices for WC stars), this would lead to an incorrect but the effect in the IR would be smaller. If the WC star has an OB companion, as in a CWB, the SED will be steeper at shorter wavelengths depending on the relative contributions of the two components, and the effects of this will be discussed below.
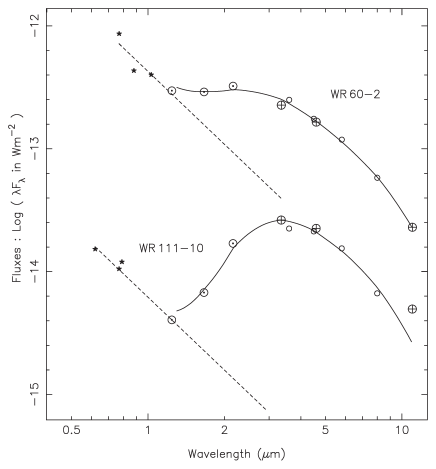
Determination of the SEDs of the apparently non-varying WC stars revealed a number of previously unidentifed dust emitters, which are listed in Table 5. Their spectral types, from the Galactic WR Catalogue, are mostly WC8–9, as expected, but three stars, WR 102-22, WR 111-10 (WC7) and WR 124-10 (WC6) have earlier types, making them the first WR stars having spectral subtypes earlier than WC8 to be identified as apparently non-variable persistent dust makers.
| WR | Type | dust/ | r.m.s. | bands | ||
|---|---|---|---|---|---|---|
| wind | mag. | |||||
| 60-2 | WC8 | 5.4 | 117728 | 0.11 | 15.0 | |
| 75-7 | WC9 | 30.0 | 116549 | 0.14 | 4.1 | |
| 75-15 | WC8 | 1.7 | 102767 | 0.08 | 20.0 | |
| 102-22 | WC7 | 11.5 | 141867 | 0.12 | 9.5 | |
| 111-10 | WC7 | 44.8 | 81834 | 0.11 | 5.4 | |
| 122-1 | WC8 | 2.2 | 108399 | 0.10 | 4.4 | |
| 123-4 | WC8 | 21.6 | 95353 | 0.15 | 9.5 | |
| 124-10 | WC6 | 12.8 | 149172 | 0.14 | 8.1 | |
| 124-20 | WC9 | 4.4 | 101268 | 0.13 | 11.7 | |
| 124-22 | WC9 | 2.7 | 98070 | 0.08 | 13.9 |
The dust emission was modelled using clouds of amorphous carbon grains assumed to have optical properties of the ‘ACAR’ laboratory grains studied by Colangeli et al. (1995). The absorption coefficients were calculated from the optical properties for this sample given by Zubko et al. (1996). The emission was assumed to be optically thin, with dust density falling off radially as , appropriate for dust formed in a stationary wind with constant mass-loss rate. The grain temperature is determined by radiative equilibrium in the stellar radiation field, falling off as following Williams et al. (1987). The temperature of the dust nearest the star and the amount of dust were found by fitting the observed fluxes assumed to define a representative SED for the non-variable stars although different wavelength regions were observed at different times. The radial extent of the cloud is poorly constrained by the data as the more distant dust is too cool to contribute significant emission at the wavelengths observed. In practice, the quality of fits to the data by successive models having increasing radial extent were compared and the extension terminated when there was no improvement to the fit. Conversion of IR flux to dust mass requires knowledge of the distance to the source, which enters as its square. Distances to these stars are poorly constrained: only one of the stars (WR 111-10) has a parallax in Gaia DR2 (Gaia Collaboration et al., 2018) and that is very uncertain (). Determination of distances from the de-reddened photometry requires knowedge of the stars’ absolute magnitudes, which are very uncertain in the light of the recent study of the luminosities of WC stars having Gaia parallaxes (Sander et al., 2019) showing them to be very dispersed, as well as the possible presence of undetected luminous companions to the WC stars. For these reasons, the amount of circumstellar dust is expressed as the ratio of dust to wind emission at a reference wavelength, that of the filter. These ratios, the dust temperatures, values of and photometric bands used for their determination are given in Table 5.
The de-reddened SEDs of the variable sources were then examined for evidence of dust formation, for which the criterion was taken to be ‘excess’ flux of at least 10 per cent of the wind flux in the 2–4-m region. It is possible that some of the less intense dust emitters have been missed but, in most cases, the dust emission was so much brighter than the wind that the classification as dust makers is unequivocal.
| WR | Type | dust/ | Epoch | Var. | ||
|---|---|---|---|---|---|---|
| wind | ||||||
| 46-7 | WC6-7 | 0.86 | 10.5 | 5.3 | 2010.57 | V |
| 47c | WC5 | 0.41 | 5.4 | 0.4 | 2010.10 | Ep |
| 60-4 | WC8 | 0.32 | 26 | 0.7 | 2014.12 | Ep |
| 75aa | WC9d | 0.17 | 4.7 | 9.5 | 2010.17 | V |
| 75d | WC9 | 0.32 | 5.5 | 1.3 | 2010.67 | V |
| 75-11 | WC9d? | 0.24 | 18.1 | 0.2 | 2010.67 | Ep |
| 77t | WC9d | 0.49 | 8.9 | 1.8 | 2010.67 | V |
| 91-1 | WC7 | 0.66 | 27 | 0.2 | 2014.20 | Ep |
| 122-14 | WC8 | 0.25 | 48 | 0.3 | 2010.75 | Ep? |
| 125-1 | WC8 | 0.33 | 5.1 | 0.2 | 2010.30 | Ep |
Galactic variable dust makers are listed in Table 6, which includes stars previously identified as dust makers or uncertain (‘d’ or ‘d?’) and those newly found to be dust makers here. Along with amplitudes , the Table gives the reddening determined for each and ratio of dust to wind flux in the band, susceptible to uncertainty due to variability. For one of the variables, WR 122-14, it is not possible with data presently available to distinguish between the effects of very heavy reddening and dust emission: deeper photometry at one or more wavelengths shorter than is required to disentangle these effects (cf. Section 4.11). The final column aims to classify the variation as episodic (Ep), in which dust is formed for only part of the time, or variable (V), in which dust forms persistently but at a variable rate. Stars which show stellar wind emission some of the time can securely be identified as episodic dust makers but the distinction is otherwise more difficult, as is discussed further below. To the stars in this Table must be added the episodic dust maker HD 38030 in the LMC. Details are given in Section 4, where the stars are discussed individually.
Four of the stars newly found to be dust makers (Table 5), WR 60-2, 122-1, 124-20 and 124-22, and not considered variable on the basis of their dispersions, have semestral-to-orbital dispersion ratios (Table 1) and may be low amplitude variables better included in Table 6, but this needs further study.
Of the stars classified as possible dust makers (‘d?’) in the Catalogue, one, WR 75-11, was found to be a variable dust maker and is included in Table 6. The SEDs of the two other stars in the sample classified as possible dust makers, WR 72-3 and WR 124-5, were examined and found to be fitable by stellar winds suffering extinctions of 23.4 and 22 mag., respectively, with no evidence for dust emission. It is striking that all of the stars found to be variable in the NEOWISE-R data, with the exceptions of WR 60-3 and the previously known variables mentioned above, are dust makers.
4 Comments on individual dust-emission variables
4.1 The known episodic dust-maker WR 19
| Date | Phase | Survey | ||
|---|---|---|---|---|
| 2010.01 | 0.28 | 8.150.01 | 7.540.01 | All-Sky |
| 2010.50 | 0.32 | 8.200.01 | 7.700.01 | All Sky |
| 2011.02 | 0.37 | 8.220.01 | 7.780.01 | Post Cryo |
| 2014.02 | 0.67 | 8.250.01 | 7.930.01 | NEOWISE-R |
| 2014.51 | 0.72 | 8.250.01 | 7.910.01 | NEOWISE-R |
| 2015.02 | 0.77 | 8.250.01 | 7.920.01 | NEOWISE-R |
| 2015.49 | 0.82 | 8.250.01 | 7.930.01 | NEOWISE-R |
| 2016.02 | 0.87 | 8.260.01 | 7.920.01 | NEOWISE-R |
| 2016.48 | 0.91 | 8.240.01 | 7.920.01 | NEOWISE-R |
| 2017.01 | 0.97 | 8.240.01 | 7.920.01 | NEOWISE-R |
| 2017.46 | 0.01 | 8.150.01 | 7.740.01 | NEOWISE-R |
| 2018.01 | 0.07 | 5.500.08 | 4.510.09 | NEOWISE-R |
| 2018.45 | 0.11 | 6.020.05 | 5.070.12 | NEOWISE-R |

The first IR photometry of WR 19 in 1988-90 showed it to be fading from an inferred dust-formation episode (Williams et al., 1990b). Further observations by Veen et al. (1998) found another dust formation epsiode, from which they derived a period of 10.1 y. They also observed absorption lines in its spectrum, indicating the presence of a O9.5-9.7 type companion to the WC star, in line with the original classification WC5+OB by Smith (1968a) in her discovery paper. Fading from a third dust-formation episode was observed by Williams, Rauw & van der Hucht (2009b), who also determined a RV orbit (using the IR period as a prior) from the absorption lines showing high eccentricity () and having periastron passage close to the time of dust formation.
The earliest WISE observations of WR 19 made in 2010 in the All-Sky Survey (in two visits, separated by six months) show WR 19 to be still fading from its 2007–08 dust outburst. The All-Sky Survey data in Table 7 come from averaging the individual observations in the Single Exposure Source Table for the two visits separately in order to retain the temporal information. When observed in the Post-Cryo survey in 2011, the IR emission had faded to close to the average wind level.
The first seven NEOWISE-R observations (Table 7), which cover orbital phases 0.67–0.97 on the elements of Williams et al. (2009b), show constant values of = 8.25 and = 7.92, These are consistent with the stellar wind flux and measured at the nearby wavelengths of 3.8 and 3.6 and measured at 4.7 (Williams et al., 1990b; Veen et al., 1998), and give a better definition of the stellar wind flux level and its constancy than the ground-based data. The eighth NEOWISE-R observation at phase 0.01 shows and to have brightened by 0.09 and 0.18 mag. respectively, signalling the beginning of a new dust formation episode. The 2018 observations, at phases 0.07 and 0.11, show and to have brightened to above the NEOWISE-R saturation limits. To get estimates of the de-saturated and for comparison with the earlier data, offsets from Mainzer et al. (2014, figure 6) were applied to these data. The photometry, together with the earlier and (Williams et al., 1990b; Veen et al., 1998), is plotted against orbital phase in Fig. 3. The NEOWISE-R data fit the earlier data well and give a better idea of the timing of the dust formation. Finer cadence than that provided by the NEOWISE-R observations will be needed to define the rise to maximum more precisely, but it is evident that the duration of dust formation is very brief – presumably related to the relatively high eccentricity (, Williams et al. (2009b)), making WR 19 an analogue of WR 140. It deserves a better, double-lined spectroscopic orbit and search for spectroscopic signatures (‘sub-peaks’ on low excitation lines) of colliding wind effects.
Sugawara, Maeda & Tsuboi (2017) have observed the X-ray emission from WR 19, finding that, as it approached periastron, the column density increased, as expected if the colliding wind X-ray source moved more deeply into the WR wind. Leitherer, Chapman & Koribalski (1997) observed only upper limits to the radio flux from WR 19 but deeper observations to look for non-thermal radio emission would be worthwhile.
4.2 WR 46-7 = 2MASS J12100795–6244194
| Date | Source | ||||
|---|---|---|---|---|---|
| 2000.08 | 9.84 | DENIS | |||
| 2000.27 | 9.74 | 2MASS | |||
| 2004.55 | 8.29 | 7.85 | GLIMPSE | ||
| 2010.08 | 9.19 | 8.44 | 6.40 | All-Sky | |
| 2010.57 | 8.32 | 7.67 | 6.28 | All-Sky | |
| 2011.08 | 9.06 | 8.41 | Post-Cryo | ||
| 2013.11 | 10.40 | VVV | |||
| 2013.11 | 10.35 | VVV | |||
| 2013.23 | 10.36 | VVV | |||
| 2014.09 | 9.09 | 8.43 | NEOWISE-R | ||
| 2014.57 | 9.18 | 8.49 | NEOWISE-R | ||
| 2015.08 | 8.33 | 7.68 | NEOWISE-R | ||
| 2015.56 | 8.99 | 8.35 | NEOWISE-R | ||
| 2016.07 | 9.12 | 8.41 | NEOWISE-R | ||
| 2016.55 | 8.36 | 7.69 | NEOWISE-R | ||
| 2017.08 | 8.99 | 8.34 | NEOWISE-R | ||
| 2017.53 | 9.14 | 8.41 | NEOWISE-R | ||
| 2018.08 | 8.39 | 7.68 | NEOWISE-R | ||
| 2018.52 | 8.77 | 8.12 | NEOWISE-R |
Mauerhan et al. (2009) identified WR 46-7 as a Wolf-Rayet star from its IR colours and classified it as a WC5–7 star from its -band spectrum. The NEOWISE-R observations (Table 8) show it to be mag. brighter in and in the third (2015.08), sixth (2016.65) and ninth (2018.08) visits. Magnitudes from the WISE All-Sky survey which, in this case, observed WR 46-7 in two visits separated by six months, shows that it was similarly brighter in all three filters in the second (2010.57) All-Sky visit. The entries for , and in Table 8 for the All-Sky Survey come from averaging the individual observations in the Single Exposure Source Table to separate those made in the two visits, as for the NEOWISE-R data, in order to retain the temporal information. Six months later, observation in the Post-Cryo survey (2011.08) found WR 46-7 in its faint state again.
When observed in the GLIMPSE survey, WR 46-7 was also in its bright state. The [3.6] and [4.5] magnitudes from the GLIMPSE surveys are listed under and in Table 8 and the Tables in the remainder of this Section without adjustment for the differences in the photometric bands. Jarrett et al. (2011) found that and and the corresponding IRAC [3.6] and [4.5] magnitudes for a large sample of stars near the ecliptic poles agreed well, with small offsets resulting from slightly different wavelengths of the filters. In case the different continua and emission lines in WC spectra might give different results, the WISE and GLIMPSE magnitudes of WC stars were compared and found to show mean offsets –[3.6] = -0.020.03 and –[4.5] = 0.060.02 from 25 and 26 stars respectively. As these are smaller than the dispersions in the differences ( = 0.14 and 0.12 mag.), the GLIMPSE data have not been adjusted for the light curves in this paper, but the WISE and GLIMPSE data sets are treated separately for the production of the SEDs.
The observation date is taken from the Spitzer Heritage Archive. The interval between this date and that of the brighter All-Sky observation ( y.) is four times the c. 1.5-yr period suggested by the WISE data. The GLIMPSE data are consistent with the latter, but do not improve the phase coverage. The data are too few and evenly spaced for a confident period determination: Lafler-Kinman (Lafler & Kinman, 1965) searches on the WISE and GLIMPSE data give periods of 1.49 y, unfortunately close to three times the semesterly cadence of the WISE visits, and 0.75 y. Data having a different cadence are required to determine the period; unfortunately, WR 46-7 is too bright to get a light curve from the VVV (most of the observations are flagged as being near saturation) so, for the present, the 1.49-y period is adopted. The mid-IR light curves phased to this period are plotted in Fig. 4.


The SED representing WR 46-7 near maximum is given in Fig. 5. The line is the flux from a model comprising wind emission fitted to short wavelength data (, , and ) together with a cloud of 1040-K dust. The longer wavelength GLIMPSE data, [5.8] = 7.52 and [8.0] = 7.36, observed at phase 0.92 shortly before maximum are consistent with strong dust emission. The fit excludes (11 m), which has a significantly higher profile-fitting metric , and which may owe its anomalous brightness to the inclusion of extended emission not associated with the WR star. The model for the wind emission was a power-law as described in Section 3.2 above; because WR 46-7 is a good candidate CWB, the fit was repeated using an alternative SED derived from the WC8+O9 binary Velorum yielding a slightly higher reddening ( = 10.8 compared with 10.5) and 3.4-m dust/wind ratio (8.5 compared with 5.3, cf. Table 6). This serves to illustrate the effect of uncertainty in the wind emission; without knowledge of the relative contributions of the possible OB companion and WC6-7 star fluxes, the power-law wind SEDs will be used for the present.
The mean – colours near maximum, 0.670.02, and minimum (phase 0.70), 0.730.02, show evidence for cooling of the dust as it is dispersed by the stellar wind. They are much redder than the reddened stellar wind colour, 0.37, suggesting that dust formation continues the whole time, albeit at a variable rate.
4.3 WR 47c = SMSNPL 7
| Date | Source | ||
|---|---|---|---|
| 2004.55 | 8.940.04 | 8.640.03 | GLIMPSE |
| 2010.10 | 9.010.01 | 8.600.04 | All Sky |
| 2010.59 | 9.000.03 | 8.610.04 | All Sky |
| 2012.27 | 9.110.05 | 8.740.03 | Deep GLIMPSE |
| 2014.10 | 9.290.01 | 8.950.01 | NEOWISE-R |
| 2014.60 | 9.340.01 | 8.990.01 | NEOWISE-R |
| 2015.10 | 9.380.01 | 9.050.01 | NEOWISE-R |
| 2015.58 | 9.410.02 | 9.090.01 | NEOWISE-R |
| 2016.10 | 9.520.01 | 9.190.01 | NEOWISE-R |
| 2016.56 | 9.470.01 | 9.160.01 | NEOWISE-R |
| 2017.10 | 9.610.01 | 9.300.01 | NEOWISE-R |
| 2017.55 | 9.550.02 | 9.260.01 | NEOWISE-R |
| 2018.10 | 9.630.01 | 9.330.01 | NEOWISE-R |
| 2018.54 | 9.590.01 | 9.340.02 | NEOWISE-R |

WR 47c was identified as a WR star in the narrow-band optical (4686-Å) survey of Shara et al. (1999), who classified it as WC5 and gave magnitudes = 17.49, = 16.09 (on the narrow-band system (Smith, 1968b)) measured from their fluxed spectra. The NEOWISE-R observations (Table 9 and Fig. 6) show slow fading in 2014–2018 and are significantly fainter than in the two visits of the All-Sky Survey made in 2010.10 and 2010.59. The 2018 and are constsnt with a reddened stellar wind fitted to the , , , , and photometry, classifying WR 47c as an episodic dust maker.
The Deep GLIMPSE observations, made between the All-Sky and NEOWISE-R observations, fits the steady fading well (Fig. 6). The 2004 GLIMPSE data, taken 5.5 years before the first All-Sky observation, also has WR 47c bright. The long duration of the fading observed with WISE suggests that there would not have been time for another dust formation and fading episode in the five years between the GLIMPSE and All-Sky observations. This implies that the system was at broad maximum in 2004–2010 and has a long period, exceeding 14 y.
4.4 Short-term variability of WR 60-3 = MDM 11

As noted above, eclipses were found in the NEOWISE-R photometry of WR 60-3. Examination of the 3-Band Cryo Single Exposure Source table showed another eclipse. A Lafler-Kinman period search on all the photometry gave a well-defined period of 1.8649 d. Photometry in the VVV was searched for periodicity, the 80 magnitudes gave = 1.8648 days. Light curves phased to 1.8649 d show no convincing secondary minima but curves (Fig. 7) phased to twice this period appear to show slightly different primary and secondary minima, so it is likely that the true period is 3.7298 d. There is no evidence for dust emission so this system will not be discussed further here.
4.5 WR 60-4 = MDM 12
| Date | Source | ||
|---|---|---|---|
| 2004.19 | 9.500.03 | 8.890.05 | GLIMPSE |
| 2010.12 | 9.740.02 | 8.910.02 | All-Sky |
| 2010.61 | 9.740.02 | 8.890.02 | 3-Band Cryo |
| 2014.12 | 9.520.02 | 8.650.02 | NEOWISE-R |
| 2014.62 | 9.790.02 | 8.960.04 | NEOWISE-R |
| 2015.12 | 9.690.02 | 8.880.02 | NEOWISE-R |
| 2015.60 | 9.470.01 | 8.580.02 | NEOWISE-R |
| 2016.12 | 9.680.02 | 8.860.03 | NEOWISE-R |
| 2016.59 | 9.660.02 | 8.820.01 | NEOWISE-R |
| 2017.12 | 9.480.03 | 8.590.02 | NEOWISE-R |
| 2017.57 | 9.690.02 | 8.870.01 | NEOWISE-R |
| 2018.12 | 9.730.02 | 8.900.02 | NEOWISE-R |
| 2018.57 | 9.640.02 | 8.770.02 | NEOWISE-R |
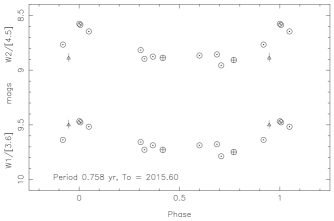
WR 60-4 was discovered by Mauerhan et al. (2011), who designated it MDM 12 and classified its spectrum as WC8. The photometry is collected in Table 10. Like WR 46-7, the variations seem commensurate with the cadence of observations: the first, fourth and seventh NEOWISE-R observations show WR 60-4 to be significantly brighter than in the All-Sky and 3-Band Cryo surveys, suggesting a period near 1.5 y, like WR 46-7. Period searches on these and the GLIMPSE photometry suggest periods near 1.55, 0.76 and 0.38 d., examination of phased light curves (Fig. 8) favours 0.758 d. Further observations having a different cadence would help determine the period. There are 56 magnitudes observed in the VVV between 2010.4 and 2013.5 which show small amplitude ( 0.2 mag) variation but none were taken near the maxima derived from the mid-IR data nor do they favour any of the suggested periods.
The star is heavily reddened, with derived using and from the VVV Survey. The stellar wind so reddened has . This is very close to the average = 0.83 observed between phases 0.2 and 0.8, indicating no dust emission during this time and classifying WR 60-4 as an episodic dust maker.
4.6 WR 75aa = HBD 1
| Date | Survey | |||
|---|---|---|---|---|
| 2010.17 | 8.140.02 | 7.460.02 | 6.920.02 | All-Sky |
| 2010.66 | 8.100.02 | 7.430.02 | 6.910.06 | 3-Band Cryo |
| 2014.18 | 8.270.01 | 7.600.01 | NEOWISE-R | |
| 2014.67 | 8.170.01 | 7.510.01 | NEOWISE-R | |
| 2015.17 | 8.180.01 | 7.510.01 | NEOWISE-R | |
| 2015.66 | 8.100.01 | 7.440.01 | NEOWISE-R | |
| 2016.17 | 8.150.01 | 7.490.01 | NEOWISE-R | |
| 2016.64 | 8.120.01 | 7.470.01 | NEOWISE-R | |
| 2017.17 | 8.170.01 | 7.500.01 | NEOWISE-R | |
| 2017.63 | 8.250.01 | 7.580.01 | NEOWISE-R | |
| 2018.17 | 8.190.01 | 7.540.01 | NEOWISE-R | |
| 2018.61 | 8.100.01 | 7.440.01 | NEOWISE-R |

Hopewell et al. (2005) identified WR 75aa as a WC9 star from its strong line emission in the AAO/UKST H survey, and as a dust emitter on the basis of its red and near-IR colours. The WISE photometry is collected in Table 11 and plotted in Fig. 9. Taken on their own, the NEOWISE-R data suggest a period near 3.25 y., but this is not fit by the 2010 data. The star is fainter than the NEOWISE-R saturation limits, so offsets between the NEOWISE-R and cryogenic (All-Sky and 3-Band Cryo) data are not expected and WR 75aa has to be considered as an irregular variable. Unfortunately, there are no GLIMPSE data, presumably on account of the star’s distance () from the Plane. Also, it is too bright to form a light curve from the VVV survey data.
4.7 WR 75d = HBD 3
| Date | Source | |||
|---|---|---|---|---|
| 2004.68 | 8.260.03 | 7.850.05 | GLIMPSE | |
| 2010.17 | 8.030.02 | 7.550.02 | 7.100.02 | All-Sky |
| 2010.67 | 7.880.02 | 7.390.02 | 7.220.07 | 3-Band Cryo |
| 2014.18 | 8.220.02 | 7.710.01 | NEOWISE-R | |
| 2014.68 | 8.240.02 | 7.730.02 | NEOWISE-R | |
| 2015.17 | 8.090.01 | 7.550.01 | NEOWISE-R | |
| 2015.66 | 8.130.03 | 7.560.03 | NEOWISE-R | |
| 2016.18 | 8.100.02 | 7.500.02 | NEOWISE-R | |
| 2016.64 | 8.230.02 | 7.690.01 | NEOWISE-R | |
| 2017.17 | 8.230.02 | 7.680.01 | NEOWISE-R | |
| 2017.63 | 8.220.01 | 7.620.01 | NEOWISE-R | |
| 2018.17 | 8.330.02 | 7.760.01 | NEOWISE-R | |
| 2018.62 | 8.290.01 | 7.720.02 | NEOWISE-R |

This is another WC9 star identified by Hopewell et al. (2005), but it was not considered to be a dust maker. The photometry is collected in Table 12. During 2010, in the six months between the All-Sky and 3-Band-Cryo observations, WR 75d brightened significantly in and (but not ) to its brightest observed in this progamme, and brighter than observed in the GLIMPSE Survey in 2004.
The SED using WISE 3-Band Cryo Survey data is plotted in Fig. 10; this sampled WR 75d at its brightest and can be seen to lie above that from the GLIMPSE data. Although the latter (and the 2018 NEOWISE-R data) show WR 75d at its faintest, the fluxes are still above the stellar wind level, suggesting that WR 75d is not an episodic but a variable dust maker. No periodicity was found in the mid-IR photometry.
4.8 WR 75-11 = MDM 26
| Date | Source | ||
|---|---|---|---|
| 2004.25 | 9.300.05 | 8.730.08 | GLIMPSE |
| 2010.17 | 9.500.02 | 8.910.02 | All-Sky |
| 2010.67 | 9.260.03 | 8.650.02 | 3-Band Cryo |
| 2012.75 | 8.740.03 | Deep GLIMPSE | |
| 2014.18 | 9.340.01 | 8.820.01 | NEOWISE-R |
| 2014.68 | 9.400.03 | 8.900.01 | NEOWISE-R |
| 2015.17 | 9.400.01 | 8.830.01 | NEOWISE-R |
| 2015.66 | 9.500.02 | 9.000.01 | NEOWISE-R |
| 2016.18 | 9.520.01 | 8.990.01 | NEOWISE-R |
| 2016.64 | 9.530.02 | 9.020.02 | NEOWISE-R |
| 2017.17 | 9.420.01 | 8.880.01 | NEOWISE-R |
| 2017.63 | 9.410.01 | 8.880.01 | NEOWISE-R |
| 2018.17 | 9.410.01 | 8.890.01 | NEOWISE-R |
| 2018.62 | 9.430.01 | 8.910.01 | NEOWISE-R |

Mauerhan et al. (2011) identified WR 75-11 (their MDM 26) as a WR star on the basis of its IR colours and classified its spectrum as ‘WC9d?’. They noted that the emission lines in their - and -band spectra observed on 2010 May 26 were relatively weak, possibly as a result of dilution from thermal dust emission, but hesitated to classify the star as a dust maker because its IR colours were not characteristic of dust emission. The WISE data (Table 13) help resolve this apparent discrepancy, showing that and brightened by about 0.25 mag. between 2010.17 and 2010.67, consistent with a dust-formation episode occurring between these dates. After the 3-Band Cryo observation in 2010.67, the IR flux faded so that the VVV and Deep GLIMPSE [4.5] magnitudes in 2012 were close to their earlier and GLIMPSE values. The NEOWISE-R observations in 2014–2015 showed continued fading in and (Fig. 11). Even at maximum, the dust emission is marginal – the ratio dust/wind at 3.4 is only 0.2 and this soon faded, so WR 75-11 should classed as an episodic dust maker showing stellar wind emission for some of the time, but with rather uneven dust formation episodes.
4.9 WR 77t = HBD 5
| Date | Source | |||
|---|---|---|---|---|
| 2004.68 | 7.040.04 | 6.510.04 | GLIMPSE | |
| 2010.18 | 7.090.01 | 6.440.01 | 6.030.02 | All-Sky |
| 2010.67 | 7.000.01 | 6.300.01 | 6.010.03 | 3-Band Cryo |
| 2014.19 | 6.820.02 | 6.230.01 | NEOWISE-R | |
| 2014.68 | 6.910.02 | 6.360.02 | NEOWISE-R | |
| 2015.18 | 6.960.03 | 6.410.02 | NEOWISE-R | |
| 2015.67 | 6.710.03 | 6.220.03 | NEOWISE-R | |
| 2016.18 | 7.140.03 | 6.560.03 | NEOWISE-R | |
| 2016.65 | 6.650.02 | 6.180.02 | NEOWISE-R | |
| 2017.18 | 6.710.03 | 6.230.02 | NEOWISE-R | |
| 2017.64 | 7.120.04 | 6.580.02 | NEOWISE-R | |
| 2018.18 | 6.810.02 | 6.340.03 | NEOWISE-R | |
| 2018.62 | 7.100.04 | 6.550.02 | NEOWISE-R |

This is another WC9 star identified by Hopewell et al. (2005), who considered it to be a dust maker. Unfortunately, WR 77t is brighter than NEOWISE-R saturation limits, which may account for some of the range seen in its NEOWISE-R photometry (Table 14) and the differences from the cryogenic data. The dispersions in and for stars having similar brightness to WR 77t ( 0.037 and 0.031, Section 2) suggest that the offsets between the NEOWISE-R and cryogenic magnitudes may be similar for each observation of any particular star of that brightness. Assuming this applies to WR 77t, the NEOWISE-R data were searched for a period, yielding 1.26 y. The NEOWISE photometry phased to this period, together with the cryogenic data offset to match as derived from Mainzer et al. (2014, figure 6) are shown in Fig. 12. The discordance of some of the data suggests that the assumption of constant offset may be wrong, but it seems safe to conclude that WR 77t is a variable on a time scale of 1–2 y. It is far too bright for a light curve from VVV , but it is bright enough for a dedicated IR photometric study.
4.10 WR 91-1 = SMG09 1222_15
| Date | Source | ||
|---|---|---|---|
| 2005.72 | 9.340.04 | 8.700.06 | GLIMPSE II |
| 2006.32 | 9.160.05 | 8.720.07 | GLIMPSE II |
| 2010.20 | 9.570.02 | 8.650.02 | All Sky |
| 2010.69 | 9.570.02 | 8.660.02 | 3-Band Cryo |
| 2014.20 | 8.910.01 | 7.660.01 | NEOWISE-R |
| 2014.70 | 9.150.01 | 7.900.01 | NEOWISE-R |
| 2015.19 | 9.350.01 | 8.200.01 | NEOWISE-R |
| 2015.68 | 9.440.03 | 8.350.01 | NEOWISE-R |
| 2016.20 | 9.520.01 | 8.520.01 | NEOWISE-R |
| 2016.66 | 9.560.01 | 8.570.01 | NEOWISE-R |
| 2017.20 | 9.590.01 | 8.610.01 | NEOWISE-R |
| 2017.65 | 9.610.01 | 8.680.01 | NEOWISE-R |
| 2018.20 | 9.600.01 | 8.670.01 | NEOWISE-R |
| 2018.65 | 9.610.01 | 8.730.01 | NEOWISE-R |

This was identified as a WR star by Shara et al. (2009), who designated it 1222_15 and classified it as WC8 from its -band spectrum. From a -band spectrum, Rosslowe & Crowther (2015) re-classified it as WC7. The only published photometry at shorter wavelengths is from the VVV but it was possible to measure in a 2-arcsec aperture on the image retrieved from the VVV archive and to use that, together with and , to determine the reddening: = 27.
The first NEOWISE-R observations in 2014.20 found WR 91-1 to be significantly brighter than in the All-Sky and 3-Band Cryo surveys in 2010 (Table 15, Fig. 13) and redder compared with previously. Subsequent NEOWISE-R observations (2014.70 – 2018.65) showed steady fading towards the levels seen in the All-Sky and Post-Cryo surveys, fading more slowly because the newly formed dust was cooling – as seen in other episodic dust makers, cf. light curves of WR 140 Williams et al. (2009a, fig. 1). Evidently, that there was a dust-formation episode some time between 2010.69 and 2014.20. The 4.4-y duration of the mid-IR fading is too long for there to have been a dust formation and fading episode in the 3.9 y between the second GLIMPSE and first WISE observations, so the fading from any previous episode must have been complete by 2005, implying a period of at least 13 y. if such events are periodic.
4.11 WR 122-14 = KSF14 1553-15DF
| Date | Source | ||
|---|---|---|---|
| 2004.31 | 9.540.04 | 8.780.03 | GLIMPSE |
| 2010.25 | 9.730.03 | 8.660.02 | All-Sky |
| 2010.75 | 9.620.03 | 8.510.03 | Post-Cryo |
| 2012.44 | 9.340.04 | 8.540.03 | Deep GLIMPSE |
| 2014.76 | 9.690.02 | 8.630.02 | NEOWISE-R |
| 2015.26 | 9.770.02 | 8.720.02 | NEOWISE-R |
| 2015.75 | 9.860.02 | 8.790.02 | NEOWISE-R |
| 2016.26 | 9.870.02 | 8.810.02 | NEOWISE-R |
| 2016.73 | 9.870.02 | 8.790.02 | NEOWISE-R |
| 2017.26 | 9.720.01 | 8.680.01 | NEOWISE-R |
| 2017.72 | 9.830.01 | 8.750.01 | NEOWISE-R |
| 2018.26 | 9.570.01 | 8.500.01 | NEOWISE-R |
| 2018.70 | 9.670.01 | 8.590.01 | NEOWISE-R |

This was identified as a WR star by Kanarek et al. (2015), who classified it WC8. It brightened in and between the All-Sky and Post-Cryo survey observations (Table 16, Fig. 14) and brightened further to a broad maximum at the time of Deep GLIMPSE observations, and then faded to a constant level in 2015.75–2016.73. It is very heavily reddened: there appears to be no photometry shortward of 1 micron or even in . From the -band image in the UKIDSS Data Archive, it was possible to measure . The SED can be fitted by a stellar wind reddened by = 48 using this and the UKIDSS , providing an upper limit to the reddening. This SED fits the NEOWISE-R data at minimum, supporting the suggestion that WR 122-14 is an episodic dust maker, but it is also possible that the reddening is less than estimated from , so that dust emission was occurring in 2015–16 as well.
4.12 The previously known dust-maker WR 125
| Date | Survey | ||
|---|---|---|---|
| 2010.29 | 7.790.02 | 7.400.02 | All-Sky |
| 2010.79 | 7.770.02 | 7.290.02 | Post Cryo |
| 2014.80 | 7.770.01 | 7.430.01 | NEOWISE-R |
| 2015.30 | 7.780.01 | 7.450.01 | NEOWISE-R |
| 2015.78 | 7.750.01 | 7.420.01 | NEOWISE-R |
| 2016.29 | 7.760.01 | 7.450.01 | NEOWISE-R |
| 2016.76 | 7.760.01 | 7.430.01 | NEOWISE-R |
| 2017.29 | 7.790.01 | 7.440.01 | NEOWISE-R |
| 2017.76 | 7.730.01 | 7.420.01 | NEOWISE-R |
| 2018.30 | 7.690.01 | 7.360.01 | NEOWISE-R |
| 2018.74 | 7.550.02 | 7.060.02 | NEOWISE-R |
Because WR 125 resembled WR 140 in terms of its radio and X-ray emission and unusual breadth of its emission lines for its WC7 spectral type, it was monitored in the IR to search for evidence of dust emission, leading to discovery of a dust-formation episode starting in 1990 (Williams et al., 1992). Further observations (Williams et al., 1994) showed the IR flux reached a maximum in 1992–93 and also found absorption lines in its spectrum, supporting its interpretation as a colliding wind binary. The IR emission faded and, by the date (1997 June 16) of the 2MASS observation, the 2-micron flux ( = 8.21) had faded close to the 1981–89 pre-outburst mean ( = 8.25).
The 2014–17 NEOWISE-R observations (Table 17) show WR 125 at constant levels, = 7.76 ( 0.02) and = 7.43 ( 0.01), close to the 1988–89 pre-outburst means = 7.75 and = 7.32. The 2018 observations, however, show slow brightening, to = 7.550.01 and = 7.060.01 in 2018.74, 0.18 and 0.32 mag. above the wind level and redder than it, indicating the beginning of another dust formation event. Comparison with the sparse and photometry in 1990–91 (Williams et al., 1992) suggests an interval of about 28.3 y between the episodes. Further observations are needed to define the dust formation and confirm its periodicity. Confirmation that WR 125 is indeed brightening in the IR has been provided by recent ground-based photometry by Shenavrin (2019, private communication). Midooka, Sugawara & Ebisawa (2019) found no variation in the X-ray emission from four observations in 2016–17, giving no suggestion of approach to periastron passage, but re-observation now would be valuable.
4.13 WR 125-1 = HDM 15
| Date | Source | |||
|---|---|---|---|---|
| 1997.46 | 9.070.02 | 2MASS | ||
| 2004.78 | 8.170.02 | 7.780.03 | GLIMPSE | |
| 2006.52 | 9.320.00 | UKIDSS | ||
| 2010.30 | 8.230.02 | 7.580.02 | All-Sky | |
| 2010.80 | 8.210.01 | 7.500.02 | Post-Cryo | |
| 2014.31 | 8.490.01 | 8.000.01 | NEOWISE-R | |
| 2014.80 | 8.460.01 | 7.990.01 | NEOWISE-R | |
| 2015.30 | 8.490.01 | 8.020.01 | NEOWISE-R | |
| 2015.79 | 8.540.01 | 8.070.01 | NEOWISE-R | |
| 2016.30 | 8.540.01 | 8.080.01 | NEOWISE-R | |
| 2016.77 | 8.540.01 | 8.110.01 | NEOWISE-R | |
| 2017.30 | 8.570.01 | 8.140.01 | NEOWISE-R | |
| 2017.76 | 8.540.01 | 8.120.02 | NEOWISE-R | |
| 2018.30 | 8.580.01 | 8.160.01 | NEOWISE-R | |
| 2018.75 | 8.560.01 | 8.160.01 | NEOWISE-R |

WR 125-1 was identified as a WR star by Hadfield et al. (2007) from its IR colours, designated HDM15 and classified WC8 from the C iv/C iii line ratios in the - and bands, confirmed by comparison of its -band spectrum with that of the WC8 spectral standard WR 135. Examination of this comparison (their fig 4) suggests that the emission lines in HDM15 are about half as strong as those in WR 135. The same weakness is seen in other wavelength regions: the equivalent widths (EWs) of the 0.971- C iii and 0.990- C iv features are about half those of the corresponding features in WR 135 measured by Howarth & Schmutz (1992), while that of the 2.076- C iv feature is also about half that of the corresponding feature in the WR 135 spectrum observed by Williams & Eenens (1989). These differences suggest that the WC8 spectrum of HDM15 is diluted by another continuum source having about the same luminosity as the WC8 star; the extension of the dilution to wavelengths as short as 0.971 argues strongly against dilution by heated dust emission and suggests the presence of a line-of-sight or binary companion to the WC8 star in WR 125-1. The UKIDSS image was searched for a line-of-sight companion that could have contaminated the spectrum but none was found; of neighbours within 5 arc sec, the brightest is almost 4 mag fainter in . 0.02
It is therefore probable that the WC8 star has a luminous companion which should be searched for spectroscopically.
The NEOWISE-R and are significantly fainter than those observed in the All-Sky and Post-Cryo surveys (Table 18) and indicate that the relatively modest dust emission observed earlier had faded so as to be unobservable relative to the wind (Fig. 15). The photometry suggests that the maximum had occurred prior to the 2MASS observation in 1997, but the gap in coverage between that and subsequent observations is too long to rule out a shorter time-scale. The GLIMPSE observations in 2004.78 show WR 125-1 at an intermediate level. Evidently WR 125-1 is another episodic dust maker.
4.14 HD 36402 = BAT99–38 = Br 31
| Date | Survey | ||
|---|---|---|---|
| 2010.41 | 9.440.02 | 8.570.02 | All-Sky |
| 2010.91 | 9.250.01 | 8.380.01 | Post-Cryo |
| 2014.42 | 9.980.01 | 9.110.01 | NEOWISE-R |
| 2014.92 | 9.780.01 | 8.930.01 | NEOWISE-R |
| 2015.41 | 9.530.01 | 8.690.01 | NEOWISE-R |
| 2015.90 | 9.320.01 | 8.480.01 | NEOWISE-R |
| 2016.41 | 9.290.01 | 8.430.01 | NEOWISE-R |
| 2016.89 | 9.480.01 | 8.600.01 | NEOWISE-R |
| 2017.41 | 9.750.01 | 8.860.01 | NEOWISE-R |
| 2017.89 | 10.050.01 | 9.200.02 | NEOWISE-R |
| 2018.41 | 10.170.01 | 9.330.01 | NEOWISE-R |
| 2018.88 | 10.180.01 | 9.320.01 | NEOWISE-R |
Spectroscopy of HD 36402 in the LMC suggests that it is a triple system. From the WR emission lines, Moffat et al. (1990), derived an 3.03-d orbit which was not shared by the absorption lines, suggesting that the O8 supergaint in which the latter formed did not participate in the 3-d orbit, but was in a longer period orbit about the inner WC4+O? binary. Variations in the dust emission from HD 36402 based on IR data from a variety of sources was reported by Williams et al. (2013b). From the brightening in 2004–05 and 2009–10, they derived a period near 4.7 y., which they associated with the outer orbit of the O8 supergiant. They found no evidence for variation related to the 3.03-d. orbit in the relatively long visits (21 and 17 d. respectively) in the WISE All-Sky and Post-Cryo surveys.

The NEOWISE-R data (Table 19) cover practically a whole period, with a maximum in early 2016, later than expected from the 4.7-y. period, followed by fading. Re-determination of the period including the NEOWISE-R data suggests a period near 5.11 y.; the WISE data alone give a period of 5.2 y. A phased light curve is given in Fig. 16, where zero phase is set to the epoch of the WISE Post-Cryo observation, close to maximum. The variations are slow, taking 1.5 y. to rise to maximum and the same to fade to minimum. The colour remains significantly greater than that expected of the stellar wind, – = 0.17, indicating continuous dust emission. It barely changes, from an average of – = 0.850.01 in the three visits (2014.4–2015.4) before maximum, when we would expect a higher fraction of hotter, newly-formed dust, to 0.870.01 in the three visits (2016.9-2017.9) after maximum, when one would expect a higher fraction of cooler dust while the emission fades.
Spectroscopy of the O8 supergiant over a period of years is needed to test whether it is a member of a CWB and, if the orbit was elliptical, the relation between its periastron passage and the maximum in dust formation.
4.15 HD 38030 = BAT99–84 = Br 68
| Date | Survey | ||
|---|---|---|---|
| 2005 55 | 12.800.04 | 12.530.05 | SAGE Epoch 1 |
| 2005.83 | 12.810.06 | 12.600.07 | SAGE Epoch 2 |
| 2010.31 | 12.680.02 | 12.480.02 | All-Sky |
| 2010.80 | 12.720.02 | 12.480.02 | Post-Cryo |
| 2014.32 | 12.690.01 | 12.530.01 | NEOWISE-R |
| 2014.82 | 12.700.01 | 12.510.01 | NEOWISE-R |
| 2015.31 | 12.710.01 | 12.520.01 | NEOWISE-R |
| 2015.80 | 12.700.01 | 12.520.01 | NEOWISE-R |
| 2016.31 | 12.710.01 | 12.540.01 | NEOWISE-R |
| 2016.80 | 12.700.01 | 12.540.01 | NEOWISE-R |
| 2017.31 | 12.700.01 | 12.530.01 | NEOWISE-R |
| 2017.77 | 12.710.01 | 12.540.01 | NEOWISE-R |
| 2018.31 | 12.000.01 | 11.260.01 | NEOWISE-R |
| 2018.43 | 11.870.02 | 11.050.02 | NEOWISE-R |
| 2018.76 | 11.520.01 | 10.620.01 | NEOWISE-R |

During 2010–2017, the WISE photometry of HD 38030 (Table 20) showed no variation but, in 2018, the flux was observed to be rising sharply, at rates exceeding 1 mag y-1. The first 2018 visit was sufficiently protracted that it could be split into two and mean magnitudes calculated for the separated segments, giving three observations for 2018. A preliminary report, including light curves, is given by Williams (2019). The colour was also significantly greater than that of the wind emission. This is shown in Fig. 17, where the fluxes from and from the 2018.31 and 2018.76 observations can be compared with the wind SED. Unfortunately, there is no contemporaneous IR photometry at other wavelengths to define the SED but the colour temperature, 830 K from and , is too low for any photospheric emission and points to heated circumstellar dust.
This appears to be the first recorded such event from HD 38030; before the first WISE observations, it was observed in 2005 in the SAGE (Bonanos et al., 2009) survey, having [3.6] and [4.5] magnitudes consistent with the WISE data. In the near-IR, it had comparable magnitudes in the 2MASS 6X Point Source Working Database (Cutri et al., 2012) in 2000–01, the IRSF (Kato et al., 2007) in 2003 and the Vista Magellanic Clouds Survey (Cioni et al., 2011) in 2010. Taken together, these indicate quiescence for at least 17 y. If dust-formation episodes are recurrent, the previous one must have occurred some time before 1998, to allow time for the dust to cool and the emission to fade, implying a period in excess of 20 y.
There is currently no other evidence that HD 38030 is a CWB. Guerrero & Chu (2008) did not detect X-ray emission from HD 38030 in their survey of LMC WR stars using Chandra ACIS. From the lack of variability in RVs observed in 1984 and 1993, Bartzakos, Moffat & Niemela (2001) deduced that HD 38030 was almost certainly a single star and that the absorption lines in its spectrum might arise in a visual OB companion but, given the long period and likely eccentric orbit, the time-span of RV variations might be quite short.
5 Discussion
5.1 Incidence of dust emission
On the basis of their SEDs, 17 Galactic WR stars not previously considered to be dust makers were found here to show dust emission: ten apparently constant (Table 5) and seven variable (Table 6), to which one can add one of the stars (WR 75-11) originally classified as a possible dust maker. This represents more than one-tenth of the present sample, despite the fact that the NEOWISE-R survey is not the best data set for a census of dust formation by WR stars owing to selection effects. First, the saturation limits exclude the IR brighter stars, not only almost all of the previously known WC8–9 dust makers, but also recently identified WC9 stars such as WR 111-12 (Miszalski & Mikołajewska, 2014) which, in the process of inspecting data for the present study, was found to have a bright dust-emission SED. Secondly, the confusion limits excluded more stars in crowded regions, introducing a bias against those in the inner Galaxy, where dust-making WR stars are more common (Rosslowe & Crowther, 2015). Therefore, the present study calls for a re-assessment of the incidence of dust formation by WC stars,
The incidence of dust emission amongst the population of Galactic WC stars as a whole is likely to be underestimated owing to a further layer of selection: many of the more recently identified WR stars in the Catalogue were discovered on the basis of WR line emission in their 2- spectra e.g. (Homeier et al., 2003; Shara et al., 2009, 2012; Kanarek et al., 2015), which will be diluted if there is dust emission in that wavelength region. This introduces a bias against WR stars having the strongest dust emission, so that the true fraction of dust-emitters amongst WC stars in the Galaxy is therefore likely to be significantly underestimated. A search for WR stars based on the -band spectrum, which includes strong emission lines and is less affected by dust emission, could obviate this problem.
The identification of a second WR dust maker in the LMC confirms that this process can occur in stars formed in lower metallicity environments and raises the question of what is the lowest metallicity environment in which WR stars can have strong enough winds to form dust in CWBs.
| Star | — Stellar system properties — | — Dust emission phenomena and properties — | |||||
|---|---|---|---|---|---|---|---|
| spectrum | Binarity status | Refs | Var. type, dates of IR maxima | P(y) | Refs | ||
| WR 19 | WC5 + O9 | = 0.8 ( from IR) | 1, 2 | Ep., (1987), 1997, 2007, 2018 | 2.0 | 10.1 | 3 |
| WR 46-7 | WC5-7 | V., 2010.57, 2015.08, 2016.55, | 0.86 | 1.49 | |||
| WR 47c | WC5 | Ep., 2005–10 (broad maximum) | 0.41 | 14 | |||
| WR 48a | WC8 + WN8 | 4 | V., 1979, 2011; pinwheel | 2.85 | 32.5 | 5, 6 | |
| WR 60-4 | WC8 | Ep., 2015.60, 2017.12 | 0.28 | 0.76 | |||
| WR 65 | WC9 + OB | absorption lines | 7 | V., 1979-80 | 0.41 | 4.8 | 7 |
| WR 70 | WC9 + B0I | SB2 | 8 | V., 1989, 1997, 2008, irregular | 0.6 | 2.8 ? | 9 |
| WR 75aa | WC9d | V., 2010.66, 2015.66, 2018.61 | 0.17 | irreg. | |||
| WR 75d | WC9 | V., 2010.67 | 0.32 | ||||
| WR 75-11 | WC9d? | Ep., 2010.67 | 0.26 | ||||
| WR 77t | WC9d | V., 2016.65 | 0.49 | 1.26 | |||
| WR 91-1 | WC7 | Ep., 2014.20 | 0.66 | 13 | |||
| WR 98a | WC8-9 | V., rotating pinwheel, P 1.54 y | 0.92 | 1.54 | 10, 11 | ||
| WR 112 | WC8-9 | diluted emission lines | 12 | V., pinwheel | 12.3 | 7 | |
| WR 122-14 | WC8 | Ep., 2010.75, 2018.26 | 0.25 | ||||
| WR 125 | WC7 + O9 | absorption lines | 13 | Ep., 1992.7 | 2.75 | 28.3 | 13 |
| WR 125-1 | WC8 | diluted emission lines | Ep., 2010.80 | 0.33 | |||
| WR 137 | WC7 + O9 | = 13.05 y, = 0.18 | 14 | Ep., 1984, 1997, 2010 | 1.59 | 13.05 | 15 |
| WR 140 | WC7 + O5 | = 7.93 y, = 0.8964 | 16 | Ep., 1977, 1985, 1993, 2001, 2009 | 2.57 | 7.94 | 17, 18 |
| HD 36402 | WC4(+O)+O8I | triple system | 19 | V., c.1996.9, 2011, 2016 | 0.73 | 4.7 | 20 |
| HD 38030 | WC4 + OB | Ep., 2018 or later | 1.2 | 20 | |||
-
•
References: 1 Williams et al. (2009b); 2 Crowther et al. (1998); 3 Veen et al. (1998); 4 Zhekov et al. (2014); 5 Marchenko & Moffat (2007); 6 Williams et al. (2012); 7 Williams & van der Hucht (2015); 8 Niemela (1995); 9 Williams et al. (2013a); 10 Monnier et al. (1999); 11 Williams et al. (2003); 12 Cohen & Kuhi (1976); 13 Williams et al. (1994); 14 Lefèvre et al. (2005); 15 Williams et al. (2001); 16 Fahed et al. (2011); Monnier et al. (2011); 17 Williams et al. (1990a, 2009a); 18 Taranova & Shenavrin (2011); 19 Moffat et al. (1990); 20 Williams et al. (2013b).
5.2 Characterising the newly found dust variables
The properties of the new dust variables are collected in Table 21, where they can be compared with the generally better known properties of the previously known systems, including those too bright for NEOWISE-R. The Table does not include apparently constant dust makers which might be low-amplitude variable dust makers, as remarked in Section 3.2 above. The same possibility applies to the dust makers too bright for this study, such as those considered by Williams & van der Hucht (2015). The boundary between constant and variable in small data sets is hard to fix precisely. In CWB dust formation paradigm, stars near this boundary may be members of binary stsems having near circular orbits.
Two of the previously known dust variables in Table 21 call for comment. An extensive IR photometric study of WR 70 (HD 137603) showed variation in dust emission on a range of time scales with a possible period near 2.82 y., but the variations were not strictly regular (Williams et al., 2013a). From the anti-correlation of the RVs of absorption and emission lines, the system is believed to a double-lined spectroscopic binary (Niemela, 1995), but it still lacks an orbit. This deficiency needs to be met, not only to solve the system but also to help understand the variations in dust formation. This may, in turn, help understand apparently irregular variables having far fewer IR observations, like WR 75aa. The second star, WR 112 (CRL 2104), was considered to be variable on the basis of sequences of near-IR photometry in 1988–89 and 1997–2002 showing fading. The 12.3-y. suggested by their separation (Williams & van der Hucht, 2015) was consistent with modelling of its dust pinwheel (Marchenko et al., 2002; Marchenko & Moffat, 2007). Recently, however, new observations by Lau et al. (2017) found that the dust structure about WR 112 was not expanding, with no evidence for long term changes in the mid-IR flux, throwing the 12.3-y.-period into doubt and, indeed, opening up questions about WR dust formation which will have to be addressed elsewhere.
Given under the Stellar system properties in the Table are indications of binarity, ranging from full orbits to dilution of emission lines. These are sparse for the previously known systems and almost non-existent for the new variables found here. Filling these gaps is important if we are to understand the properties of dust making WR stars: although the determination of orbits for systems with long dust-emission periods is daunting, orbits for the brighter, shorter period systems are tractable.
It is apparent that most of the episodic variables (flagged ‘Ep’) have earlier spectral subtype, with only four having subtypes WC8 or WC9, but this may be influenced by the following selection effect. The chance of observing stellar wind emission after dust emission has faded depends on the interplay of the fading time and the interval between dust-formation episodes. The rate at which the dust emission fades depends on the speed of the wind carrying away the dust, diluting the stellar flux heating it so that the dust cools. Stellar winds are generally faster for stars of earlier subtype, so there is a greater probability of observing dust-free emission from an episodic dust maker of earlier spectral subtype than one of later spectral subtype having a slower wind even if the periods are the same. An episodic dust maker with a slow wind may be mistaken for a variable dust maker if there was not enough time for the dust emission to have faded to below wind level before the next dust formation episode began. Consequently, the observational boundary between episodic and variable dust formation is uncertain; modelling of the evolution of the SED from IR phototmetry over a suitably wide range of wavelength should indicate if dust formation continues at a slower rate or ceases.
The duration of observable dust emission from an episodic dust maker also depends on the wavelength at which the emission is observed. This is very apparent in the multi-wavelength light curves of WR 140 (Williams et al., 2009a, fig. 1), which show the mid-IR flux taking a lot longer to fade than the near-IR data. This gives the WISE and bands an advantage in the search for episodic dust makers, but it is still possible that there exist in the data set undiscovered episodic dust makers having very long periods such that the sequence of WISE observations sampled the wind emission only.
6 Conclusions
Photometry from the NEOWISE-R Survey for a sample of 128 Galactic and 12 LMC WC-type WR stars selected to avoid source confusion or saturation has been searched for variability and evidence for circumstellar dust emission. Most of the stars were found to have dispersions in their and photometry of less than 5 per cent. Apart from three previously known variables and a wind eclipsing system found here, all the mid-IR variables are dust emitters. These include six episodic and four persistent variable dust makers in the Galaxy and one of each in the LMC. Eight of these stars were newly found to be dust makers in this study. Examination of the SEDs of the apparently non variable stars found a further ten new dust makers. This discovery of additional dust makers, and the selection effects which make this an underestimate, demonstrate the necessity for reinvestigation of the incidence of dust formation by WR stars.
The spectral subtypes of the new episodic dust makers have a wider range than those previously known, and include three WC8 and one WC9 star, while those of the variable persistent dust makers are mostly WC8–9 stars. The distinction between episodic and variable persistent dust makers favours identification of earlier subtype systems as episodic, so the distinction is not watertight. Also, three of the newly found constant dust makers have spectral subtypes earlier than WC8–9 – the first such stars showing this property. The distribution of dust formation properties by spectral subtype is more nuanced than previously thought, but there is still a gradation of decreasing variability as one moves from earlier to later subtype.
Of the previously known episodic dust makers, the NEOWISE-R observations of WR 19 captured its expected rise to maximum in 2017-18, while those of WR 125 the beginning of a new dust-formation episode, suggesting a period near 28.3 y. for the latter. This would be the longest period episodic dust maker known. The fragments of light curves of new dust makers found in the NEOWISE-R and other IR data suggest periods in excess of a decade for some and in excess of 20 y. for the newly found episodic dust maker HD 38030 in the LMC, calling for continued IR photometry of these systems for many years to come.
Acknowledgements
This publication makes use of data products from the Near-Earth Object Wide-field Infrared Survey Explorer (NEOWISE-R), which is a project of the Jet Propulsion Laboratory/California Institute of Technology. NEOWISE-R is funded by the National Aeronautics and Space Administration. Data were retrieved from the NASA/ IPAC Infrared Science Archive, which is operated by the Jet Propulsion Laboratory, California Institute of Technology, the WFCAM Science Archive, VISTA Science Archive and OmegaCAM Science Archive, which are operated by the Wide Field Astronomy Unit of the Institute for Astronomy, University of Edinburgh, and the VizieR catalogue access tool, operated by the CDS, Strasbourg. It is a pleasure to thank Victor Shenavrin for a timely observation of WR 125 and to acknowledge continued hospitality from the Institute for Astronomy.
References
- Allen et al. (1972) Allen D. A., Swings J. P., Harvey P. M., 1972, A&A, 20, 333
- Barentsen et al. (2014) Barentsen G., et al., 2014, MNRAS, 444, 3230
- Bartzakos et al. (2001) Bartzakos P., Moffat A. F. J., Niemela V. S., 2001, MNRAS, 324, 18
- Benjamin et al. (2003) Benjamin R. A., et al., 2003, PASP, 115, 953
- Bonanos et al. (2009) Bonanos A. Z., et al., 2009, AJ, 138, 1003
- Breysacher et al. (1999) Breysacher J., Azzopardi M., Testor G., 1999, A&AS, 137, 117
- Churchwell et al. (2009) Churchwell E., et al., 2009, PASP, 121, 213
- Cioni et al. (2011) Cioni M. R. L., et al., 2011, A&A, 527, A116
- Cohen & Kuhi (1976) Cohen M., Kuhi L. V., 1976, PASP, 88, 524
- Cohen et al. (1975) Cohen M., Barlow M. J., Kuhi L. V., 1975, A&A, 40, 291
- Colangeli et al. (1995) Colangeli L., Mennella V., Palumbo P., Rotundi A., Bussoletti E., 1995, A&AS, 113, 561
- Cross et al. (2012) Cross N. J. G., et al., 2012, A&A, 548, A119
- Crowther et al. (1998) Crowther P. A., De Marco O., Barlow M. J., 1998, MNRAS, 296, 367
- Cutri et al. (2012) Cutri R. M., et al., 2012, VizieR Online Data Catalog, p. II/281
- Damineli et al. (2016) Damineli A., Almeida L. A., Blum R. D., Damineli D. S. C., Navarete F., Rubinho M. S., Teodoro M., 2016, MNRAS, 463, 2653
- Dougherty et al. (2005) Dougherty S. M., Beasley A. J., Claussen M. J., Zauderer B. A., Bolingbroke N. J., 2005, ApJ, 623, 447
- Drew et al. (2005) Drew J. E., et al., 2005, MNRAS, 362, 753
- Drew et al. (2014) Drew J. E., et al., 2014, MNRAS, 440, 2036
- Epchtein et al. (1999) Epchtein N., et al., 1999, A&A, 349, 236
- Fahed et al. (2011) Fahed R., et al., 2011, MNRAS, 418, 2
- Gaia Collaboration et al. (2018) Gaia Collaboration et al., 2018, A&A, 616, A1
- Gehrz & Hackwell (1974) Gehrz R. D., Hackwell J. A., 1974, ApJ, 194, 619
- Guerrero & Chu (2008) Guerrero M. A., Chu Y.-H., 2008, ApJS, 177, 216
- Hackwell et al. (1976) Hackwell J. A., Gehrz R. D., Smith J. R., Strecker D. W., 1976, ApJ, 210, 137
- Hackwell et al. (1979) Hackwell J. A., Gehrz R. D., Grasdalen G. L., 1979, ApJ, 234, 133
- Hadfield et al. (2007) Hadfield L. J., van Dyk S. D., Morris P. W., Smith J. D., Marston A. P., Peterson D. E., 2007, MNRAS, 376, 248
- Homeier et al. (2003) Homeier N. L., Blum R. D., Conti P. S., Damineli A., 2003, A&A, 397, 585
- Hopewell et al. (2005) Hopewell E. C., et al., 2005, MNRAS, 363, 857
- Howarth & Schmutz (1992) Howarth I. D., Schmutz W., 1992, A&A, 261, 503
- Jarrett et al. (2011) Jarrett T. H., et al., 2011, ApJ, 735, 112
- Kanarek et al. (2015) Kanarek G., Shara M., Faherty J., Zurek D., Moffat A., 2015, MNRAS, 452, 2858
- Kato et al. (2007) Kato D., et al., 2007, PASJ, 59, 615
- Lafler & Kinman (1965) Lafler J., Kinman T. D., 1965, ApJS, 11, 216
- Lamontagne et al. (1996) Lamontagne R., Moffat A. F. J., Drissen L., Robert C., Matthews J. M., 1996, AJ, 112, 2227
- Lau et al. (2017) Lau R. M., Hankins M. J., Schödel R., Sanchez-Bermudez J., Moffat A. F. J., Ressler M. E., 2017, ApJ, 835, L31
- Lawrence et al. (2007) Lawrence A., et al., 2007, MNRAS, 379, 1599
- Lefèvre et al. (2005) Lefèvre L., et al., 2005, MNRAS, 360, 141
- Leitherer et al. (1997) Leitherer C., Chapman J. M., Koribalski B., 1997, ApJ, 481, 898
- Lucas et al. (2008) Lucas P. W., et al., 2008, MNRAS, 391, 136
- Mainzer et al. (2011) Mainzer A., et al., 2011, ApJ, 731, 53
- Mainzer et al. (2014) Mainzer A., et al., 2014, ApJ, 792, 30
- Marchenko & Moffat (2007) Marchenko S. V., Moffat A. F. J., 2007, in St.-Louis N., Moffat A. F. J., eds, Astronomical Society of the Pacific Conference Series Vol. 367, Massive Stars in Interactive Binaries. p. 213 (arXiv:astro-ph/0610531)
- Marchenko et al. (2002) Marchenko S. V., Moffat A. F. J., Vacca W. D., Côté S., Doyon R., 2002, ApJ, 565, L59
- Mathis et al. (1992) Mathis J. S., Cassinelli J. P., van der Hucht K. A., Prusti T., Wesselius P. R., Williams P. M., 1992, ApJ, 384, 197
- Mauerhan et al. (2009) Mauerhan J. C., Van Dyk S. D., Morris P. W., 2009, PASP, 121, 591
- Mauerhan et al. (2011) Mauerhan J. C., Van Dyk S. D., Morris P. W., 2011, AJ, 142, 40
- Midooka et al. (2019) Midooka T., Sugawara Y., Ebisawa K., 2019, MNRAS, 484, 2229
- Minniti et al. (2010) Minniti D., et al., 2010, New Astron., 15, 433
- Miszalski & Mikołajewska (2014) Miszalski B., Mikołajewska J., 2014, MNRAS, 440, 1410
- Moffat et al. (1990) Moffat A. F. J., Niemela V. S., Marraco H. G., 1990, ApJ, 348, 232
- Monnier et al. (1999) Monnier J. D., Tuthill P. G., Danchi W. C., 1999, ApJ, 525, L97
- Monnier et al. (2011) Monnier J. D., et al., 2011, ApJ, 742, L1
- Morris et al. (1993) Morris P. W., Brownsberger K. R., Conti P. S., Massey P., Vacca W. D., 1993, ApJ, 412, 324
- Niemela (1995) Niemela V. S., 1995, in van der Hucht K. A., Williams P. M., eds, IAU Symposium Vol. 163, Wolf-Rayet Stars: Binaries; Colliding Winds; Evolution. p. 223
- Rosslowe & Crowther (2015) Rosslowe C. K., Crowther P. A., 2015, MNRAS, 447, 2322
- Sander et al. (2019) Sander A. A. C., Hamann W.-R., Todt H., Hainich R., Shenar T., Ramachandran V., Oskinova L. M., 2019, A&A, 621, A92
- Shara et al. (1999) Shara M. M., Moffat A. F. J., Smith L. F., Niemela V. S., Potter M., Lamontagne R., 1999, AJ, 118, 390
- Shara et al. (2009) Shara M. M., et al., 2009, AJ, 138, 402
- Shara et al. (2012) Shara M. M., Faherty J. K., Zurek D., Moffat A. F. J., Gerke J., Doyon R., Artigau E., Drissen L., 2012, AJ, 143, 149
- Skrutskie et al. (2006) Skrutskie M. F., et al., 2006, AJ, 131, 1163
- Smith (1968a) Smith L. F., 1968a, MNRAS, 138, 109
- Smith (1968b) Smith L. F., 1968b, MNRAS, 140, 409
- Sugawara et al. (2015) Sugawara Y., et al., 2015, PASJ, 67, 121
- Sugawara et al. (2017) Sugawara Y., Maeda Y., Tsuboi Y., 2017, in Ness J.-U., Migliari S., eds, The X-ray Universe 2017. p. 215
- Taranova & Shenavrin (2011) Taranova O. G., Shenavrin V. I., 2011, Astronomy Letters, 37, 30
- Tuthill et al. (1999) Tuthill P. G., Monnier J. D., Danchi W. C., 1999, Nature, 398, 487
- Tuthill et al. (2008) Tuthill P. G., Monnier J. D., Lawrance N., Danchi W. C., Owocki S. P., Gayley K. G., 2008, ApJ, 675, 698
- Usov (1991) Usov V. V., 1991, MNRAS, 252, 49
- Varricatt & Ashok (2006) Varricatt W. P., Ashok N. M., 2006, MNRAS, 365, 127
- Veen et al. (1998) Veen P. M., van der Hucht K. A., Williams P. M., Catchpole R. M., Duijsens M. F. J., Glass I. S., Setia Gunawan D. Y. A., 1998, A&A, 339, L45
- Williams (1999) Williams P. M., 1999, in Wolf B., Stahl O., Fullerton A. W., eds, Lecture Notes in Physics, Berlin Springer Verlag Vol. 523, IAU Colloq. 169: Variable and Non-spherical Stellar Winds in Luminous Hot Stars. p. 275, doi:10.1007/BFb0106391
- Williams (2019) Williams P. M., 2019, Research Notes of the AAS, 3, 71
- Williams & Eenens (1989) Williams P. M., Eenens P. R. J., 1989, MNRAS, 240, 445
- Williams & van der Hucht (1992) Williams M., van der Hucht K. A., 1992, in Drissen L., Leitherer C., Nota A., eds, Astronomical Society of the Pacific Conference Series Vol. 22, Nonisotropic and Variable Outflows from Stars. p. 269
- Williams & van der Hucht (2015) Williams P. M., van der Hucht K. A., 2015, in Hamann W.-R., Sander A., Todt H., eds, Wolf-Rayet Stars: Proceedings of an International Workshop held in Potsdam, Germany, 1-5 June 2015. Universitätsverlag Potsdam, 2015. pp 275–278 (arXiv:1508.00724)
- Williams et al. (1978) Williams P. M., Beattie D. H., Lee T. J., Stewart J. M., Antonopoulou E., 1978, MNRAS, 185, 467
- Williams et al. (1985) Williams P. M., Longmore A. J., van der Hucht K. A., Talevera A., Wamsteker W. M., Abbott D. C., Telesco C. M., 1985, MNRAS, 215, 23P
- Williams et al. (1987) Williams P. M., van der Hucht K. A., Thé P. S., 1987, A&A, 182, 91
- Williams et al. (1990a) Williams P. M., van der Hucht K. A., Pollock A. M. T., Florkowski D. R., van der Woerd H., Wamsteker W. M., 1990a, MNRAS, 243, 662
- Williams et al. (1990b) Williams P. M., van der Hucht K. A., Thé P. S., Bouchet P., 1990b, MNRAS, 247, 18P
- Williams et al. (1992) Williams P. M., van der Hucht K. A., Bouchet P., Spoelstra T. A. T., Eenens P. R. J., Geballe T. R., Kidger M. R., Churchwell E., 1992, MNRAS, 258, 461
- Williams et al. (1994) Williams P. M., van der Hucht K. A., Kidger M. R., Geballe T. R., Bouchet P., 1994, MNRAS, 266, 247
- Williams et al. (2001) Williams P. M., et al., 2001, MNRAS, 324, 156
- Williams et al. (2003) Williams P. M., van der Hucht K. A., Morris P. W., Marang F., 2003, in van der Hucht K., Herrero A., Esteban C., eds, IAU Symposium Vol. 212, A Massive Star Odyssey: From Main Sequence to Supernova. p. 115
- Williams et al. (2009a) Williams P. M., et al., 2009a, MNRAS, 395, 1749
- Williams et al. (2009b) Williams P. M., Rauw G., van der Hucht K. A., 2009b, MNRAS, 395, 2221
- Williams et al. (2012) Williams P. M., van der Hucht K. A., van Wyk F., Marang F., Whitelock P. A., Bouchet P., Setia Gunawan D. Y. A., 2012, MNRAS, 420, 2526
- Williams et al. (2013a) Williams P. M., van der Hucht K. A., van Wyk F., Marang F., Whitelock P. A., Bouchet P., Gunawan D. Y. A. S., 2013a, MNRAS, 429, 494
- Williams et al. (2013b) Williams P. M., Chu Y.-H., Gruendl R. A., Guerrero M. A., 2013b, MNRAS, 431, 1160
- Wright et al. (2010) Wright E. L., et al., 2010, AJ, 140, 1868
- Zhekov et al. (2014) Zhekov S. A., Tomov T., Gawronski M. P., Georgiev L. N., Borissova J., Kurtev R., Gagné M., Hajduk M., 2014, MNRAS, 445, 1663
- Zubko et al. (1996) Zubko V. G., Mennella V., Colangeli L., Bussoletti E., 1996, MNRAS, 282, 1321