The “Red Radio Ring”: Ionised and Molecular Gas in a Starburst/Active Galactic Nucleus at
Abstract
We report the detection of the far-infrared (FIR) fine-structure line of singly ionised nitrogen, [Nii] 205 m , within the peak epoch of galaxy assembly, from a strongly lensed galaxy, hereafter “The Red Radio Ring”; the RRR, at z = 2.55. We combine new observations of the ground-state and mid-J transitions of CO (J 1,5,8), and the FIR spectral energy distribution (SED), to explore the multi-phase interstellar medium (ISM) properties of the RRR. All line profiles suggest that the HII regions, traced by [Nii] 205 m , and the (diffuse and dense) molecular gas, traced by the CO, are co-spatial when averaged over kpc-sized regions. Using its mid-IR-to-millimetre (mm) SED, we derive a non-negligible dust attenuation of the [Nii] 205 m line emission. Assuming a uniform dust screen approximation results a mean molecular gas column density cm-2, with a molecular gas-to-dust mass ratio of 100. It is clear that dust attenuation corrections should be accounted for when studying FIR fine-structure lines in such systems. The attenuation corrected ratio of is consistent with the dispersion of local and 4 SFGs. We find that the lower-limit, [Nii] 205 m -based star-formation rate (SFR) is less than the IR-derived SFR by a factor of four. Finally, the dust SED, CO line SED and line-to-IR luminosity ratio of the RRR is consistent with a starburst-powered ISM.
keywords:
galaxies: high-redshift – galaxies: ISM – galaxies: evolution – galaxies: starburst – gravitational lensing: strong1 Introduction
Observational evidence reveals a synchronous peak, around , in both the cosmic co-moving star-formation rate (SFR) and super massive black hole accretion rate density (see e.g. Madau and Dickinson,, 2014; Hickox & Alexander, 2018). Understanding this apparent co-evolution between active galactic nuclei (AGN) and star formation (SF) demands a deeper characterisation of the interstellar medium (ISM) in galaxies, such as the dynamics and spatial distribution of gas arising from different phases, as well as the relationship of ionised, molecular and stellar surface mass densities and their role in SF processes. Substantial theoretical work (Dalla Vecchia & Schaye, 2008; Scannapieco et al., 2012; Rosdahl et al., 2017) has also progressed in simulating the complex effects of black-hole, thermal, and kinetic feedback processes, while observations of ISM properties derived from a broad-band coverage are still required to form a complete impression of a galaxy that has both AGN and SF activity (Cicone et al., 2014, 2015, 2018). High- star-forming galaxies (SFGs) at typically show an increase in the molecular gas-to-stellar mass fractions (up to 50% or greater) (e.g. Tacconi et al., 2010, 2018). The spatial extent of SF within high- SFGs can often exist out to large radii ( 2-10 kpc e.g. Hailey-Dunsheath et al., 2010; Brisbin et al., 2015; Magdis et al., 2016; Elbaz et al., 2018), exceeding the 0.1-1 kpc nuclear starburst (SB) regions of local (Ultra)Luminous InfraRed Galaxies (LIRGs have L⊙ and ULIRGs have L⊙ Sanders & Mirabel, 1996; Solomon et al., 1997; Solomon & Vanden Bout, 2005a). Therefore global properties derived from measurements of the ionised and molecular ISM are needed to account for the total emission corresponding to the kpc-scale areas encompassed by high- systems.
Studying the gas-rich, dusty star-forming galaxies (DSFGs) at has largely focused on measurements of the molecular gas content via one or two CO lines (typically J), and also the long-wavelength dust continuum, to understand the star-forming ISM, the total molecular gas mass and overall efficiency of SF (e.g. Genzel et al., 2010; Scoville et al., 2014; Schinnerer et al., 2016; Scoville et al., 2016, 2017; Harrington et al., 2018; Leung et al., 2019). The ionised ISM, however, has been largely unexplored at high-, and therefore the complete picture of multi-phase gas processes required to disentangle the nature of SF in galaxies are poorly constrained. Far-IR fine-structure lines (FSLs) offer an additional probe of Hii regions in obscured sites of SF, as they are less susceptible to dust attenuation when compared to optical or mid-IR lines (see Fernández-Ontiveros et al., 2016; Díaz-Santos et al., 2017). This motivates the use of these far-IR FSLs as powerful line diagnostics of the evolving ISM at high- (Maiolino et al., 2005; Maiolino et al., 2009; Ferkinhoff et al., 2010, 2011; Riechers et al., 2014; Zavala et al., 2018; Zhang et al., 2018; Lamarche et al., 2018; Marrone et al., 2018; Vishwas et al., 2018; Zanella et al., 2018). Unfortunately, the atmospheric coverage of many important mid-/far-IR FSLs makes observations difficult to execute, if not impossible to observe from the ground.
The nitrogen atom has an ionisation energy Ei,N= 14.53 eV, and is therefore typically present with singly ionised hydrogen; Ei,H= 13.6 eV. The fine-structure splitting of the ground-state leads to two transitions at 121.898 m and 205.178m; [Nii] 122 m and [Nii] 205 m , respectively111The ground state () fine-structure splitting arises due to the unpaired electrons in the nitrogen atom. The and levels are only about 188 K and 70 K above ground, respectively. . In order to characterise the global ionised ISM properties, the low ionisation energy requirement of the far-IR [Nii] emission lines makes them unique tracers of the low-excitation, warm ionised gas associated with Hii regions and the ambient interstellar radiation field of the ISM. The physical and chemical evolution of the global ISM is influenced by supernova explosions and high mass-loss rates dispelled by stellar winds from massive OB and Wolf-Rayet type stars (e.g. McKee & Williams, 1997; Crowther, 2007; Puls et al., 2008). These, together with efficient rotational mixing within massive stars (Maeder & Meynet, 2000; Brott et al., 2011; Ekström et al., 2012), can quickly expose the products of stellar nucleosynthesis at the surface, thereby injecting substantial quantities of nitrogen into the ISM within a timescale of 10s Myr (Maeder & Meynet, 2000; Stanway & Eldridge, 2018).
The [Nii] emission lines were first observed in the Milky Way by the COBE FIRAS spectrometre (Bennett et al., 1994), followed closely by KAO observations of the Galactic Hii region G333.6-0.2 (Colgan et al., 1993). The [Nii] 205 m line is also observable at rest velocities from the ground-based observatories at exceptional sites. Using the SPIFI spectrometer on the AST/RO telescope at South Pole, Oberst et al. (2006, 2011) mapped the [Nii] 205 m line from the Carina Nebula and compared it with ISO LWS [Nii] 122 m line maps to show the [NII] line originated from a low density ( cm-3 ) ionized medium. High spatial-resolution, large-scale imaging of the Galactic plane were enabled by the sensitive PACS and SPIRE spectrometer on-board the Herschel Space Observatory (Goldsmith et al., 2015), and demonstrated that most of the [Nii] line arises from extended, low density ( 10 to 50 cm-3) Hii regions. Other efforts to use [Nii] to derive average electron densities have been made in a range of local galaxies ( 20-100 cm-3), for instance: M51 and Centaurs A, (Parkin et al., 2013), Ultra-luminous Infrared Galaxies ULIRGs (HERUS sample; Farrah et al., 2013), Dwarf galaxies (Cormier et al., 2015), KINGFISH galaxies (Herrera-Camus et al., 2016) and other SFGs (Lu et al., 2017).
At high-, observations of the [Nii] 205 m line is largely limited to , where the line is red-shifted to wavelengths longer than 1mm, making ground based observations possible due to the more transmissive and stable atmosphere, with lower receiver noise temperatures. The current sample where this emission line is detected consists of twelve highly star-forming galaxies (Decarli et al., 2012, 2014; Combes et al., 2012; Rawle et al., 2014; Nagao et al., 2012; Béthermin et al., 2016; Pavesi et al., 2016, 2018b; Pavesi et al., 2018a; Lu et al., 2018), and there are at least five additional non-detections (see Walter et al., 2009; Riechers et al., 2013a).
In this paper we report new spatially unresolved line detections from “The Red Radio Ring” (hereafter: the RRR) of [Nii] 205 m line emission with the APEX telescope, complemented by CO(1-0), CO(5-4), and CO(8-7) line detections from the Green Bank Telescope (GBT) and IRAM 30m telescope. The [Nii] 205 m line detection at the redshift, , in the RRR begins to bridge the gap between local detections and those at .
We structure the paper as follows, in §2 we provide a brief outline of the nature of the galaxy presented in this study. We describe the [Nii] and CO observations in §3, and then present the results in §4. In §5 we discuss the [Nii] derived SFR and the possibility for a co-eval AGN/SB, followed by our conclusions and outlook in §6. Throughout this paper we take for a point of reference a flat CDM cosmology with with , and (Bennett et al., 2014). Throughout the text, we use a magnification factor, 15, to report the intrinsic source properties unless otherwise noted. This value is derived from lens models using the highest spatial resolution data available for this source, i.e. , (Geach et al., 2018), and is consistent with other work (Rivera et al., 2018, ; Kamieneski et al. 2019, in prep.). The relative magnification factor, however, can change depending on the source plane distribution of every line and continuum tracer at varying rest frequencies.
2 The Red Radio Ring
the RRR was discovered by four independent teams: (i) the citizen science program SpaceWarps (Marshall et al., 2016) in a search for gravitational lensing features within deep (iJKs band) CFHT images in the Herschel-Stripe82 field (Geach et al., 2015); (ii) Harrington et al. (2016) identified this source after cross-matching Herschel-SPIRE and Planck images at 350µm in order to identify strongly lensed, DSFGs (Negrello et al., 2010; Fu et al., 2012; Planck Collaboration XXVII, 2015; Wardlow et al., 2013; Cañameras et al., 2015) and further confirmed with follow-up CO and millimetre dust continuum observations with the Large Millimeter Telescope; (iii) Nayyeri et al. (2016) present a similar selection of candidate lensed, DSFGs as Harrington et al. (2016), but with SPIRE 500µm images instead; and (iv) Su et al. (2017) identified the RRR as the brightest DSFG candidate (referred to as ACTJ0210+0016) in the 148, 218, and 278 GHz maps from the Atacama Cosmology Telescope (ACT), and presented follow-up CO(1-0) line observations with Green Bank Telescope/Zpectrometer.
the RRR is a strongly lensed radio-AGN/DSFG hybrid galaxy, magnified by a massive, foreground elliptical galaxy and a satellite companion at (Geach et al., 2015). The 1.4 GHz eMERLIN imaging () revealed compact radio emission 250pc in the lens reconstructed source-plane image. The intrinsic specific radio luminosity suggests a radio-mode AGN (Geach et al., 2015). The wavelength corresponding to the peak line flux of the asymmetric low-J CO line profile corresponds to a redshift, z2.553 for the RRR (Harrington et al., 2016; Su et al., 2017). Detailed strong lens modeling of the CO(3-2) emission resolved by NOEMA ( 0.751.5”) suggests that the observed molecular gas emission arises from a rotating disk spread over 3 kpc in the source-plane (Rivera et al., 2018). The source-plane reconstruction of the CO(4-3) line emission ( 0.25”) by Geach et al. (2018) provides evidence that the growth of the AGN is co-eval with the rapid SF. The molecular gas may dominate the galactic potential within these three kpc, which is further supported by Rivera et al. (2018).
3 Observations
3.1 GBT
The CO(1-0) line emission was observed using the Ka-band receiver on the GBT. Observations (GBT/17B-305; PI: K. Harrington) took place on October 22, 2017, under stable atmospheric conditions. We used the standard SubBeamNod procedure between the 8-m subreflector and the main dish, with 4 min integrations per scan. Pointing and focus were performed frequently before the SubBeamNod integrations. The backend spectrometer, VEGAS, was used to record the data from the Ka-band receiver, tuned to the expected CO(1-0) line frequency (in low-resolution, 1.5 GHz bandwidth mode; ). Subsequent data reduction was performed using GBTIDL (Marganian et al., 2013). All On-Off measurements were corrected for the atmospheric attenuation and afterwards treated in the same manner as in Harrington et al. (2018). We smoothed all spectra to 50 km s-1channel resolution after averaging all low-order baseline subtracted spectra. The resulting on-source integration time was 1.25h. Flux accuracy was checked with the standard source Uranus and pointing stability with J0841+7053, J1310+3220, J1331+3030 and J1642+3948. We adopt a 25% uncertainty on the integrated line properties for systematic effects with the GBT (see Harrington et al., 2018; Frayer et al., 2018).
3.2 APEX
To observe the [Nii] 205 m emission line we used the FLASH+460L single polarization receiver on the Atacama Pathfinder EXperiment (APEX) 12m telescope (Güsten et al., 2006). We used Max Planck Society observing time between 24 May and 17 July, 2018 (Pr. M-0101.F-9503A-2018; PI: Harrington), totaling 384 minutes of integration (). FLASH (Heyminck et al., 2006) is a 2 side-band (SB) dual-frequency heterodyne receiver with orthogonal linear polarizations, one for each of the 345 GHz and 460 GHz atmospheric windows. The FLASH observations were performed in good weather conditions, with precipitable water vapor < 1.5mm. Observations used standard wobbler switching with a chopping rate of 1.5 Hz, and an azimuthal throw offset of 30”. Each scan consisted of a hot/sky/cold calibration 600” off-source, followed by 12 subscans of 20s per on-source integration time. Focus checks were performed regularly (every 3-5h), whereas pointing checks on a strong line/continuum source (e.g. Jupiter or nearby star) were performed roughly every 1-2h and yield a pointing accuracy within 2-3". To record the data we used the MPIfR eXtended bandwidth Fast Fourier Transform spectrometers (FFTS; Klein et al., 2006) with a 2 2.5 GHz bandwidth for each of the upper and lower receiver sidebands of spectra the FLASH receiver. All scans were reduced and analysed using the CLASS and GREG packages within the GILDAS222Software information can be found at: http://www.iram.fr/IRAMFR/GILDAS software distribution. Each scan was smoothed to km s-1 channel resolution and assessed by eye after a 1st order baseline polynomial subtraction (line-free channels). Only about 10% of the scans were removed for each set of spectra before co-adding the rms-weighted spectrum. We adopt an absolute uncertainty of 25% for all derived line properties to account for the variations in systematic behavior of the APEX observations at higher frequencies (e.g. atmospheric stability, baseline subtraction, pointing/focus corrections).
3.3 IRAM 30m
Observations with the IRAM 30m telescope took place across two observing semesters: Pr. 187-16 and Pr. 170-17 (PI: K. Harrington), starting on January 29th, 2017 we observed the CO(5-4) emission line in average weather conditions () for 30 minutes of integration. Subsequent observations were in excellent observing conditions () on December 13, 2017 for roughly 35 minutes integration to detect the CO(8-7) emission line. We used the E150 and E230 observing bands of the EMIR receiver, and utilised two backends: both the WIde-band Line Multiple Auto-correlator (WILMA) and the fast Fourier Transform Spectrometre (FTS200). Our observing mode consisted of a single EMIR band, capturing the dual polarization, 16 GHz bandwidth of the lower inner and lower outer (LI+LO), and upper inner and upper outer (UI+UO) sidebands with respect to the LO tuning frequency. To overcome the variable atmospheric conditions, we used the wobbler switching observing mode to perform offset throws of 40″every second. Each wobbler switching mode procedure includes three, 5 minute integrations (i.e. twelve 25-s subscans). Frequent focus and pointing checks were assessed (e.g. Uranus, Venus, J1226+023, J1418+546) every 1.5 to 2hr, with azimuth and elevation pointing offsets typically within 3″. The IRAM 30m beam sizes at the observed CO(5-4) and CO(8-7) line frequency are and , respectively. The absolute uncertainty we adopt for the derived line properties from the IRAM 30m observations is 20% based on the dispersion of flux densities observed in pointing sources from ongoing monitoring at the telescope. All scans were reduced using GILDAS, smoothed to km s-1 channel resolution before being co-added.
4 Results
4.1 Intrinsic Line Properties
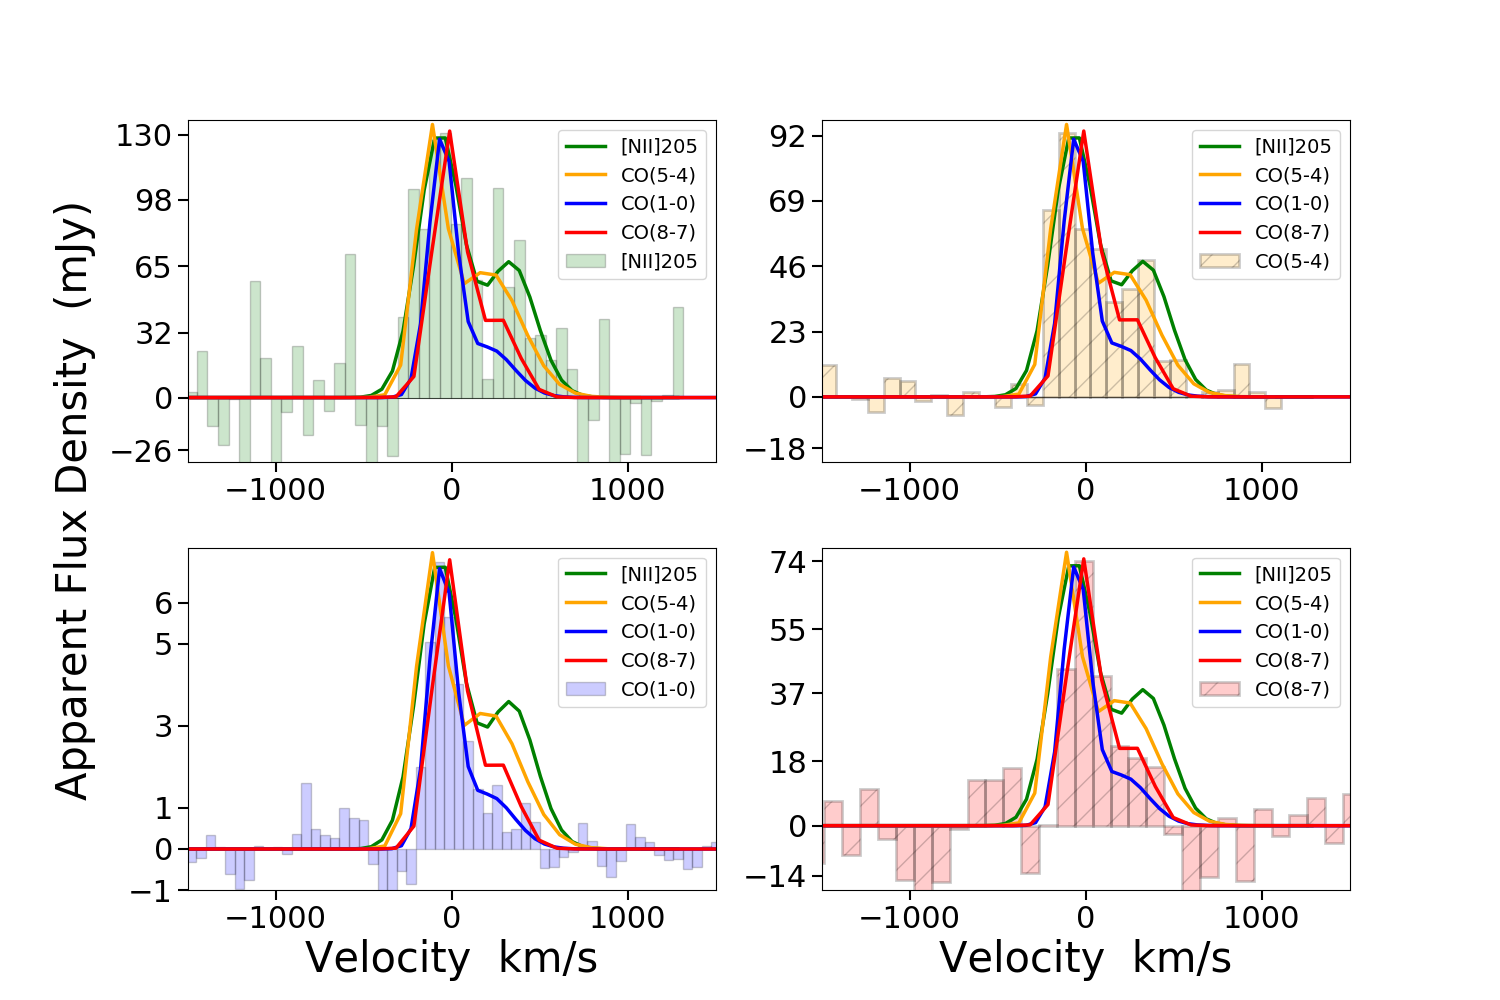
The observed [Nii] 205 m emission line peaks at GHz. We integrate the full line profile to derive a total velocity integrated flux density of 4.3 1.1 Jy km s-1(using an antenna gain factor of 52.3 Jy/K). The CO(1-0) ( GHz) has a measured integrated flux of 0.18 0.04 Jy km s-1(antenna gain factor of 0.7 Jy/K). This is consistent with, albeit slightly higher than, the Zpectrometer measurement (0.11 Jy km s-1) of Su et al. (2017). The velocity integrated flux intensities for the CO(5-4) ( GHz) and CO(8-7) ( GHz) emission lines are 1.96 0.3 and 1.37 0.27 Jy km s-1, using antenna gain factors of 6.69 and 8.38 Jy/K, respectively. We report in Tab. 1 the line luminosity (in L⊙) and spatially integrated source brightness temperature (in K km s-1 pc2) following Carilli & Walter (2013). We note that the peak line intensity frequencies are all consistent with .
Asymmetric line profiles are observed in all the high S/N (Speak/N) line detections (CO 1-0, 5-4, 8-7; [Nii] 205 m ), therefore we fit two 1-D Gaussians to the line shapes to compare their respective full-width-at-half-maximum (FWHM), centroids and amplitudes. The best-fit models are overlaid on the CO and [Nii] 205 m spectra in Fig. 1, while the best-fit parameters are listed in Tab. 1, together with the CO(3-2)333As noted in Rivera et al. (2018), the CO(3-2) line flux for the LMT detection presented in Harrington et al. (2016) is unfortunately incorrect due to the early commissioning period and calibration uncertainties. and CO(4-3) velocity integrated line flux densities from Rivera et al. (2018); Geach et al. (2018).
The line centroid and FWHM of the [Nii] 205 m emission line are consistent with the observed CO(1-0) (tracing the total molecular gas mass), and the more highly excited, J, CO lines. In all lines, the red component is offset by about 250-450 km s-1from the blue component. Differential lensing may yield differences in measured line ratios (Serjeant, 2012). However, without higher angular resolution observations for each transition, we assume the magnification factor does not change for each of the observed lines, such that the low-density diffuse Hii regions traced by [Nii] 205 m and the molecular gas traced by CO are considered to be co-spatial when averaged across kpc scales.
| [NII]205m | CO(1-0) | CO(3-2)b | CO(4-3)c | CO(5-4) | CO(8-7) | |
| Redshift, (peak) | 2.55308 (0.0004) | 2.55300 (0.0004) | 2.5529 (0.00011) | 2.5543 (0.0002) | 2.5525 (0.0002) | 2.55243 (0.0003) |
| Total Intrinsic Line Propertiesa: | ||||||
| [Jy km s-1] | 4.3 (1.1) | 0.18 (0.04) | 1.38 (0.28) | 1.62 (0.32) | 1.96 (0.3) | 1.37 (0.27) |
| K km s-1 pc2] | 0.84 (0.21) | 3.67 (0.92) | 4.8 (1.2) | 3.2 (0.8) | 2.5 (0.6) | 0.67 (0.19) |
| [108 L⊙] | 8.4 (2.0) | 0.02 (4.3e-03) | 0.64 (0.02) | 1.0 (0.25) | 1.5 (0.38) | 1.6 (0.42) |
| Component A (peak): | ||||||
| FWHM (km s-1) | 293 (76) | 179 (23) | - | - | 165 (22) | 154 (50) |
| Amplitude (mJy) | 8.7 (1.3) | 0.44 (0.07) | - | - | 5.5 (0.7) | 5.1 (2.0) |
| Center (km s-1) | -69 (34) | -55 (10) | - | - | -37 (6) | -20 (17) |
| Component B: | ||||||
| FWHM (km s-1) | 337 (170) | 352 (230) | - | - | 480 (116) | 337 (353) |
| Amplitude (mJy) | 4.5 (1.3) | 0.09 (0.023) | - | - | 2.10 (0.25) | 1.5 (0.6) |
| Center (km s-1) | 334 (72) | 200 (118) | - | - | 240 (60) | 200 (188) |
The velocities are measured with respect to , i.e. the peak velocity component. a Measured line properties corrected for magnification (). The systematic errors are listed in parenthesis for the velocity-integrated flux density and derived total line luminosities. The parenthessis associated with the FWHM, centroid, and amplitude for Gaussian components A and B are based on the residual errors to the model fit. b Su et al. (2017); Rivera et al. (2018) and cGeach et al. (2018), corrected for the cosmology used throughout this paper. Geach et al. (2018) report the redshift based on the mid-point full-width-at-zero-intensity of the observed CO(4-3) transition.
4.2 Far-IR Spectral Energy Distribution
| Wavelength (µm) | Flux Density (mJy) | Instrument | ||
|---|---|---|---|---|
| 22 | 4.20.9 | WISE/W4 | ||
| 250 | 88027 | Herschel/SPIRE | ||
| 350 | 99130 | Herschel/SPIRE | ||
| 500 | 77333 | Herschel/SPIRE | ||
| 850 | 1674 | JCMT/SCUBA (G15) | ||
| 1078.4 | 1548 | ACT (278GHz, S17) | ||
| 1100 | 95.56 | LMT/AzTEC (G15) | ||
| 1100 | 14515 | LMT/AzTEC (H16) | ||
| 1375.2 | 693 | ACT (218GHz, S17) | ||
| 2025.6 | 172 | ACT (148GHz, S17) | ||
| 3090.6 | 2.30.5 | CARMA (S17) |
Using data from the literature and various telescope archives, we compiled multi-band photometry tracing emission from the RRR in the (observed-frame) mid-infrared to mm-wavelengths (Geach
et al., 2015; Harrington
et al., 2016; Schulz
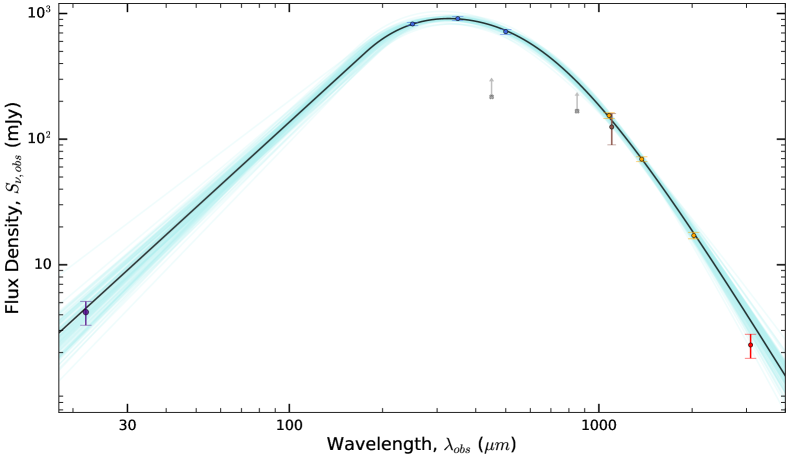
et al., 2017; Su et al., 2017). We fit the observed SED with a single temperature modified blackbody (MBB) model combined with a Wien-side power-law slope, denoted as , of which a value of 2 is characteristic for SFGs (e.g., Casey
et al., 2012). If an AGN torus is contributing a hot dust component, the MIR would show an excess compared to the power law slope for a normal SFG (e.g. the WISE ’Hot DOGS’ Tsai et al., 2015).
We retrieved the SPIRE photometer measurements from the SPIRE point source catalog (Schulz et al., 2017). We report the estimated uncertainties due to confusion rather than the systematic and statistical errors (which are 2%) as the SPIRE beam is large (18-35”) and the diameter of the radio Einstein ring is roughly 5” (Geach et al., 2015). We find that the flux density measured with LMT/AzTEC varies by 50% between the two observations by Geach et al. (2015) and Harrington et al. (2016, see footnote 3 above). For the MBB fit, we use the average value of these measurements, with an uncertainty that encompasses the range of values reported, i.e., 12535 mJy. We note that Geach et al. (2015) reported that the 450µm flux density measured with SCUBA was a factor of three smaller than that measured by SPIRE and hence this SCUBA measurement not included here. In comparison with the ACT 278 GHz measurement, we find that the 850 m SCUBA flux density, though a high significance detection, is most likely an underestimate, perhaps due to absolute flux calibration. We therefore ignore the SCUBA 850 m data point while performing the model fitting.
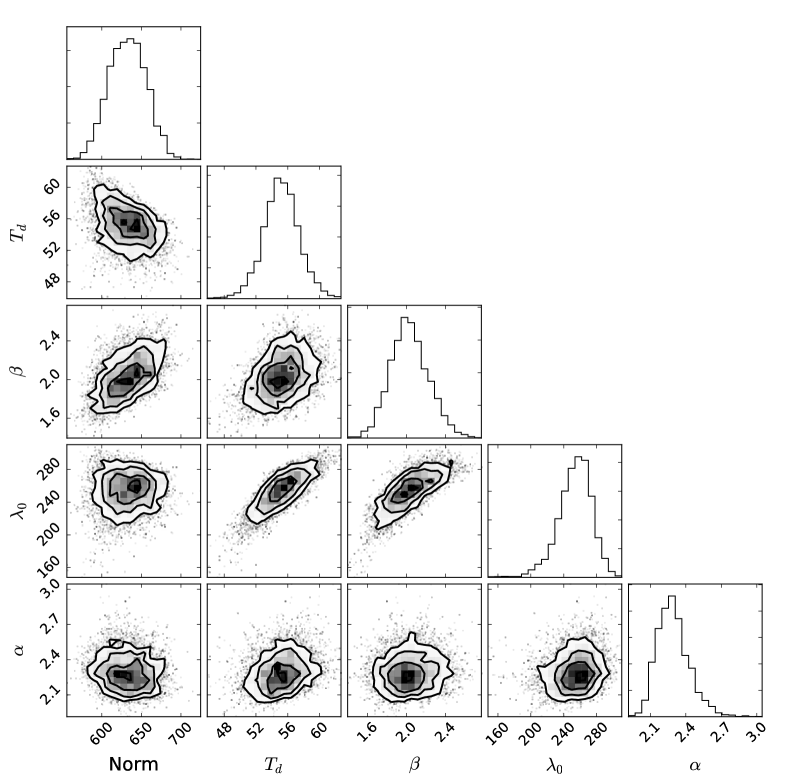
Fig. 2 shows the best-fit SED model of the RRR. In the following we quote the best-fit and the uncertainties based on the 16th, 50th and 84th percentiles of the samples in the marginalized distributions for each of the parameters (see Fig. 3). We find the dust opacity reaches unity at rest-frame wavelength of = 254 µm, with a dust emissivity index =2.0 and a dust temperature, K, Wien-side power-law slope . The total apparent infrared luminosity (IR; 8 - 1000µm), 21.91013 L⊙ , before correcting for the magnification factor, . The apparent far-infrared luminosity (FIR; 40-120µm), is 12.31013 L⊙ . The value of / is consistent with normal star-forming systems, i.e. / (Dale et al., 2001, ; see e.g. Leung et al. 2019b, submitted). Thus, the observed dust SED does not show strong signs of an AGN influence, e.g. no bright WISE/W4 counterpart. This suggests i.) that the compact radio-AGN, revealed by bright radio emission with a steep radio synchrotron slope of (Geach et al., 2015), does not significantly affect the overall IR luminosity of the RRR, or ii.) there is extreme dust obscuration of an AGN. Its intrinsic SFR can thus be estimated using (Geach et al., 2018) and the standard calibration of the total IR to SFR, with ( SFR M⊙ yr-1; Kennicutt, 1998). We find the SFR 2482 992 M⊙ yr-1, taking into account the total error propagation for the average best-fit relative uncertainty on the IR luminosity (3%), and the systematic errors for the photometric data points used in the modeling (37%; Tab. 2).
| SFRIR | SFR[NII]205 | (H+) | ||||
| [10] | [10] | M⊙ yr-1 |
|
1010 M⊙ | 1010 M⊙ | |
| 1.46 | 0.82 | 2482 (992) | 621b | 3.67 (0.9) | 0.89 |
The reported values can be converted back to the apparent values by multiplying the average lensing magnification factor of =15 (Geach et al., 2018). The intrinsic SFR and ) are derived from the [Nii] 205 m emission line, and are corrected by factor of 4.67 to account for the derived attenuation assuming a uniform dust screen approximation. The total and far-IR derived luminosities are derived from the dust SED modeling of the photometry from Harrington et al. (2016); Su et al. (2017); Rivera et al. (2018); Geach et al. (2015, 2018).
4.2.1 Effects of Dust Attenuation
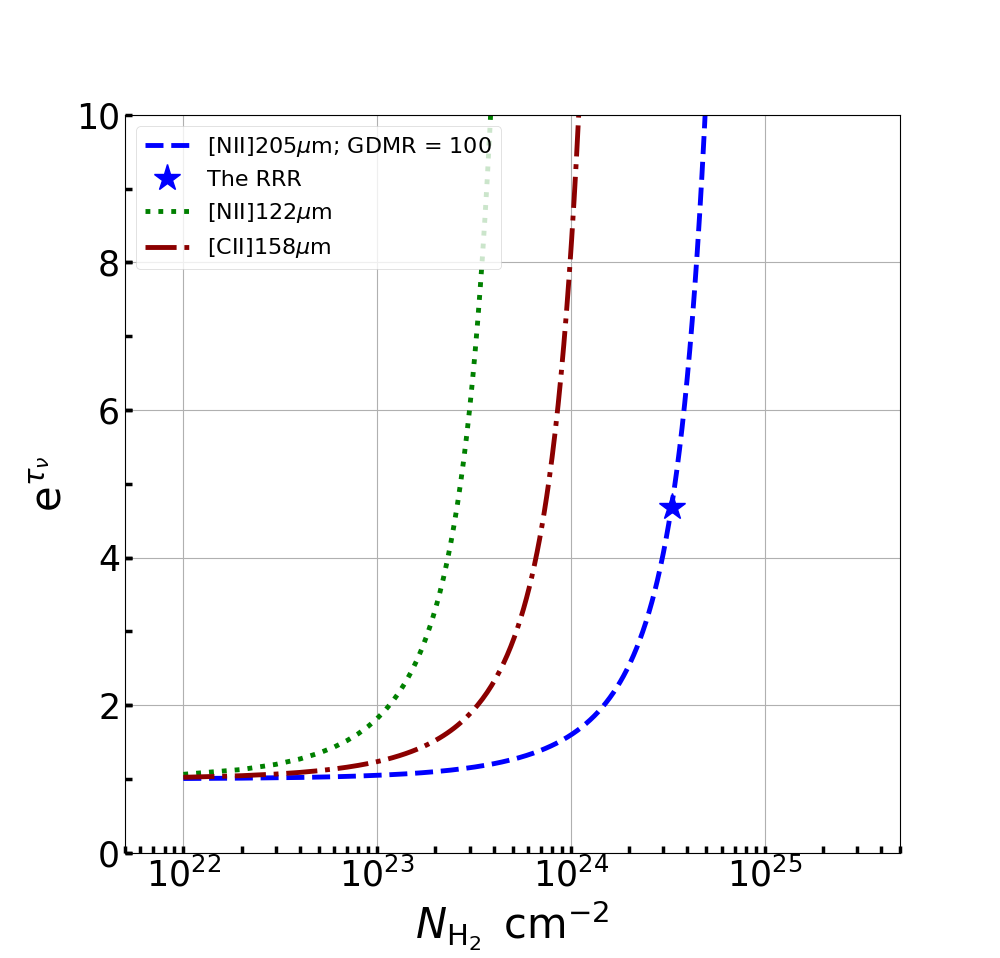
In the RRR the dust opacity reaches unity at the rest-frame wavelength of 254 µm. Such high opacity is consistent with that observed in other high- DSFGs (Riechers et al., 2013b), while slightly higher than e.g., AzTEC-3, which is a more normal star-forming galaxy at , (Riechers et al., 2014). The dust attenuation of the [Nii] 205 m emission line is therefore not negligible, as pointed out by other studies of far-IR FSLs in quasars (QSOs) and DSFGs (Uzgil et al., 2016; Lamarche et al., 2017, 2018). We correct the line luminosity based on a single, uniform dust screen approximation, i.e., . From our best-fit SED model, the opacity at rest-frame 205 m is , which results in a uniform screen dust attenuation correction factor of . The following corrections are considered an upper limit along the line of sight. In the scenario where the emitting gas is well mixed with dust, the mixed gas/dust attenuation correction factor would be = 1.96 .
Corrections to the observed far-IR FSL detections of the systems are limited by the sparse sampling of their peak dust SED to accurately constrain the dust opacity at the relevant wavelength. The RRR, with its well-sampled dust SED, allows us to constrain the mean hydrogen column density . In the following analysis, we assume both a fixed gas-to-dust-mass ratio, GDMR = 100, and a simple uniform dust screen. The dust opacity is expressed in terms of the dust column density, , and , the mass absorption coefficient (Weiß et al., 2008). We express as multiplied by the mass of molecular hydrogen, , divided by the GDMR:
| (1) |
where
| (2) |
Figure 4 plots the dust attenuation correction as a function of the mean molecular hydrogen column density N at rest-frame wavelengths corresponding to the [Nii] 205 m , [Nii] 122 m and [C ii]158 m emission lines. The equivalent H2 gas column density in the RRR is .
The RRR, having high molecular gas column densities, will have corrections that can severely impact the use of both [Nii] 205 m and [Nii] 122 m emission lines as an electron density indicator. For example, based on this simple uniform screen approximation, the observed line ratio of [Nii] 122 m / [Nii] 205 m in the RRR would need to be corrected by a factor of . An intrinsic [Nii] 122 m / [Nii] 205 m line ratio of , corresponding to an electron density of cm-3 (e.g. in the local starburst, M82; Petuchowski et al., 1994), would thus yield an observed [Nii] 122 m / [Nii] 205 m value of (4-5)/18 = 0.3. Neglecting dust opacity, one would associate such low observed line ratio to un-physically low densities, as it would lie below the minimum theoretical line ratio of , as derived for warm ionised regions with (Goldsmith et al., 2015; Herrera-Camus et al., 2016). Naturally, the RRR, but also all high- systems resembling the RRR, i.e., having high column densities, would suffer from this effect. Dust opacity should not be neglected while studying far-IR FSL emission in high- DSFGs.
4.2.2 Relative Cooling by [NII] 205m Line Luminosity
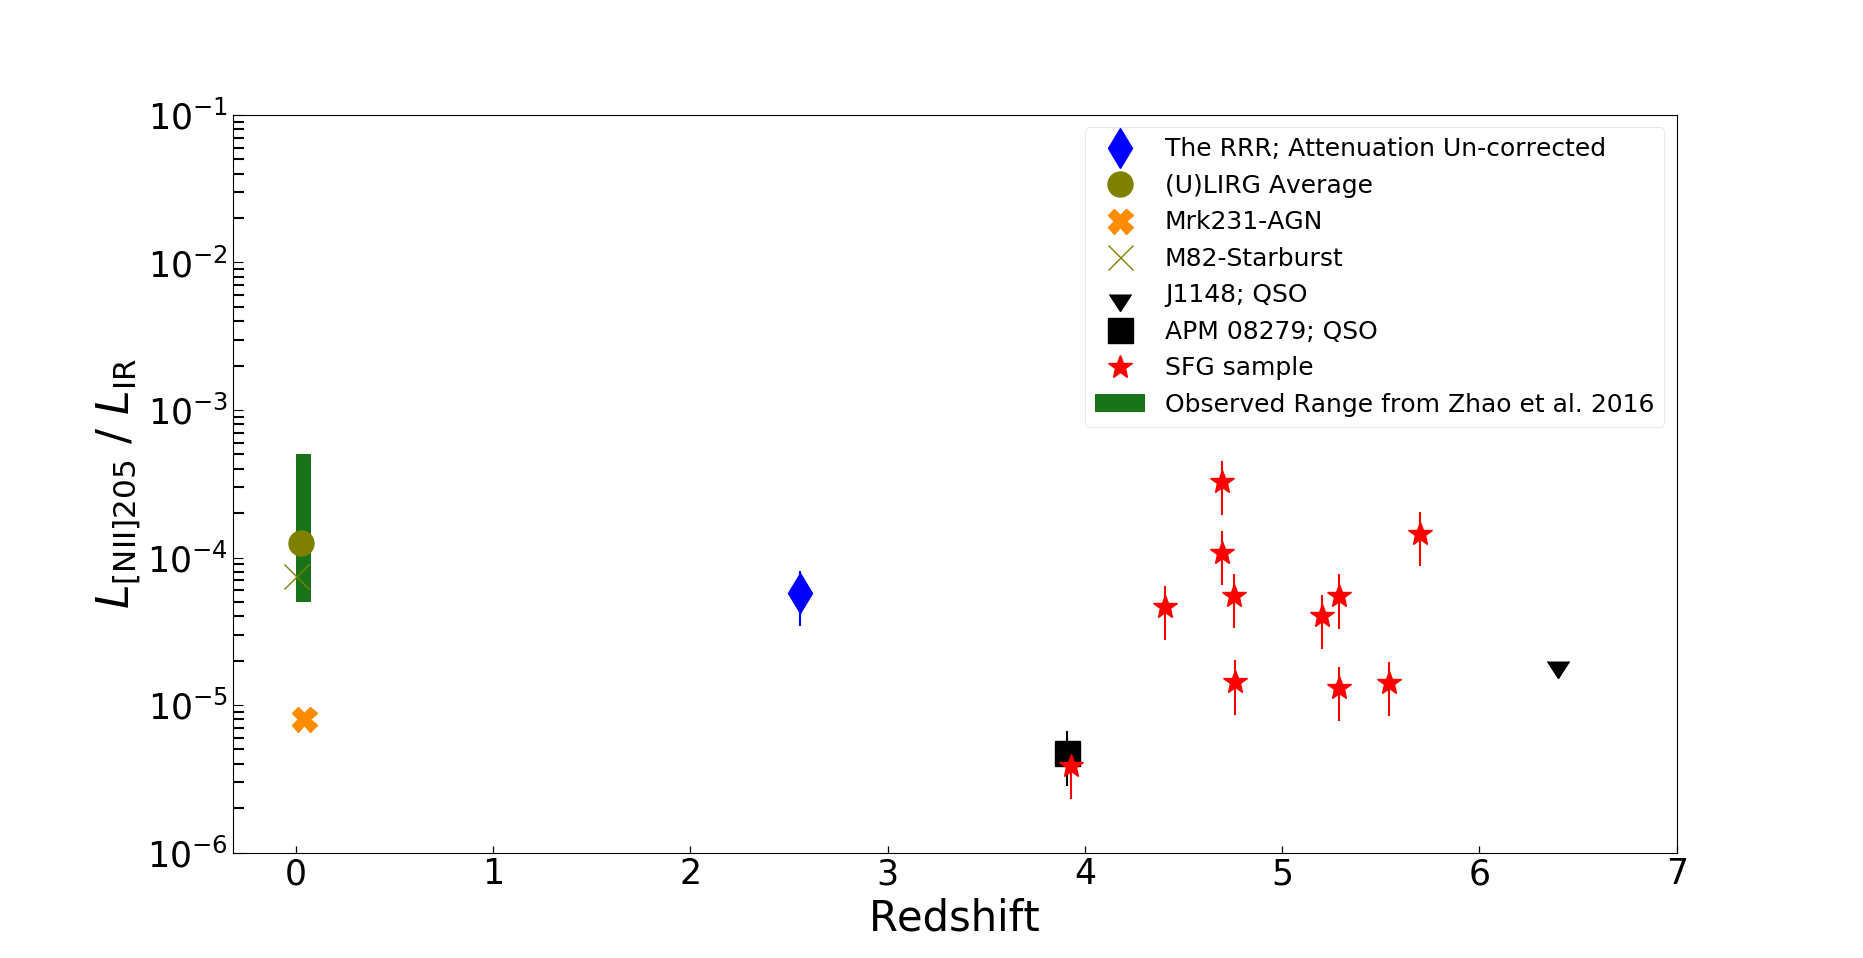
Using the [Nii] 205 m and IR luminosities, we calculate the attenuation corrected , assuming the same magnification factor for both luminosities. The vast majority of the local and high- galaxies do not correct for dust attenuation, therefore we use the apparent, attenuated value, .
As seen in Fig. 5, this attenuated ratio for the RRR is at the lower boundary of the mean range observed in local ULIRGs within the large scatter of (Zhao et al., 2016). The large dispersion in the ratio remains constant across all redshifts. Galaxies in Fig. 5 with the lowest values of include strong QSOs at (e.g. Decarli et al., 2012), as well as the local AGN, MrK231, which has at least a 20% AGN fraction contributing to its L⊙ (Fischer et al., 2010; Dietrich et al., 2018). SFGs at high- have slightly large scatter, probing a range of up to a factor of five between low metallicity galaxies (Pavesi et al., 2018b), DSFGs and a Lyman- Emitter (Decarli et al., 2014).
The ratio of the RRR more closely resembles that of local/high-z SB rather than that of local/high- QSO/AGNs. To first order, the global ISM within the RRR is mostly powered by SF. We note, however, that this ratio is subject to a few caveats. Robust comparisons of this ratio between the RRR and to other systems can be affected by individual variations in attenuation effects and hard ionising radiation fields that determine the relative [Nii] 205 m line emission. The bolometric input to the total IR luminosity from a supermassive black hole accretion/activity could contaminate the apparent IR luminosities and reduce the observed line to total FIR luminosity, as seen in QSO-selected systems. However, this ratio may not decrease significantly if there is a narrow emission line region of an AGN contributing to the total [Nii] 205 m line luminosity, as seen in the local selection of AGN via the [NII] 6584 / 6548 excess (Baldwin et al., 1981). Our dust SED model is consistent with that of a SB galaxy (Casey et al., 2012; Magnelli et al., 2014), yet the resemblance of such an SED can also be due to a large dust screen strongly attenuating the emission from an obscured, dusty AGN torus ( K, Leung et al. 2018, submitted; Siebenmorgen et al., 2004, 2015; Feltre et al., 2012; Kirkpatrick et al., 2017). Thus, the spatially unresolved measurement of ratio cannot exclusively select an AGN from a SFG.
In the local universe, the observed scatter correlates with the rest-frame log colour (Zhao et al., 2013, 2016). SFGs with colder colours have an average of , while star-forming/SB galaxies with warmer colours have average values of the ratio of (Zhao et al., 2016). We show in Fig. 5 the range observed in the local Universe within galaxies with a similar FIR colour as the RRR (i.e. log; see Fig. 3 in Zhao et al., 2016). The FIR colours can be interpreted as a proxy for the dust temperature. The ratio of the FIR FSL luminosity to IR luminosity in local ULIRGs, both with and without an AGN, reveals a so-called line-to-FIR-continuum “deficit”, where the relative cooling efficiency of the line luminosity decreases with respect to the FIR continuum. This “deficit” increases for higher values of IR luminosity (warmer FIR colour) for [Nii] 205 m , [Nii] 122 m , [CII] 158m, [OI] 63m and [OIII] 88m, with a two order of magnitude scatter for the [Nii] lines (Malhotra et al., 2001; Graciá-Carpio et al., 2011; Díaz-Santos et al., 2017). The nature of this deficit can strongly depend on the location of dust grains along the line of sight to the line emitting region (Díaz-Santos et al., 2013, 2017), and that the “deficit” has a tight correlation to the relative compactness of the IR luminosity surface densities. This reflects the spatial concentration of dust-reprocessed far-UV through IR continuum photons, which diminishes the relative cooling power of the FIR FSL. Using the maximum radius of the RRR in the reconstructed source-plane from the best-fit lens model of Geach et al. (2018, kpc), we infer a mean SFR surface density is of . The high SFR surface density may indicate why the apparent, attenuated ratio of has a low value compared to the mean dispersion of local SFGs with similar rest-FIR colours (see green bar in Fig. 5).
4.3 CO Spectral Line Energy Distribution
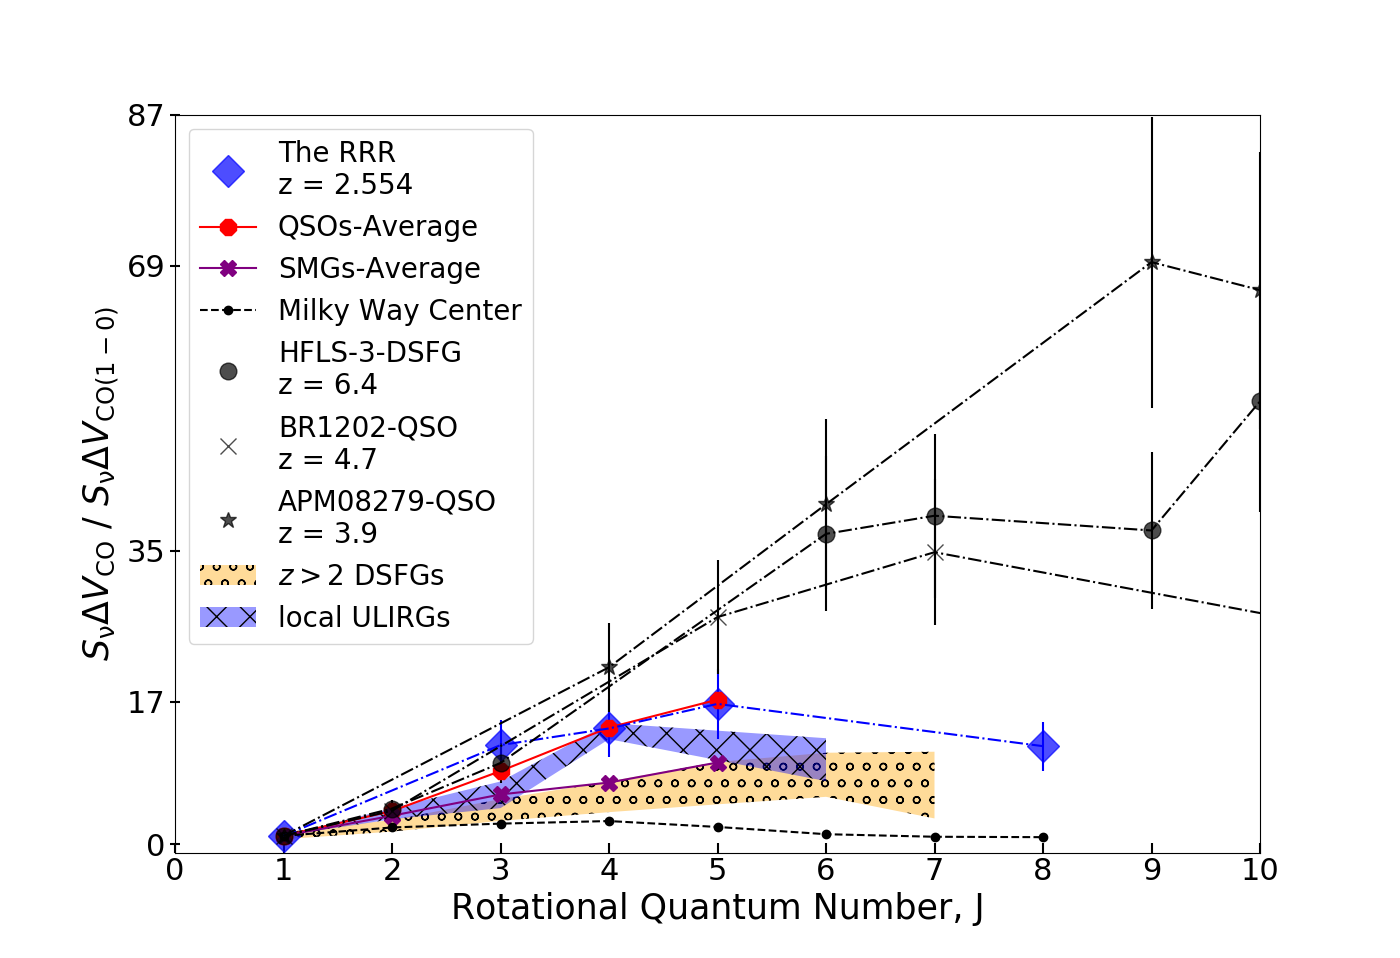
The spectral line energy distribution (SLED) of CO can be a tool to distinguish extreme, highly excited QSO galaxies from galaxies that have molecular gas excitation dominated by SF activity (Daddi et al., 2015; Carilli & Walter, 2013). Fig. 6 compares the CO(1-0) normalised SLED of the RRR with the average spread amongst local ULIRGs, average DSFGs/SMGs, the Milky Way Galactic Centre, and well-known QSO powered systems at high- (Weiß et al., 2007; Fixsen et al., 1999; Papadopoulos et al., 2012; Bothwell et al., 2013; Riechers et al., 2013a). Compared with the Milky Way Centre and the average dusty SFG, the RRR shows high CO excitation. The CO SLED bears a resemblance to the even more extreme gas excitation in local ULIRGs (Papadopoulos et al., 2012; Mashian et al., 2015; Rosenberg et al., 2015), but not as high as the local starbursts, M82 (Panuzzo et al., 2010) and NGC 253 (Hailey-Dunsheath et al., 2008), or the more normal SFG, NGC 891–all of which peak at CO(7-6) (Nikola et al., 2011). The SLED is comparable to the average value of QSOs reported in the review by Carilli & Walter (2013) out to J. Its molecular gas excitation hints at the existence of a strong heating source. To account for the strong mid-J CO lines observed in NGC 253 and NGC 891, both Hailey-Dunsheath et al. (2008); Nikola et al. (2011) both invoke the need for strong mechanical heating/shocks from a turbulent star-forming environment (see also Kamenetzky et al., 2016; Lu et al., 2017). The high-J turnover (at J) and tail of the CO SLED indicates that the CO excitation is, however, not as extreme as in the highly excited QSO systems (Weiß et al., 2007; Salomé et al., 2012).
4.4 Ionised and Molecular Gas Mass
Local [Nii] measurements find that the electron density in both the Milky Way (; Goldsmith et al., 2015) and local (U)LIRGs (; Zhao et al., 2016) is less than . The minimum mass of ionised hydrogen can be approximated, after correcting for the line attenuation, using the high-temperature/high-density limit (see Ferkinhoff et al., 2011; Decarli et al., 2012). Using Eq. 1 in Decarli et al. (2012), we find . This assumes a gas phase nitrogen abundance of, (Savage & Sembach, 1996), determined by UV-absorption sight-lines towards massive stars in the Milky Way. We also assume that all the nitrogen is in the singly ionised state, i.e., . To calculate the relevant fraction of ionised to molecular gas mass, we use the measured line luminosity converted to a total molecular gas mass. Here we assume a CO line to molecular hydrogen gas mass conversion factor, M⊙ (K km s-1pc2)-1, appropriate for ULIRGs (Solomon & Vanden Bout, 2005b; Downes & Solomon, 1998; Sanders & Mirabel, 1996)444A range has been reported for individual ULIRGs: 0.6-2.6 (Downes & Solomon, 1998), and find M⊙. To account for the total molecular gas mass, we correct by the additional mass-weighted contribution by He (1.36 M). The ionised to molecular mass fraction is 25%, consistent with other actively star-forming high- systems (Ferkinhoff et al., 2011; Zhang et al., 2018).
5 Discussion
5.1 Ionised Nitrogen as a SFR tracer
Despite the advantage of directly probing the ionising stars on timescales of 10 Myr, H SFRs are often plagued by uncertainties from dust attenuation (Kennicutt, 1998; Calzetti et al., 2007; Calzetti et al., 2000). In dust-obscured galaxies, the attenuation-corrected H luminosity measurements significantly underestimate the overall SFR (e.g. Whitaker et al., 2017) derived from the total IR (8-1000 m ) luminosity (Kennicutt, 1998; Kennicutt & Evans, 2012). In these dust-rich galaxies, the total IR luminosity has thus been seen as the ideal tracer of SFR because the dust-absorption cross section peaks at the wavelengths emitted by young stellar populations, and is re-emitted by dust in the far-IR wavelength regime (e.g 40-120 m , Helou et al., 1985). IR-derived SFRs trace the characteristic, rather than instantaneous, rates of SF on the order of 100 Myr, depending on the SF history. The total IR luminosity will be mostly dominated by the OB stellar population in starburst systems with less than a few 100 Myr gas consumption timescales (Kennicutt & Evans, 2012).
The far-IR FSLs have longer rest-wavelengths as compared to optical or near-IR tracers of SF, and the line photons may thus escape dust-obscured Hii regions without being absorbed. This motivates the use of far-IR FSLs as faithful tracers of the most recent SF (Fernández-Ontiveros et al., 2016). For example, the [Nii] derived SFR probes quasi-instantaneous star-formation rates corresponding to 30 Myr, i.e. the lifetimes of early B-stars.
Locally, however, [Nii] may not be the ideal SFR tracer for galaxy integrated measurements, as it can trace a mixture of both ambient, diffuse ionised gas and ionised gas closely associated with SF. In contrast, [Nii] may be a more accurate tracer of the global SFR in gas-rich, SFGs at high- , as the latter contains star-forming environments that pervade the entire ISM. Indeed, these systems undergo rapid stellar mass assembly, with SF taking place throughout the entire galaxy (Magdis et al., 2016; Rujopakarn et al., 2016; Elbaz et al., 2018; Chen et al., 2017).
As first presented in Ferkinhoff et al. (2015), there is a physically motivated relation between the SFR and [Nii] line emission for star-forming galaxies. This relation is further substantiated by an empirical relation between the observed [Nii] line emission and the IR-derived SFR (Zhao et al., 2016). In ionisation bounded, low-density Hii regions, the [Nii] line emission is proportional to the ionising photon rate (modulo the N/H ratio), which in turn is proportional to SF. The low- relation of [Nii] line luminosity to SFR can be extended out to high- only by making strong assumptions of both the fractional nitrogen abundance and ionised gas densities (Herrera-Camus et al., 2016). Here we focus on the SFR estimate where the densities are below the critical density for [Nii] 205 m emission line (44 cm-3 Goldsmith et al., 2015), and use Eq. 10 of Herrera-Camus et al. (2016). We assume the collisional excitation coefficients from Tayal (2011), which yields
| (3) |
We estimate an attenuation, and magnification, corrected SFR[NII]205μm = 621 M⊙ yr-1. However, both the nitrogen abundances in the RRR are unknown, and will affect this measurement significantly. The [Nii] 205 m derived SFR is about four times smaller than the traditional IR-derived SFR (Tab. 3).
The SFR derived using Eq. 3 is, however, a lower-limit. The low-density assumption breaks down when the density reaches or even exceeds that of the critical density. This is a possibility for the RRR, as a strong SB could result in increased electron densities and an overlap of Hii regions from widespread SF, yielding electron densities cm-3 (see § 4.2.1 and theoretical [Nii] line ratio vs. in Goldsmith et al., 2015; Herrera-Camus et al., 2016). When the electron density is significantly higher than the critical density for the ground-state, the system is thermalised. Thus, the emission of photons is defined by the Boltzmann level population and the Einstein A-coefficient 555We assume all of the nitrogen is within low-density Hii regions, as opposed to the hottest clusters of early O-type stars (which would result in most of the nitrogen residing in the [Niii] or [NIV], rather than [Nii] )., saturating the [Nii] 205 m line emission. Such high SFR surface density in the RRR (see § 4.2.2) implies the ISM has an electron density cm-3 (Herrera-Camus et al., 2016), i.e. an order of magnitude higher than the critical density of the [Nii] 205 m emission line. To confirm that the disagreement between these two SFR estimates is simply due to high electron density in the ISM of the RRR, detection of the [Nii] 122 m emission line will be needed.
5.2 Co-Evolution of AGN/SF in the RRR
The known compact radio-mode AGN, inferred from high spatial resolution eMERLIN observations (Geach et al., 2015), does not seem to halt the intense SF activity of the RRR (Geach et al., 2018). The unattenuated ratio of [Nii] 205 m and IR luminosity is consistent with a SB galaxy, while the dust/CO SED also disfavors a strong AGN contaminating the IR spectrum (e.g. Salomé et al., 2012; Weiß et al., 2007). The similitude in line profile shapes of the multiple CO lines and the [Nii] 205 m line points at the co-existence of warm ionised and cold molecular phases across kpc scales.
As an example, the spatial co-existence of warm ionised regions traced by [Nii] 205 m , and that of the dense and diffuse molecular gas traced by CO, can be considered similar to the gas phase mixing in the Central Molecular Zone (CMZ) on the scales of (Kruijssen & Longmore, 2013; Ginsburg et al., 2018), and even in the immediate vicinity of Sgr-A* on the scale of (Moser et al., 2017). Hence, the Galactic centre region may serve as a high- galaxy analog (see also Swinbank et al., 2011; Kruijssen & Longmore, 2013). Thermal instability during AGN and SB phases in galaxies is one mechanism to explain how such a co-existence may be maintained over the long-term. Różańska et al. (2014) and Różańska et al. (2017) found that for certain parameter ranges (activity of a galactic nucleus, star cluster input), thermal instability operates666S-curve in the temperature–ionisation parameter plane (), where the ionisation parameter is defined as , where and are radiation and gas pressure, respectively. and essentially leads to the formation of the two-phase (warm–cold) medium, which is rather stable given the long heating and cooling timescales (Field, 1965). This can be one of the main sources of cold gas formation under the presence of stellar, supernova and AGN feedbacks (Tenorio-Tagle et al., 2013). Our global measurements represent the galaxy integrated average of the CO and [Nii] 205 m line emission, such that it is not possible to access the relevant physical scales to compare directly to the CMZ. Geach et al. (2015, 2018) identify a compact radio AGN (250 pc) and a galactic disk traced by CO(4-3), extended over 2.5-3 kpc, therefore the CO(5-4) line emission is almost certainly associated with this molecular disk. However, the relative contributions of the AGN and the large-scale galactic disk to the observed [Nii] 205 m line emission remains to be resolved.
Such co-eval AGN/SF processes within galaxies is expected to be a part of the evolution of a massive galaxy such as the RRR, depicted by a short-lived, merger-induced SB that catalyses high AGN activity and black-hole growth (e.g. Hopkins et al., 2008). There is a range of co-eval AGN/SF processes that can be seen both locally and at high-. In local systems, nuclear regions with high SF and low-AGN fractions are observed to co-exist based on various nebular line diagnostics e.g. (D’Agostino et al., 2018), while there is an inferred quenching of SF in local AGN hosts residing in massive elliptical galaxies (McPartland et al., 2019; Baron et al., 2018). The increased excitation conditions within the narrow emission line regions of an unobscured AGN can ionise the entire ISM (Greene et al., 2011), and potentially quench SF. Therefore the use of ionised nitrogen as a tracer of SF may be unreliable because of the change in ionisation structure of nitrogen (depending on the slope of the ionisation parameter) in the presence of such a strong heating source. High- galaxies, however, with large reservoirs of molecular gas (M⊙) can sustain ongoing SF even in the most extreme, optically bright, broad-line QSO systems (Alaghband-Zadeh et al., 2016; Glikman et al., 2015; Cresci et al., 2015). A systematic study of 100 gravitationally lensed QSOs (), Stacey et al. (2018) found most have both SF and AGN activity. Our conclusions in § 4.2.2 and 4.3 suggest it is possible for both AGN and SB activity to co-exist, and this may be due to both thermal instability and the large molecular gas reservoir in the RRR.
6 Summary and Conclusions
We present the detection of [Nii] 205 m in a strongly lensed AGN/SB galaxy at , obtained using the APEX telescope. We complement this detection with multiple CO line transitions (CO 1-0, 5-4, 8-7) to examine the global properties of the ionised and molecular gas in the RRR. Our main conclusions are:
The line profiles for the CO and the [Nii] 205 m emission lines have similar velocity components that can be explained by shared volumes, i.e. molecular clouds well-mixed with Hii regions, suggesting the majority of the strong [Nii] 205 m detection is associated with SF.
The non-negligible dust attenuation at rest-frame 205 m in the RRR suggests that these corrections need to be accounted for when interpreting far-IR FSLs in dust-rich systems at high-z. Assuming a uniform dust screen approximation results in a dust attenuation correction, , of for the RRR. This implies a mean H2 gas column density cm-2, assuming a molecular gas-to-dust mass ratio of 100.
We derived an attenuation corrected, minimum ionised gas mass, Mmin(H+) M⊙, assuming a high-density / high-temperature limit. This ionised gas mass corresponds to about 25% of the total molecular gas mass derived using the measured CO(1-0) line luminosity and M⊙ (K km s-1pc2)-1.
The attenuation corrected value of , resembles the average values of SFGs rather than those with a known QSO influence.
The IR SFR, SFRIR = 2482 992 M⊙ yr-1, is a factor of four larger than the lower-limit SFR estimate from the attenuation corrected, [Nii] 205 m line luminosity in the low-density regime: SFR621 M⊙ yr-1. This suggests the electron density is significantly high, or the assumed nitrogen abundance is significantly lower.
Utilising the [Nii] 205 m line as a tracer of SF has a strong physical motivation, although the reliable application of local relations requires extensive calibration for high- dusty SFGs. Future spatially resolved [Nii] 205 m and [Nii] 122 m observations would help to isolate low-density vs. high-density Hii complexes in the warm ionised medium (as seen in Spinoglio et al., 2015; Zhao et al., 2016) in order to aid future interpretations in this system.
Acknowledgements
The authors would like to thank the referee for her/his comments and suggestions to enhance the quality of the manuscript. KCH extends his appreciation to the entire facility staff/observers/operators at the GBT, IRAM 30m and APEX for making the accommodation and observing welcoming and successful.The Green Bank Observatory is a facility of the National Science Foundation operated under cooperative agreement by Associated Universities, Inc. IRAM is supported by INSU/CNRS (France), MPG (Germany) and IGN (Spain). This work is carried out within the Collaborative Research Centre 956, sub-project [A1, C4], funded by the Deutsche Forschungsgemeinschaft (DFG). D.R. acknowledges support from the National Science Foundation under grant number AST-1614213.This publication is based on data acquired with the Atacama Pathfinder Experiment (APEX) Telescope. APEX is a collaboration between the Max-Planck-Institut fur Radioastronomie, the European Southern Observatory, and the Onsala Space Observatory. IRAM is supported by INSU/CNRS (France), MPG (Germany) and IGN (Spain).TKDL acknowledges support from the NSF through award SOSPA4-009 from the NRAO and support from the Simons Foundation. The Flatiron Institute is supported by the Simons Foundation.
References
- Alaghband-Zadeh et al. (2016) Alaghband-Zadeh S., Banerji M., Hewett P. C., McMahon R. G., 2016, MNRAS, 459, 999
- Baldwin et al. (1981) Baldwin J. A., Phillips M. M., Terlevich R., 1981, PASP, 93, 5
- Baron et al. (2018) Baron D., et al., 2018, MNRAS, 480, 3993
- Bennett et al. (1994) Bennett C. L., et al., 1994, ApJ, 434, 587
- Bennett et al. (2014) Bennett C. L., Larson D., Weiland J. L., Hinshaw G., 2014, ApJ, 794, 135
- Béthermin et al. (2016) Béthermin M., et al., 2016, A&A, 586, L7
- Bothwell et al. (2013) Bothwell M. S., et al., 2013, MNRAS, 429, 3047
- Brisbin et al. (2015) Brisbin D., Ferkinhoff C., Nikola T., Parshley S., Stacey G. J., Spoon H., Hailey-Dunsheath S., Verma A., 2015, ApJ, 799, 13
- Brott et al. (2011) Brott I., et al., 2011, A&A, 530, A115
- Cañameras et al. (2015) Cañameras R., et al., 2015, A&A, 581, A105
- Calzetti et al. (2000) Calzetti D., Armus L., Bohlin R. C., Kinney A. L., Koornneef J., Storchi-Bergmann T., 2000, ApJ, 533, 682
- Calzetti et al. (2007) Calzetti D., et al., 2007, ApJ, 666, 870
- Carilli & Walter (2013) Carilli C. L., Walter F., 2013, ARA&A, 51, 105
- Casey et al. (2012) Casey C. M., et al., 2012, ApJ, 761, 139
- Chen et al. (2017) Chen C.-C., et al., 2017, ApJ, 846, 108
- Cicone et al. (2014) Cicone C., et al., 2014, A&A, 562, A21
- Cicone et al. (2015) Cicone C., et al., 2015, A&A, 574, A14
- Cicone et al. (2018) Cicone C., et al., 2018, ApJ, 863, 143
- Colgan et al. (1993) Colgan S. W. J., Haas M. R., Erickson E. F., Rubin R. H., Simpson J. P., Russell R. W., 1993, ApJ, 413, 237
- Combes et al. (2012) Combes F., et al., 2012, A&A, 538, L4
- Cormier et al. (2015) Cormier D., et al., 2015, A&A, 578, A53
- Cresci et al. (2015) Cresci G., et al., 2015, ApJ, 799, 82
- Crowther (2007) Crowther P. A., 2007, Annual Review of Astronomy and Astrophysics, 45, 177
- D’Agostino et al. (2018) D’Agostino J. J., Poetrodjojo H., Ho I. T., Groves B., Kewley L., Madore B. F., Rich J., Seibert M., 2018, MNRAS, 479, 4907
- Daddi et al. (2015) Daddi E., et al., 2015, A&A, 577, A46
- Dale et al. (2001) Dale D. A., Helou G., Contursi A., Silbermann N. A., Kolhatkar S., 2001, ApJ, 549, 215
- Dalla Vecchia & Schaye (2008) Dalla Vecchia C., Schaye J., 2008, MNRAS, 387, 1431
- Decarli et al. (2012) Decarli R., et al., 2012, ApJ, 752, 2
- Decarli et al. (2014) Decarli R., et al., 2014, ApJ, 782, L17
- Díaz-Santos et al. (2013) Díaz-Santos T., et al., 2013, ApJ, 774, 68
- Díaz-Santos et al. (2017) Díaz-Santos T., et al., 2017, ApJ, 846, 32
- Dietrich et al. (2018) Dietrich J., et al., 2018, MNRAS, 480, 3562
- Downes & Solomon (1998) Downes D., Solomon P. M., 1998, ApJ, 507, 615
- Ekström et al. (2012) Ekström S., et al., 2012, A&A, 537, A146
- Elbaz et al. (2018) Elbaz D., et al., 2018, A&A, 616, A110
- Farrah et al. (2013) Farrah D., et al., 2013, ApJ, 776, 38
- Feltre et al. (2012) Feltre A., Hatziminaoglou E., Fritz J., Franceschini A., 2012, MNRAS, 426, 120
- Ferkinhoff et al. (2010) Ferkinhoff C., Hailey-Dunsheath S., Nikola T., Parshley S. C., Stacey G. J., Benford D. J., Staguhn J. G., 2010, ApJ, 714, L147
- Ferkinhoff et al. (2011) Ferkinhoff C., et al., 2011, ApJ, 740, L29
- Ferkinhoff et al. (2015) Ferkinhoff C., Brisbin D., Nikola T., Stacey G. J., Sheth K., Hailey-Dunsheath S., Falgarone E., 2015, ApJ, 806, 260
- Fernández-Ontiveros et al. (2016) Fernández-Ontiveros J. A., Spinoglio L., Pereira-Santaella M., Malkan M. A., Andreani P., Dasyra K. M., 2016, The Astrophysical Journal Supplement Series, 226, 19
- Field (1965) Field G. B., 1965, ApJ, 142, 531
- Fischer et al. (2010) Fischer J., et al., 2010, A&A, 518, L41
- Fixsen et al. (1999) Fixsen D. J., Bennett C. L., Mather J. C., 1999, ApJ, 526, 207
- Frayer et al. (2018) Frayer D. T., Maddalena R. J., Ivison R. J., Smail I., Blain A. W., Vanden Bout P., 2018, ApJ, 860, 87
- Fu et al. (2012) Fu H., Jullo E., Cooray A., Bussmann R. S., Ivison R. J., et al., 2012, ApJ, 753, 134
- Geach et al. (2015) Geach J. E., et al., 2015, MNRAS, 452, 502
- Geach et al. (2018) Geach J. E., Ivison R. J., Dye S., Oteo I., 2018, ApJ, 866, L12
- Genzel et al. (2010) Genzel R., et al., 2010, MNRAS, 407, 2091
- Ginsburg et al. (2018) Ginsburg A., et al., 2018, ApJ, 853, 171
- Glikman et al. (2015) Glikman E., Simmons B., Mailly M., Schawinski K., Urry C. M., Lacy M., 2015, ApJ, 806, 218
- Goldsmith et al. (2015) Goldsmith P. F., Yıldız U. A., Langer W. D., Pineda J. L., 2015, ApJ, 814, 133
- Graciá-Carpio et al. (2011) Graciá-Carpio J., et al., 2011, ApJ, 728, L7
- Greene et al. (2011) Greene J. E., Zakamska N. L., Ho L. C., Barth A. J., 2011, ApJ, 732, 9
- Güsten et al. (2006) Güsten R., Nyman L. Å., Schilke P., Menten K., Cesarsky C., Booth R., 2006, A&A, 454, L13
- Hailey-Dunsheath et al. (2008) Hailey-Dunsheath S., Nikola T., Stacey G. J., Oberst T. E., Parshley S. C., Bradford C. M., Ade P. A. R., Tucker C. E., 2008, ApJ, 689, L109
- Hailey-Dunsheath et al. (2010) Hailey-Dunsheath S., Nikola T., Stacey G. J., Oberst T. E., Parshley S. C., Benford D. J., Staguhn J. G., Tucker C. E., 2010, ApJ, 714, L162
- Harrington et al. (2016) Harrington K. C., et al., 2016, MNRAS, 458, 4383
- Harrington et al. (2018) Harrington K. C., et al., 2018, MNRAS, 474, 3866
- Helou et al. (1985) Helou G., Soifer B. T., Rowan-Robinson M., 1985, ApJ, 298, L7
- Herrera-Camus et al. (2016) Herrera-Camus R., et al., 2016, ApJ, 826, 175
- Heyminck et al. (2006) Heyminck S., Kasemann C., Güsten R., de Lange G., Graf U. U., 2006, A&A, 454, L21
- Hickox & Alexander (2018) Hickox R. C., Alexander D. M., 2018, Annual Review of Astronomy and Astrophysics, 56, 625
- Hopkins et al. (2008) Hopkins P. F., Hernquist L., Cox T. J., Kereš D., 2008, The Astrophysical Journal Supplement Series, 175, 356
- Kamenetzky et al. (2016) Kamenetzky J., Rangwala N., Glenn J., Maloney P. R., Conley A., 2016, ApJ, 829, 93
- Kennicutt (1998) Kennicutt J. R. C., 1998, ARA&A, 36, 189
- Kennicutt & Evans (2012) Kennicutt R. C., Evans N. J., 2012, Annual Review of Astronomy and Astrophysics, 50, 531
- Kirkpatrick et al. (2017) Kirkpatrick A., et al., 2017, ApJ, 849, 111
- Klein et al. (2006) Klein B., Philipp S. D., Krämer I., Kasemann C., Güsten R., Menten K. M., 2006, A&A, 454, L29
- Kruijssen & Longmore (2013) Kruijssen J. M. D., Longmore S. N., 2013, MNRAS, 435, 2598
- Lamarche et al. (2017) Lamarche C., et al., 2017, ApJ, 836, 123
- Lamarche et al. (2018) Lamarche C., et al., 2018, preprint, p. arXiv:1809.09630 (arXiv:1809.09630)
- Leung et al. (2019) Leung T. K. D., et al., 2019, ApJ, 871, 85
- Lu et al. (2017) Lu N., et al., 2017, ApJS, 230, 1
- Lu et al. (2018) Lu N., et al., 2018, ApJ, 864, 38
- Madau and Dickinson, (2014) Madau and Dickinson, 2014, ARA&A, 52, 415
- Maeder & Meynet (2000) Maeder A., Meynet G., 2000, A&A, 361, 159
- Magdis et al. (2016) Magdis G. E., et al., 2016, MNRAS, 456, 4533
- Magnelli et al. (2014) Magnelli B., et al., 2014, A&A, 561, A86
- Maiolino et al. (2005) Maiolino R., et al., 2005, A&A, 440, L51
- Maiolino et al. (2009) Maiolino R., Caselli P., Nagao T., Walmsley M., De Breuck C., Meneghetti M., 2009, A&A, 500, L1
- Malhotra et al. (2001) Malhotra S., et al., 2001, ApJ, 561, 766
- Marganian et al. (2013) Marganian P., Garwood R. W., Braatz J. A., Radziwill N. M., Maddalena R. J., 2013, GBTIDL: Reduction and Analysis of GBT Spectral Line Data, Astrophysics Source Code Library (ascl:1303.019)
- Marrone et al. (2018) Marrone D. P., et al., 2018, Nature, 553, 51
- Marshall et al. (2016) Marshall P. J., et al., 2016, MNRAS, 455, 1171
- Mashian et al. (2015) Mashian N., et al., 2015, ApJ, 802, 81
- McKee & Williams (1997) McKee C. F., Williams J. P., 1997, ApJ, 476, 144
- McPartland et al. (2019) McPartland C., Sanders D. B., Kewley L. J., Leslie S. K., 2019, MNRAS, 482, L129
- Moser et al. (2017) Moser L., et al., 2017, A&A, 603, A68
- Nagao et al. (2012) Nagao T., Maiolino R., De Breuck C., Caselli P., Hatsukade B., Saigo K., 2012, A&A, 542, L34
- Nayyeri et al. (2016) Nayyeri H., et al., 2016, ApJ, 823, 17
- Negrello et al. (2010) Negrello M., Hopwood R., De Zotti G., Cooray A., Verma A., et al., 2010, Science, 330, 800
- Nikola et al. (2011) Nikola T., Stacey G. J., Brisbin D., Ferkinhoff C., Hailey-Dunsheath S., Parshley S., Tucker C., 2011, ApJ, 742, 88
- Oberst et al. (2006) Oberst T. E., et al., 2006, ApJ, 652, L125
- Oberst et al. (2011) Oberst T. E., Parshley S. C., Nikola T., Stacey G. J., Löhr A., Lane A. P., Stark A. A., Kamenetzky J., 2011, ApJ, 739, 100
- Panuzzo et al. (2010) Panuzzo P., et al., 2010, A&A, 518, L37
- Papadopoulos et al. (2012) Papadopoulos P. P., van der Werf P. P., Xilouris E. M., Isaak K. G., Gao Y., Mühle S., 2012, MNRAS, 426, 2601
- Parkin et al. (2013) Parkin T. J., et al., 2013, ApJ, 776, 65
- Pavesi et al. (2016) Pavesi R., et al., 2016, ApJ, 832, 151
- Pavesi et al. (2018a) Pavesi R., Riechers D. A., Faisst A. L., Stacey G. J., Capak P. L., 2018a, preprint, p. arXiv:1812.00006 (arXiv:1812.00006)
- Pavesi et al. (2018b) Pavesi R., et al., 2018b, ApJ, 861, 43
- Petuchowski et al. (1994) Petuchowski S. J., Bennett C. L., Haas M. R., Erickson E. F., Lord S. D., Rubin R. H., Colgan S. W. J., Hollenbach D. J., 1994, ApJ, 427, L17
- Planck Collaboration XXVII (2015) Planck Collaboration XXVII 2015, A&A, 582, A30
- Puls et al. (2008) Puls J., Vink J. S., Najarro F., 2008, Astronomy and Astrophysics Review, 16, 209
- Rawle et al. (2014) Rawle T. D., et al., 2014, ApJ, 783, 59
- Riechers et al. (2013a) Riechers D. A., et al., 2013a, Nature, 496, 329
- Riechers et al. (2013b) Riechers D. A., et al., 2013b, Nature, 496, 329
- Riechers et al. (2014) Riechers D. A., et al., 2014, ApJ, 796, 84
- Rivera et al. (2018) Rivera J., et al., 2018, preprint, p. arXiv:1807.08895 (arXiv:1807.08895)
- Rosdahl et al. (2017) Rosdahl J., Schaye J., Dubois Y., Kimm T., Teyssier R., 2017, MNRAS, 466, 11
- Rosenberg et al. (2015) Rosenberg M. J. F., et al., 2015, ApJ, 801, 72
- Różańska et al. (2014) Różańska A., Czerny B., Kunneriath D., Adhikari T. P., Karas V., Mościbrodzka M., 2014, MNRAS, 445, 4385
- Różańska et al. (2017) Różańska A., Kunneriath D., Czerny B., Adhikari T. P., Karas V., 2017, MNRAS, 464, 2090
- Rujopakarn et al. (2016) Rujopakarn W., et al., 2016, ApJ, 833, 12
- Salomé et al. (2012) Salomé P., Guélin M., Downes D., Cox P., Guilloteau S., Omont A., Gavazzi R., Neri R., 2012, A&A, 545, A57
- Sanders & Mirabel (1996) Sanders D. B., Mirabel I. F., 1996, ARA&A, 34, 749
- Savage & Sembach (1996) Savage B. D., Sembach K. R., 1996, ApJ, 470, 893
- Scannapieco et al. (2012) Scannapieco C., et al., 2012, MNRAS, 423, 1726
- Schinnerer et al. (2016) Schinnerer E., et al., 2016, ApJ, 833, 112
- Schulz et al. (2017) Schulz B., et al., 2017, arXiv e-prints, p. arXiv:1706.00448
- Scoville et al. (2014) Scoville N., et al., 2014, ApJ, 783, 84
- Scoville et al. (2016) Scoville N., et al., 2016, ApJ, 824, 63
- Scoville et al. (2017) Scoville N., et al., 2017, ApJ, 837, 150
- Serjeant (2012) Serjeant S., 2012, MNRAS, 424, 2429
- Siebenmorgen et al. (2004) Siebenmorgen R., Krügel E., Spoon H. W. W., 2004, A&A, 414, 123
- Siebenmorgen et al. (2015) Siebenmorgen R., Heymann F., Efstathiou A., 2015, A&A, 583, A120
- Solomon & Vanden Bout (2005a) Solomon P. M., Vanden Bout P. A., 2005a, ARA&A, 43, 677
- Solomon & Vanden Bout (2005b) Solomon P. M., Vanden Bout P. A., 2005b, ARA&A, 43, 677
- Solomon et al. (1997) Solomon P. M., Downes D., Radford S. J. E., Barrett J. W., 1997, ApJ, 478, 144
- Spinoglio et al. (2015) Spinoglio L., Pereira-Santaella M., Dasyra K. M., Calzoletti L., Malkan M. A., Tommasin S., Busquet G., 2015, ApJ, 799, 21
- Stacey et al. (2018) Stacey H. R., et al., 2018, MNRAS, 476, 5075
- Stanway & Eldridge (2018) Stanway E. R., Eldridge J. J., 2018, preprint, (arXiv:1811.03856)
- Su et al. (2017) Su T., et al., 2017, MNRAS, 464, 968
- Swinbank et al. (2011) Swinbank A. M., et al., 2011, ApJ, 742, 11
- Tacconi et al. (2010) Tacconi L. J., et al., 2010, Nature, 463, 781
- Tacconi et al. (2018) Tacconi L. J., et al., 2018, ApJ, 853, 179
- Tayal (2011) Tayal S. S., 2011, The Astrophysical Journal Supplement Series, 195, 12
- Tenorio-Tagle et al. (2013) Tenorio-Tagle G., Silich S., Martínez-González S., Muñoz-Tuñón C., Palouš J., Wünsch R., 2013, ApJ, 778, 159
- Tsai et al. (2015) Tsai C.-W., et al., 2015, ApJ, 805, 90
- Uzgil et al. (2016) Uzgil B. D., Bradford C. M., Hailey-Dunsheath S., Maloney P. R., Aguirre J. E., 2016, ApJ, 832, 209
- Vishwas et al. (2018) Vishwas A., et al., 2018, ApJ, 856, 174
- Walter et al. (2009) Walter F., Weiß A., Riechers D. A., Carilli C. L., Bertoldi F., Cox P., Menten K. M., 2009, ApJ, 691, L1
- Wardlow et al. (2013) Wardlow J. L., et al., 2013, ApJ, 762, 59
- Weiß et al. (2007) Weiß A., Downes D., Neri R., Walter F., Henkel C., Wilner D. J., Wagg J., Wiklind T., 2007, A&A, 467, 955
- Weiß et al. (2008) Weiß A., Kovács A., Güsten R., Menten K. M., Schuller F., Siringo G., Kreysa E., 2008, A&A, 490, 77
- Whitaker et al. (2017) Whitaker K. E., Pope A., Cybulski R., Casey C. M., Popping G., Yun M. S., 2017, ApJ, 850, 208
- Zanella et al. (2018) Zanella A., et al., 2018, MNRAS, 481, 1976
- Zavala et al. (2018) Zavala J. A., et al., 2018, Nature Astronomy, 2, 56
- Zhang et al. (2018) Zhang Z.-Y., et al., 2018, MNRAS, 481, 59
- Zhao et al. (2013) Zhao Y., et al., 2013, ApJ, 765, L13
- Zhao et al. (2016) Zhao Y., et al., 2016, ApJ, 819, 69