Lattice dynamics and phase transitions in Fe3-xGeTe2
Abstract
We present Raman spectroscopy measurements of van der Waals bonded ferromagnet Fe3-xGeTe2, together with lattice dynamics. Four out of eight Raman active modes are observed and assigned, in agreement with numerical calculations. Energies and line-widths of the observed modes display unconventional temperature dependence at about 150 K and 220 K followed by the non-monotonic evolution of the Raman continuum. Whereas the former can be related to the magnetic phase transition, origin of the latter anomaly remains an open question.
pacs:
I Introduction
Novel class of magnetism hosting van der Waals bonded materials have recently became of great interest, since they are suitable candidates for numbers of technical applications Sivadas et al. (2015); Novoselov et al. (2004); Wang et al. (2012); Gong et al. (2017); Huang et al. (2017). Whereas CrXTe3 (X = Si, Ge, Sn) and CrX3 (X = Cl, Br, I) classes maintain low phase transitions temperatures McGuire et al. (2015); Sivadas et al. (2015); Zhuang et al. (2015); Lin et al. (2017); Casto et al. (2015, 2015) even in a monolayer regime Lin et al. (2016), Fe3-xGeTe2 has a high bulk transition temperature, between 220 K and 230 K Zhu, Jian-Xin and Janoschek, Marc and Chaves, D. S. and Cezar, J. C. and Durakiewicz, Tomasz and Ronning, Filip and Sassa, Yasmine and Mansson, Martin and Scott, B. L. and Wakeham, N. and Bauer, Eric D. and Thompson, J. D. (2016); Chen ,Bin and Yang ,JinHu and Wang ,HangDong and Imai ,Masaki and Ohta ,Hiroto and Michioka ,Chishiro and Yoshimura ,Kazuyoshi and Fang ,MingHu (2013), making it a promising applicant.
The Fe3-xGeTe2 crystal structure consists of Fe3-xGe sublayers stacked between two sheets of Te atoms, and a van der Waals gap between neighboring Te layers Liu et al. (2017); Deiseroth, Hans - Jorg and Aleksandrov, Krasimir and Reiner, Christof and Kienle, Lorenz and Kremer, Reinhard K. (2006). Although structure contains two different types of Fe atoms, it is revealed that vacancies take place only in the Fe2 sites Liu et al. (2017); May et al. (2016).
Neutron diffraction, thermodynamic and transport measurements, and Mössbauer spectroscopy were used to analyse magnetic and functional properties of Fe3-xGeTe2, with Fe atoms deficiency of and K. It is revealed that at temperature of 1.5 K, magnetic moments of 1.95(5) and 1.56(4) are directed along easy magnetic -axes Verchenko, Valeriy Yu. and Tsirlin, Alexander A. and Sobolev, Alexei V. and Presniakov, Igor A. and Shevelkov, Andrei V. (2015). In chemical vapor transport (CVT) grown Fe3GeTe2 single crystals, besides FM-PM transition at temperature of 214 K, FM layers order antifferomagnetically at 152 K Yi et al. (2016). Close to ferromagnetic transition temperature of 230 K, possible Kondo lattice behaviour, i.e. coupling of travelling electrons and periodically localized spins is indicated at K, which is in a good agreement with theoretical predictions of 222 K Zhang, Yun and Lu, Haiyan and Zhu, Xiegang and Tan, Shiyong and Feng, Wei and Liu, Qin and Zhang, Wen and Chen, Qiuyun and Liu, Yi and Luo, Xuebing and Xie, Donghua and Luo, Lizhu and Zhang, Zhengjun and Lai, Xinchun (2018).
Lattice parameters, as well as magnetic transition temperature, vary with Fe ions concentration. Lattice parameters, and follow the opposite trend, whereas Curie temperature decreases with an increase of Fe ions concentrationMay et al. (2016). For flux-grown crystals, the critical behaviour was investigated by bulk dc magnetization around the ferromagnetic phase transition temperature of 152 K Liu et al. (2017). Anomalous Hall effect was also studied, where a significant amount of defects produces bad metallic behaviour Liu et al. (2018).
Theoretical calculations predict dynamical stability of Fe3GeTe2 single layer, uniaxial magnetocrystalline anisotropy, that originates from spin-orbit coupling Zhuang et al. (2016). Recently, anomalous Hall effect measurements on single crystalline metallic Fe3GeTe2 nanoflakes with different thicknesses are reported, with a near 200 K and strong perpendicular magnetic anisotropy Tan et al. (2018).
We report Fe3-xGeTe2 single crystal lattice dynamic calculations, together with Raman spectroscopy measurements. Four out of eight Raman active modes were observed and assigned. Phonon energies are in a good agreement with theoretical predictions. Analysed phonon energies and line widths reveal fingerprint of ferromagnetic phase transition at temperature around 150 K. Moreover, discontinuities in phonon properties are found at temperatures around 220 K. Consistently, in the same temperature range, Raman continuum displays non-monotonic behaviour.
II Experiment and numerical method
Fe3-xGeTe2 single crystals were grown by self-flux method as previously described Liu et al. (2017). Samples for scanning electron microscopy (SEM) were cleaved and deposited on a graphite tape. Energy dispersive spectroscopy (EDS) maps were collected using FEI HeliosNanolab 650 equipped with an Oxford Instruments EDS system, equipped with an X-max SSD detector operating at 20 kV. The surface of the as-cleaved Fe3-xGeTe2 crystal appears to be uniform for several tens of microns in both directions, as shown in Fig. A1 of the Appendix. Additionally, the elemental composition maps of Fe, Ge and Te show distinctive homogeneity of all the three elements [Fig. A2 of the Appendix].
For Raman scattering experiments, Tri Vista 557 spectrometer was used in the backscattering micro-Raman configuration. As an excitation source, solid state laser with 532 nm line was used. In our scattering configuration, plane of incidence is -plane, where (), with incident (scattered) light propagation direction along -axes. Samples were cleaved in the air, right before being placed in the vacuum. All the measurements were performed in the high vacuum ( mbar) using a KONTI CryoVac continuous Helium flow cryostat with 0.5 mm thick window. To achieve laser beam focusing, microscope objective with 50 magnification was used. Bose factor correction of all spectra was performed. More details can be found in the Appendix.
Density functional theory calculations were performed in Quantum Espresso software package Giannozzi et al. (2009). We used the PAW pseudopotentials Blöchl (1994); Kresse and Joubert (1999) with the Perdew-Burke-Ernzerhof (PBE) exchange-correlation functional Perdew et al. (1996). The electron wavefunction and charge density cutoffs of 64 Ry and 782 Ry were chosen, respectively. The -points were sampled using the Monkhorst-Pack scheme, with -centered grid. Both magnetic and non-magnetic calculations were performed, using the experimentally obtained lattice parameters and the calculated values obtained by relaxing the theoretically proposed structure. In order to obtain the lattice parameters accurately, treatment of the Van der Waals interactions is introduced. Van der Waals interaction was included in all calculations using the Grimme-D2 correction Grimme (2006). Phonon frequencies in point are calculated within the linear response method implemented in QE.
III Results and Discussion
Fe3-xGeTe2 crystallises in hexagonal crystal structure, described with () space group. The atom type, site symmetry, each site’s contribution to the phonons in point, and corresponding Raman tensors for space group are presented in Table 1.
| Space group (No. 194) | ||
|---|---|---|
| Fe1 () | + | |
| Fe2 () | + | |
| Ge () | + | |
| Te () | + | |
| Raman tensors | ||
| Raman active modes | ||
| Symmetry | Calculations (M) | Experiment (M) |
| 50.2 | - | |
| 70.3 | - | |
| 122.2 | 89.2 | |
| 137.2 | 121.1 | |
| 209.5 | - | |
| 228.6 | 214.8 | |
| 233.4 | 239.6 | |
| 334.3 | - | |
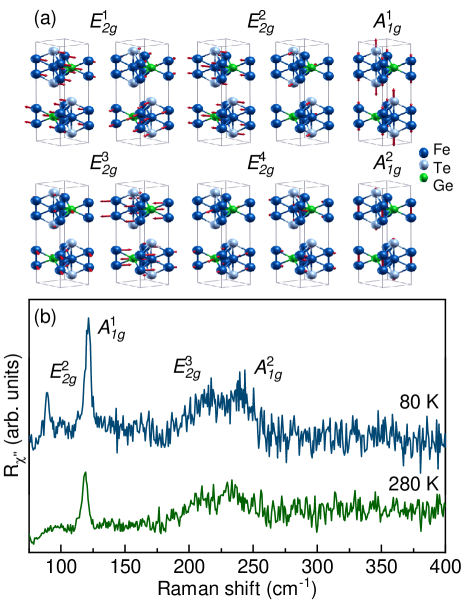
Calculated displacement patterns of Raman active modes, which can be observed in our scattering configuration are presented in Fig. 1 (a). Since Raman tensor of mode contains only component [Tab. 1], by selection rules, it can not be detected when measuring from the plane in the backscattering configuration. Whereas modes include vibrations of Fe and Te ions along -axis, modes include in plane vibrations of all four atoms. Raman spectra of Fe3-xGeTe2 in magnetic phase (M), at 80 K and non-magnetic phase (NM), at 280 K, in parallel scattering configuration (), are presented in Fig. 1 (b). As it can be seen, four peaks at 89.2 , 121.1 , 214.8 and 239.6 can be clearly observed at 80 K. According to numerical calculations [see Table 1], peaks at 89.2 and 239.6 correspond to two out of four modes, whereas peaks at 121.1 and 239.6 can be assigned as two symmetry modes. One should note that numerical calculations performed by using experimentally obtained lattice parameters in magnetic phase yield better agreement with experimental values. This is not surprising since the calculations are preformed for the stoichiometric compound as opposed to the non-stoichiometry of the sample. Furthermore, it is known that lattice parameters strongly depend on Fe atoms deficiency May et al. (2016). All calculated Raman and infrared phonon frequencies, for magnetic and non magnetic phase of Fe3-xGeTe2, using relaxed and experimental lattice parameters, together with experimentally observed Raman active modes are summarized in Table AI of the Appendix.
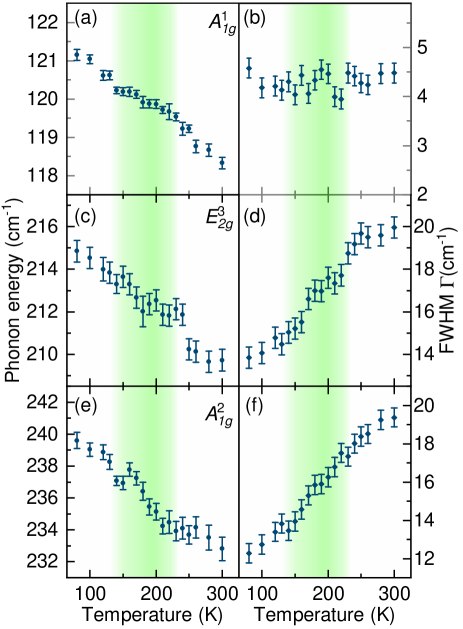
After assigning all observed modes we focused on their temperature evolution. Having in mind finite instrumental broadening, Voigt line shape was used for the data analysisMilosavljević et al. (2018); Baum et al. (2018). Modelling procedure is described in details in the Appendix and presented in Fig. A3. Fig. 2 shows temperature evolution of energy and linewidth of , and mode between 80 K and 300 K. Upon heating the sample, both, energy and linewidth of and symmetry modes, exhibit small, but sudden discontinuity at about 150 K [Fig. 2 (a) and (e)]. Apparent discontinuity in energy of all analysed Raman modes is again present at temperatures around 220 K. In the same temperature range linewidths of these Raman modes show clear deviation from the standard anharmonic behavior Milosavljević et al. (2018); Baum et al. (2018); Opačić et al. (2016); Popović et al. (2014, 2015).
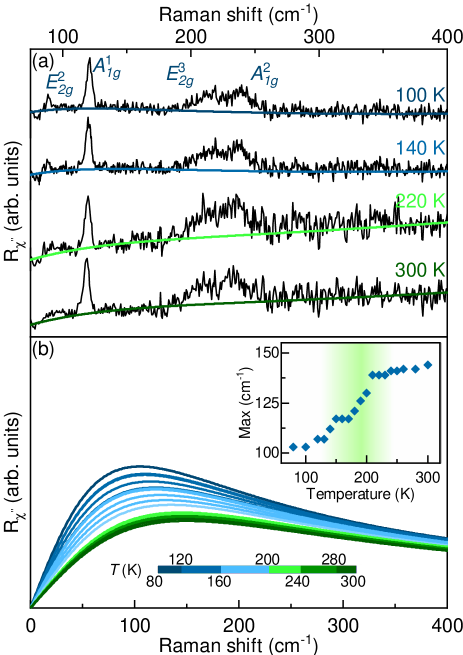
Apart from the anomalies in the phonon spectra, closer inspection of the temperature dependent Raman spectra measured in the parallel polarization configuration reveals pronounced evolution of the Raman continuum [Fig. 3 (a)]. For the analysis we have used simple model including damped Lorentzian and linear therm, Devereaux and Hackl (2007), where , and are temperature dependent parameters. Fig. 3 (b) summarizes the results of the analysis with linear therm omitted (most likely originating from a luminescence). At approximately same temperatures, where phonon properties exhibit discontinuities, the continuum temperature dependence manifests non-monotonic behaviour. The curve maximum positions were obtained by integrating those shown in Fig. 3 (b). Inset of Fig. 3 (b) shows temperature evolution of their displacements. This analysis confirms the presence of discontinuities in electronic continuum at temperatures around 150 K and 220 K, which leaves a trace in phonon behaviour around these temperatures [Fig. 2]. While we do not have evidence for Kondo effect in Fe3-xGeTe2 crystals we measured, modification of electronic background at FM ordering due to localization or Kondo effect cannot be excluded.
The temperature evolutions of phonon self-energies and the continuum observed in the Raman spectra of Fe3-xGeTe2, suggest the presence of phase transition(s). Magnetization measurements of samples were performed as described in Ref. Liu et al. (2017), revealing FM-PM transition at 150 K. Thus, the discontinuity in observed phonon properties around this temperature, can be traced back to the weak to moderate spin-phonon coupling. The question remains open regarding the anomaly observed at about 220 K. As previously reported, Curie temperature of the Fe3-xGeTe2 single crystals grown by CVT method is between 220 K and 230 K Deiseroth, Hans - Jorg and Aleksandrov, Krasimir and Reiner, Christof and Kienle, Lorenz and Kremer, Reinhard K. (2006); Zhu, Jian-Xin and Janoschek, Marc and Chaves, D. S. and Cezar, J. C. and Durakiewicz, Tomasz and Ronning, Filip and Sassa, Yasmine and Mansson, Martin and Scott, B. L. and Wakeham, N. and Bauer, Eric D. and Thompson, J. D. (2016); Chen ,Bin and Yang ,JinHu and Wang ,HangDong and Imai ,Masaki and Ohta ,Hiroto and Michioka ,Chishiro and Yoshimura ,Kazuyoshi and Fang ,MingHu (2013), varying with vacancies concentration, i.e. decrease in vacancies content will result the increment of May et al. (2016). On the other hand, the Fe3-xGeTe2 crystals grown by self-flux method usually have lower Curie temperature, since the vacancy content is higher Liu et al. (2017); May et al. (2016). Crystals used in the Raman scattering experiment presented here were grown by self-flux method with the Fe vacancy content of Liu et al. (2017). This is in a good agreement with our EDS results of , giving rise to the FM-PM transition at 150 K. Nevertheless, inhomogeneous distribution of vacancies may result in a formation of vacancy depleted ”islands” which in turn would result in anomaly at 220 K similar to the one observed in our Raman data. However, the EDS data [see Fig. A2] do not support this possibility. At this point we can only speculate that while the long-range order temperature is shifted to lower temperature by introduction of vacancies, short range correlations may develop at 220 K.
IV Conclusion
We have studied lattice dynamic of flux-grown Fe3-xGeTe2 single crystals by means of Raman spectroscopy and DFT. Four out of eight Raman active modes, two and two , have been observed and assigned. DFT calculations are in a good agreement with experimental results. Temperature dependence of , and mode properties reveals clear fingerprint of spin-phonon coupling, at temperature around 150 K. Furthermore, anomalous behaviour in energies and line widths of observed phonon modes is present in Raman spectra at temperatures around 220 K with the discontinuity also present in the electronic continuum. Its origin still remains an open question, and requests further analysis.
Acknowledgement
The work was supported by the Serbian Ministry of Education, Science and Technological Development under Projects III45018 and OI171005. DFT calculations were performed using computational resources at Johannes Kepler University, Linz, Austria. Materials synthesis was supported by the U.S. Department of Energy, Office of Basic Energy Sciences as part of the Computation Material Science Program (Y.L. and C.P.). Electron microscopy was performed at Jozef Stefan Institute, Ljubljana, Slovenia under Slovenian Research Agency contract P1-0099 (B. V.).
References
- Sivadas et al. (2015) Nikhil Sivadas, Matthew W. Daniels, Robert H. Swendsen, Satoshi Okamoto, and Di Xiao, “Magnetic ground state of semiconducting transition-metal trichalcogenide monolayers,” Phys. Rev. B 91, 235425 (2015).
- Novoselov et al. (2004) K. S. Novoselov, A. K. Geim, S. V. Morozov, D. Jiang, Y. Zhang, S. V. Dubonos, I. V. Grigorieva, and A. A. Firsov, “Electric Field Effect in Atomically Thin Carbon Films,” Science 306, 666–669 (2004).
- Wang et al. (2012) Qing Hua Wang, Kourosh Kalantar-Zadeh, Andras Kis, Jonathan N. Coleman, and Michael S. Strano, “Electronics and optoelectronics of two-dimensional transition metal dichalcogenides,” Nat. Nanotechnol 7, 699 EP – (2012).
- Gong et al. (2017) Cheng Gong, Lin Li, Zhenglu Li, Huiwen Ji, Alex Stern, Yang Xia, Ting Cao, Wei Bao, Chenzhe Wang, Yuan Wang, Z. Q. Qiu, R. J. Cava, Steven G. Louie, Jing Xia, and Xiang Zhang, “Discovery of intrinsic ferromagnetism in two-dimensional van der Waals crystals,” Nature 546, 265 EP – (2017).
- Huang et al. (2017) Bevin Huang, Genevieve Clark, Efrén Navarro-Moratalla, Dahlia R. Klein, Ran Cheng, Kyle L. Seyler, Ding Zhong, Emma Schmidgall, Michael A. McGuire, David H. Cobden, Wang Yao, Di Xiao, Pablo Jarillo-Herrero, and Xiaodong Xu, “Layer-dependent ferromagnetism in a van der Waals crystal down to the monolayer limit,” Nature 546, 270 EP – (2017).
- McGuire et al. (2015) Michael A. McGuire, Hemant Dixit, Valentino R. Cooper, and Brian C. Sales, “Coupling of Crystal Structure and Magnetism in the Layered, Ferromagnetic Insulator CrI3,” Chemistry of Materials 27, 612–620 (2015).
- Zhuang et al. (2015) Houlong L. Zhuang, Yu Xie, P. R. C. Kent, and P. Ganesh, “Computational discovery of ferromagnetic semiconducting single-layer ,” Phys. Rev. B 92, 035407 (2015).
- Lin et al. (2017) G. T. Lin, H. L. Zhuang, X. Luo, B. J. Liu, F. C. Chen, J. Yan, Y. Sun, J. Zhou, W. J. Lu, P. Tong, Z. G. Sheng, Z. Qu, W. H. Song, X. B. Zhu, and Y. P. Sun, “Tricritical behavior of the two-dimensional intrinsically ferromagnetic semiconductor ,” Phys. Rev. B 95, 245212 (2017).
- Casto et al. (2015) L. D. Casto, A. J. Clune, M. O. Yokosuk, J. L. Musfeldt, T. J. Williams, H. L. Zhuang, M.-W. Lin, K. Xiao, R. G. Hennig, B. C. Sales, J.-Q. Yan, and D. Mandrus, “Strong spin-lattice coupling in ,” APL Materials 3, 041515 (2015).
- Lin et al. (2016) Ming-Wei Lin, Houlong L. Zhuang, Jiaqiang Yan, Thomas Zac Ward, Alexander A. Puretzky, Christopher M. Rouleau, Zheng Gai, Liangbo Liang, Vincent Meunier, Bobby G. Sumpter, Panchapakesan Ganesh, Paul R. C. Kent, David B. Geohegan, David G. Mandrus, and Kai Xiao, “Ultrathin nanosheets of : a semiconducting two-dimensional ferromagnetic material,” J. Mater. Chem. C 4, 315–322 (2016).
- Zhu, Jian-Xin and Janoschek, Marc and Chaves, D. S. and Cezar, J. C. and Durakiewicz, Tomasz and Ronning, Filip and Sassa, Yasmine and Mansson, Martin and Scott, B. L. and Wakeham, N. and Bauer, Eric D. and Thompson, J. D. (2016) Zhu, Jian-Xin and Janoschek, Marc and Chaves, D. S. and Cezar, J. C. and Durakiewicz, Tomasz and Ronning, Filip and Sassa, Yasmine and Mansson, Martin and Scott, B. L. and Wakeham, N. and Bauer, Eric D. and Thompson, J. D., “Electronic correlation and magnetism in the ferromagnetic metal ,” Phys. Rev. B 93, 144404 (2016).
- Chen ,Bin and Yang ,JinHu and Wang ,HangDong and Imai ,Masaki and Ohta ,Hiroto and Michioka ,Chishiro and Yoshimura ,Kazuyoshi and Fang ,MingHu (2013) Chen ,Bin and Yang ,JinHu and Wang ,HangDong and Imai ,Masaki and Ohta ,Hiroto and Michioka ,Chishiro and Yoshimura ,Kazuyoshi and Fang ,MingHu, “Magnetic Properties of Layered Itinerant Electron Ferromagnet Fe3GeTe2,” Journal of the Physical Society of Japan 82, 124711 (2013).
- Liu et al. (2017) Yu Liu, V. N. Ivanovski, and C. Petrovic, “Critical behavior of the van der Waals bonded ferromagnet ,” Phys. Rev. B 96, 144429 (2017).
- Deiseroth, Hans - Jorg and Aleksandrov, Krasimir and Reiner, Christof and Kienle, Lorenz and Kremer, Reinhard K. (2006) Deiseroth, Hans - Jorg and Aleksandrov, Krasimir and Reiner, Christof and Kienle, Lorenz and Kremer, Reinhard K., “ and - Two New Layered Transition-Metal Compounds: Crystal Structures, HRTEM Investigations, and Magnetic and Electrical Properties,” European Journal of Inorganic Chemistry 2006, 1561–1567 (2006).
- May et al. (2016) Andrew F. May, Stuart Calder, Claudia Cantoni, Huibo Cao, and Michael A. McGuire, “Magnetic structure and phase stability of the van der Waals bonded ferromagnet ,” Phys. Rev. B 93, 014411 (2016).
- Verchenko, Valeriy Yu. and Tsirlin, Alexander A. and Sobolev, Alexei V. and Presniakov, Igor A. and Shevelkov, Andrei V. (2015) Verchenko, Valeriy Yu. and Tsirlin, Alexander A. and Sobolev, Alexei V. and Presniakov, Igor A. and Shevelkov, Andrei V., “Ferromagnetic Order, Strong Magnetocrystalline Anisotropy, and Magnetocaloric Effect in the Layered Telluride ,” Inorganic Chemistry 54, 8598–8607 (2015).
- Yi et al. (2016) Jieyu Yi, Houlong Zhuang, Qiang Zou, Zhiming Wu, Guixin Cao, Siwei Tang, S A Calder, P R C Kent, David Mandrus, and Zheng Gai, “Competing antiferromagnetism in a quasi-2D itinerant ferromagnet: ,” 2D Materials 4, 011005 (2016).
- Zhang, Yun and Lu, Haiyan and Zhu, Xiegang and Tan, Shiyong and Feng, Wei and Liu, Qin and Zhang, Wen and Chen, Qiuyun and Liu, Yi and Luo, Xuebing and Xie, Donghua and Luo, Lizhu and Zhang, Zhengjun and Lai, Xinchun (2018) Zhang, Yun and Lu, Haiyan and Zhu, Xiegang and Tan, Shiyong and Feng, Wei and Liu, Qin and Zhang, Wen and Chen, Qiuyun and Liu, Yi and Luo, Xuebing and Xie, Donghua and Luo, Lizhu and Zhang, Zhengjun and Lai, Xinchun, “Emergence of Kondo lattice behavior in a van der Waals itinerant ferromagnet, ,” Science Advances 4 (2018), 10.1126/sciadv.aao6791.
- Liu et al. (2018) Yu Liu, Eli Stavitski, Klaus Attenkofer, and C. Petrovic, “Anomalous Hall effect in the van der Waals bonded ferromagnet ,” Phys. Rev. B 97, 165415 (2018).
- Zhuang et al. (2016) Houlong L. Zhuang, P. R. C. Kent, and Richard G. Hennig, “Strong anisotropy and magnetostriction in the two-dimensional Stoner ferromagnet ,” Phys. Rev. B 93, 134407 (2016).
- Tan et al. (2018) Cheng Tan, Jinhwan Lee, Soon-Gil Jung, Tuson Park, Sultan Albarakati, James Partridge, Matthew R. Field, Dougal G. McCulloch, Lan Wang, and Changgu Lee, “Hard magnetic properties in nanoflake van der Waals ,” Nature Communications 9, 1554 (2018).
- Giannozzi et al. (2009) Paolo Giannozzi et al., “Quantum espresso: a modular and open-source software project for quantum simulations of materials,” Journal of Physics: Condensed Matter 21, 395502 (19pp) (2009).
- Blöchl (1994) P. E. Blöchl, “Projector augmented-wave method,” Phys. Rev. B 50, 17953–17979 (1994).
- Kresse and Joubert (1999) G. Kresse and D. Joubert, “From ultrasoft pseudopotentials to the projector augmented-wave method,” Phys. Rev. B 59, 1758–1775 (1999).
- Perdew et al. (1996) John P. Perdew, Kieron Burke, and Matthias Ernzerhof, “Generalized gradient approximation made simple,” Phys. Rev. Lett. 77, 3865–3868 (1996).
- Grimme (2006) Stefan Grimme, “Semiempirical GGA-type density functional constructed with a long-range dispersion correction,” Journal of computational chemistry 27, 1787–1799 (2006).
- Milosavljević et al. (2018) A. Milosavljević, A. Šolajić, J. Pešić, Yu Liu, C. Petrovic, N. Lazarević, and Z. V. Popović, “Evidence of spin-phonon coupling in ,” Phys. Rev. B 98, 104306 (2018).
- Baum et al. (2018) A. Baum, A. Milosavljević, N. Lazarević, M. M. Radonjić, B. Nikolić, M. Mitschek, Z. Inanloo Maranloo, M. Šćepanović, M. Grujić-Brojčin, N. Stojilović, M. Opel, Aifeng Wang, C. Petrovic, Z. V. Popović, and R. Hackl, “Phonon anomalies in FeS,” Phys. Rev. B 97, 054306 (2018).
- Opačić et al. (2016) M. Opačić, N. Lazarević, M. M. Radonjić, M. Šćepanović, Hyejin Ryu, Aifeng Wang, D. Tanasković, C. Petrovic, and Z. V. Popović, “Raman spectroscopy of single crystals near the ferromagnet–paramagnet transition,” Journal of Physics: Condensed Matter 28, 485401 (2016).
- Popović et al. (2014) Z.V. Popović, N. Lazarević, S. Bogdanović, M.M. Radonjić, D. Tanasković, Rongwei Hu, Hechang Lei, and C. Petrovic, “Signatures of the spin-phonon coupling in alloys,” Solid State Communications 193, 51 – 55 (2014).
- Popović et al. (2015) Z. V. Popović, M. Šćepanović, N. Lazarević, M. Opačić, M. M. Radonjić, D. Tanasković, Hechang Lei, and C. Petrovic, “Lattice dynamics of (X=S, Se) compounds,” Phys. Rev. B 91, 064303 (2015).
- Devereaux and Hackl (2007) Thomas P. Devereaux and Rudi Hackl, “Inelastic light scattering from correlated electrons,” Rev. Mod. Phys. 79, 175–233 (2007).
Appendix A: Electron microscopy
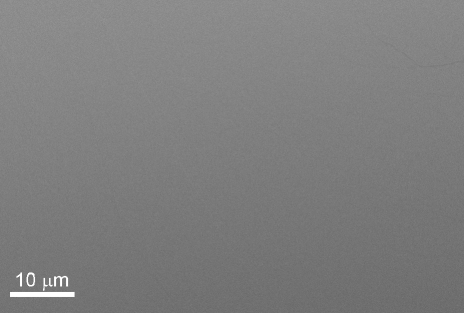
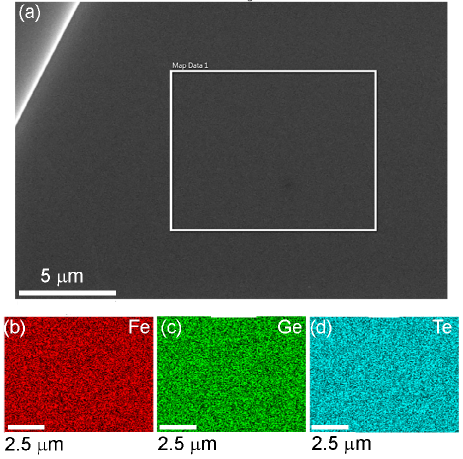
In order to examine the uniformity of Fe3-xGeTe2, Scanning electron microscopy was performed on as-cleaved crystals. It can be seen from Figure A1 that the crystals maintain uniformity for several tens of microns. Furthermore, elemental composition was obtained using EDS mapping, as shown in A2. The atomic percentage, averaged over ten measurements, is 47, 17 and 36% () for Fe, Ge and Te, respectively, with the vacancy content . The maps associated with the selected elements appear homogeneous, as they are all present uniformly with no apparent islands or vacancies.
Appendix B: Data modelling
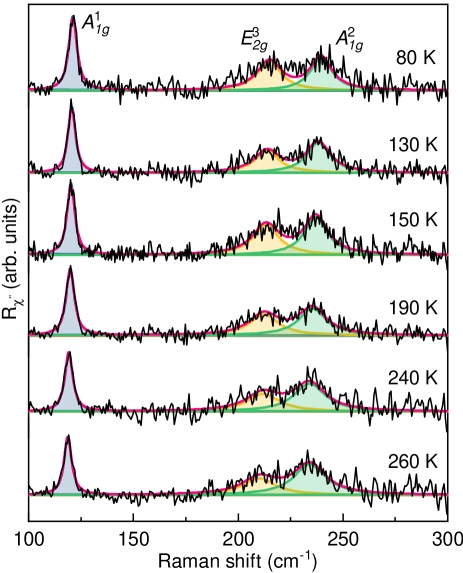
In order to obtain temperature dependence of energies and line widths of observed Fe3-xGeTe2 phonon modes, Raman continuum, shown in coloured lines in Fig. 3 (a), was subtracted for simplicity from the raw Raman susceptibility data (black line). Spectra obtained after subtraction procedure are presented in Fig. A3 (black line) for various temperatures. Because of the finite resolution of the spectrometer and the fact that line shapes of all the observed phonons are symmetric, Voigt line shape ( ) was used for data modelling. Blue, yellow and green lines in Fig. A3 represent fitting curves for , and phonon modes, respectively, whereas overall spectral shape is shown in red line.
Appendix C: Experimental details
Before being placed in a vacuum and cleaved, sample was glued to a copper plate with GE varnish in order to achieve good thermal conductivity and prevent strain effects. Silver paste, as a material with high thermal conductivity, was used to attach the copper plate with the sample to the cryostat. Laser beam spot, focused through the Olympus long range objective of 50 magnification, was approximately 6 m in size, with a power less than 1 mW at the sample surface. TriVista 557 triple spectrometer was used in the subtractive mode, with diffraction grating combination of 1800/1800/2400 groves/mm and the entrance and second intermediate slit set to 80 m, in order to enhance stray light rejection and attain good resolution.
Appendix D: Calculations
| Raman active modes | |||||
|---|---|---|---|---|---|
| Calculations | Experiment (M) | ||||
| Sym. | NM-R | M-R | NM-NR | M-NR | |
| 28.4 | 49.6 | 33.9 | 50.2 | - | |
| 79.2 | 70.2 | 71.7 | 70.3 | - | |
| 115.5 | 121.0 | 100.0 | 122.2 | 89.2 | |
| 151.7 | 139.2 | 131.7 | 137.2 | 121.1 | |
| 225.5 | 206.0 | 194.3 | 209.5 | - | |
| 238.0 | 232.6 | 204.9 | 228.6 | 214.8 | |
| 272.0 | 262.6 | 235.7 | 233.4 | 239.6 | |
| 362.0 | 337.6 | 315.4 | 334.7 | - | |
| Infrared active modes | |||||
| 70.7 | 96.6 | 73.5 | 92.7 | - | |
| 112.5 | 121.2 | 89.4 | 121.6 | - | |
| 206.0 | 162.5 | 183.1 | 153.7 | - | |
| 226.4 | 233.6 | 192.1 | 231.3 | - | |
| 271.8 | 248.6 | 240.8 | 241.0 | - | |
| 361.1 | 336.6 | 314.7 | 334.7 | - | |
In the table AI results of DFT calculations are presented for magnetic (M) and non-magnetic (NM) relaxed, and experimental lattice parameters. For comparison, experimental results are shown in the last column. Since lattice parameters strongly depend on the Fe atoms deficiency, the best agreement with experimental results gives the magnetic non-relaxed solution.