Astrophysical implications of double-layer torsional oscillations in a neutron star crust as a lasagna sandwich
Abstract
In the crust of a neutron star, global torsional oscillations could occur in two elastic layers. The outer and inner layers are composed of spherical and cylindrical nuclei and of cylindrical holes (tubes) and spherical holes (bubbles), respectively, while between these two layers, a phase of slab-like (lasagna) nuclei with vanishingly small elasticity is sandwiched. In this work, we update systematic calculations of the eigenfrequencies of the fundamental oscillations in the inner layer by newly allowing for the presence of tubes. We find that the frequencies still depend strongly on the slope parameter of the nuclear symmetry energy, , while being almost independent of the incompressibility of symmetric nuclear matter. We also find that the fundamental frequencies in the inner layer can become smaller than those in the outer layer because the tube phase has a relatively small shear modulus and at the same time dominates the inner layer in thickness. As a result, we can successfully explain not only the quasi-periodic oscillations originally discovered in the observed X-ray afterglow of the giant flare of SGR 1806–20 but also many others recently found by a Bayesian procedure.
keywords:
stars: neutron – equation of state – stars: oscillations1 Introduction
Neutron stars, which are stellar remnants of core-collapse supernova explosions that occur at the last moment of massive stars, are composed of matter under extreme conditions, namely, such high density and large neutron excess as to be very difficult to realize on earth. In fact, the density inside the star can significantly exceed the normal nuclear density under strong gravitational field, while the neutron excess can become extremely large under charge neutral and beta equilibrium conditions (Haensel, Potekhin & Yakovlev, 2007). Thus, observations of neutron stars are expected to help us to probe the physics under such extreme conditions, particularly given the difficulty in terrestrial laboratories in obtaining relevant information about matter in neutron stars. Even at the present time when information from two solar mass neutron stars and a binary neutron star merger is available (Abbott et al., 2018), however, the equation of state (EOS) of neutron star matter and hence the neutron star structure are still uncertain.
In spite of the uncertainties in the EOS of neutron star matter, a schematic view of neutron star structure can be drawn as follows. Under the envelop composed mostly of a liquid metal, the matter is considered to have a lattice structure via the inter-ionic Coulomb interaction. This crystalline region is referred to as a crust. In the deepest region of the crust, below which the matter becomes uniform and constitutes a core, nuclei present are so closely packed that the nuclear shape, which is normally roughly spherical, could turn to cylinder (“spaghetti”), slab (“lasagna”), tube or cylindrical hole (“ani-spaghetti”), and bubble or spherical hole (“Swiss cheese”) as the density increases. Such exotic shapes are often called nuclear pasta (Lorenz et al., 1993; Oyamatsu, 1993). This nuclear pasta is embedded in a gas of dripped neutrons and thus can be viewed as a liquid-gas mixed phase of nuclear matter. Since the crystalline order of the phases of cylindrical nuclei, slab-like nuclei, and tubes is low-dimensional, furthermore, these phases are liquid crystals (Pethick & Potekhin, 1998). Interestingly, it is known that the appearance of pasta structures depends strongly on the slope parameter of nuclear symmetry energy (Oyamatsu & Iida, 2007), of which the determination is one of the important problems in nuclear physics (Li, 2017). Observational evidence for the presence of nuclear pasta would thus be highly desired.
To extract information of neutron star interiors from observations, asteroseismology is a very powerful technique, just like the seismology for the Earth and the helioseismology for the Sun. That is, since the characteristic frequencies observed from neutron stars may well be more or less related to the interior properties, one could obtain the interior information by somehow observing such frequencies, identifying them as eigenfrequencies of some global oscillation modes, and then solving an inverse problem. Such frequencies could be obtained from gravitational waves that would radiate from the interiors and reach us due to the strong permeability. In fact, many possibilities of extracting the neutron star properties via direct detection of the gravitational waves have been proposed (e.g., Andersson & Kokkotas (1996); Sotani, Tominaga & Maeda (2001); Sotani, Kohri & Harada (2004); Sotani et al. (2011); Doneva et al. (2013)). Study in this direction is so promising as to make us expect to obtain important information on the neutron star interiors in the near future.
As long as neutron star asteroseismology is concerned, quasi-periodic oscillations (QPOs) in X-rays have been only known electromagnetic signals of global oscillations. Up to now, three giant flares have been observed from different soft gamma repeaters (SGRs). In two of them, namely, SGR 1900+14 and SGR 1806-20, several QPOs have been found in the X-ray afterglow following the respective giant flare, where the observed QPO frequencies are in the range of tens of Hz up to kHz (Israel et al., 2005; Strohmayer & Watts, 2005, 2006). In SGR 1806-20, another QPO, i.e., the 57 Hz QPO, was also found from the shorter and less energetic recurrent 30 bursts (Huppenkothen et al., 2014). Since the central object in the SGR is considered to be a strongly magnetized neutron star, the observed QPOs may well come from the global oscillations of the neutron star. Given that typically, the frequencies induced by acoustic oscillations in the star are around kHz (Van Horn et al., 1995), one has difficulty in identifying the QPOs of frequency lower than Hz as the acoustic oscillations. In practice, it is generally accepted that the mechanisms for explaining such lower QPO frequencies are either the crustal torsional oscillations, the magnetic oscillations, or the coupled modes (magneto-elastic oscillations).
However, calculations of the magnetic oscillation frequencies suffer several uncertainties. The geometry and strength distribution of the internal magnetic fields are poorly known, although the magnetic oscillations depend strongly on such magnetic structure (Gabler et al., 2013). In addition, one has to take into account the uncertain core EOS if the magnetic fields penetrate into the core region. To avoid such uncertainties, in this study we focus on the crustal torsional oscillations by ignoring the coupling to the magnetic oscillations. Note that even in the absence of this coupling, the calculated eigenfrequencies of the crustal torsional oscillations are still controlled by several physical parameters that are relatively well-known but not yet determined, i.e., such crustal properties as the shear modulus and the superfluid density, as well as the star’s radius and mass . By identifying the observed QPO frequencies as such eigenfrequencies, therefore, one can manage to constrain the crustal properties (Samuelsson & Andersson, 2007; Steiner & Watts, 2009; Gearheart et al., 2011; Sotani et al., 2012; Passamonti & Andersson, 2012; Sotani et al., 2013a, b; Sotani, 2014, 2016; Sotani, Iida & Oyamatsu, 2016, 2017a, 2018).
In most of these earlier studies of the crustal torsional oscillations, it was assumed that only the phase of spherical nuclei oscillates quasiperiodically, while the pasta phases remain free from oscillations. Since most of the pasta phases are liquid crystals, however, their elastic properties could be responsible for global oscillations. In contrast to a naive view that the shear modulus decreases continuously in the pasta phases and eventually vanishes at the crust-core boundary, which was adopted in Sotani (2011); Passamonti & Pons (2016), we have recently attempted to introduce a more realistic effect of the pasta elasticity into the torsional oscillations (Sotani, Iida & Oyamatsu, 2017a, 2018). In this attempt, it was noted that for slab-like nuclei, the transverse shear response vanishes for long-wavelength perturbations (de Gennes & Prost, 1993; Pethick & Potekhin, 1998). That is, within the linear analysis, the phase of slab-like nuclei behaves as a fluid. This indicates that the torsional oscillations that could be excited within the phases of spherical and cylindrical nuclei would be separable from those within the phases of tubes and bubbles.
In our recent study (Sotani, Iida & Oyamatsu, 2018), we calculated eigenfrequencies of the torsional oscillations that occur inside the phases of spherical and cylindrical nuclei and showed that the QPO frequencies observed in SGR 1806-20 and SGR 1900+14, except for the 26 Hz QPO observed in SGR 1806-20, can be explained in terms of such oscillations. Additionally, since the torsional oscillations are supposed to be confined within a layer composed of spherical and cylindrical nuclei, we discussed the overtone torsional oscillations, which have radial nodes in such a manner that is dependent on the thickness of the layer. By identifying the kHz QPO observed in SGR 1806-20 as the 1st overtone torsional oscillation, we attempted to constrain the incompressibility of symmetric nuclear matter for given and . By combining the resultant constraint with the constraint from empirical data for nuclear giant monopole resonances, furthermore, not only did we manage to constrain and , but we obtained a more severe constraint on the slope parameter of nuclear symmetry energy.
Even before our previous work (Sotani, Iida & Oyamatsu, 2018), we suggested the possibility that the 26 Hz QPO in SGR 1806-20 stems from torsional oscillations that occur only in a deeper layer of the crust than the slab phase, i.e., in a layer of composed of tubes and bubbles. As a first step (Sotani, Iida & Oyamatsu, 2017a), we focused on the torsional oscillations in the bubble phase alone by simply assuming zero elasticity in the tube phase. It was noted that the lowest fundamental frequency in the bubble phase could explain the 26 Hz QPO because the enthalpy density is relatively small in the bubble phase. In this work, by taking into account the effect of the tube phase, we will give a more realistic evaluation of the eigenfrequencies of torsional oscillations that occur in the tube-bubble layer and thereby examine whether one could still explain the 26 Hz QPO. Within the same framework, moreover, we will discuss possible identification of newly found QPOs in SGR 1806-20 by a Bayesian procedure (Miller, Chirenti & Strohmayer, 2018).
In Sec. 2, we summarize a model for the neutron star crust that is constructed in such a way as to depend on the EOS of nuclear matter. Section 3 is devoted to description of the shear modulus that is consistent with the crust model summarized in Sec. 2. In Sec. 4, we calculate the eigenfrequencies of fundamental shear torsional oscillations in two elastic layers within the crust and compare them with the low-lying QPO frequencies observed from SGR 1806–20. Finally, concluding remarks and details of such comparison are given in Sec. 5 and Appendix A, respectively. Throughout the text, we use units in which , where and denote the speed of light and the gravitational constant, respectively.
2 Model for neutron star crust
We start with construction of a neutron star crust in a spherically symmetric configuration. This is because for neutron stars observed as SGRs the magnetic and rotational energies are much smaller than the gravitational binding energy (Kouveliotou et al., 1998; Hurley et al., 1999). Then, the crust can be constructed by integrating the Tolman-Oppenheimer-Volkoff (TOV) equation together with the EOS of matter in the crust. Correspondingly, the metric is given in spherical polar coordinates as
| (1) |
where is directly connected to the mass function, , via .
It is advantageous that we dispense with the core EOS, which is significantly uncertain. In integrating the TOV equation, therefore, we set the values of and and then go inward from the star’s surface down to the crust-core boundary (Iida & Sato, 1997).
To construct the crust in equilibrium, one has to prepare the EOS of crustal matter that is in beta equilibrium and globally charge neutral. This EOS can in turn be constructed in such a way that is dependent on the bulk energy of zero temperature nuclear matter per baryon, which can generally be expanded in the vicinity of the saturation point of symmetric nuclear matter with respect to the baryon number density () and the neutron excess () (see Lattimer (1981)):
| (2) |
Here and are the bulk energy and the incompressibility of the symmetric nuclear matter at the saturation density of , while and are the parameters that characterize the nuclear symmetry energy, , i.e., and at . Among these five saturation parameters, , , and are fairly well constrained from empirical data for masses and charge radii of stable nuclei. On the other hand, the constraint on the remaining two parameters, and , are relatively more difficult to obtain, because these are related to the density change from . In this study, therefore, we adopt the phenomenological EOSs of crustal matter that were constructed by Oyamatsu & Iida (2003, 2007) in such as way as to depend on and (hereafter refereed to as OI-EOSs). These EOSs allow us to systematically examine the dependence of the crustal oscillations on and .
Let us briefly summarize the OI-EOSs. The expression for the energy of bulk nuclear matter used in the OI-EOSs was constructed in a Pade form with respect to the density and in a parabolic approximation with respect to the neutron excess, and fitted to empirical data for masses and charge radii of stable nuclei within the Thomas-Fermi approach (Oyamatsu & Iida, 2003). Consequently, the saturation parameters in Eq. (2) were given for more than 200 sets of and . Then, within the Wigner-Seitz approximation for five nuclear shapes, i.e., sphere, cylinder, slab, tube, and bubble, the equilibrium nuclear shape and size in the crust were determined as a function of by optimizing the energy density functional in the presence of a neutralizing uniform electron gas and a gas of dripped neutrons (Oyamatsu & Iida, 2007). In this study we confine ourselves to several sets of the saturation parameters, which cover not only typical but also extreme cases as in Table 1. We remark that the typical values are empirically deduced as, e.g., MeV (Newton et al., 2014) and MeV (Khan & Margueron, 2013) or MeV (Stone, Stone & Moszkowski, 2014).
Since we focus on the torsional oscillations that are trapped inside the phases of tubes and bubbles in this study, we also show the transition densities from the slab to the tube phase (S-CH), from the tube to the bubble phase (CH-SH), and from the bubble to the uniform phase (SH-U) in Table 1. As already predicted by Oyamatsu & Iida (2007), the pasta structure is more difficult to appear for larger . In fact, some of the pasta structures are predicted to disappear for the cases with and 146.1 MeV, which are denoted by the asterisk in the column of in Table 1. We remark that the thickness of each pasta phase strongly depends on not only and but also the stellar compactness () (Sotani, Iida & Oyamatsu, 2017b). We also remark that the transition densities tabulated in Table 1 are not obtained at constant pressure; in a real situation, the density jumps at the transition pressures, but this jump is tiny because the transitions are of weak first order.
| (MeV) | (MeV) | S-CH (fm-3) | CH-SH (fm-3) | SH-U (fm-3) |
|---|---|---|---|---|
| 180 | 17.5 | 0.09811 | 0.10206 | 0.10321 |
| 180 | 31.0 | 0.08739 | 0.09000 | 0.09068 |
| 180 | 52.2 | 0.07733 | 0.07885 | 0.07899 |
| 230 | 23.7 | 0.09515 | 0.09817 | 0.09866 |
| 230 | 42.6 | 0.08411 | 0.08604 | 0.08637 |
| 230 | 73.4 | 0.07284 | 0.07344 | 0.07345 |
| 360 | 40.9 | 0.09197 | 0.09379 | 0.09414 |
| ∗360 | 76.4 | 0.07890 | — | 0.07918∗1 |
| ∗360 | 146.1 | — | — | 0.06680∗2 |
In considering the torsional oscillations, furthermore, the effective enthalpy, , that participates in the oscillations is another important factor, because the shear velocity is given by , where is the shear modulus to be discussed in the next section, and because the fundamental frequency of the torsional oscillations is proportional to (Hansen & Cioffi, 1980). In practice, for the torsional oscillations in the tube and bubble phases, the effective enthalpy can be expressed as
| (3) |
where denotes the number of neutrons inside a single tube or bubble, is the total nucleon number in a Wigner-Seitz cell, and denotes the local enthalpy given by with the energy density () and pressure (). The coefficient is a parameter that characterizes a participant ratio, i.e., how much ratio of nucleons outside the tube or bubble comove with it non-dissipatively via entrainment, namely, Bragg scattering off the corresponding lattice. Note that the non-participant nucleons behave as a superfluid. There are two extreme cases: All the nucleons inside the Wigner-Seitz cell contribute to the effective enthalpy for (maximum enthalpy), while no nucleons outside the tube or bubble do so for (minimum enthalpy). In general, has an intermediate value that depends on the band structure and pairing gap for the nucleons outside the tube or bubble and hence changes with density. In this study, we simply consider only the extreme cases in which is constant at 1 or 0 in the whole region of the tube and bubble phases. We remark that the value of in the bubble phase is predicted to be at fm-3, according to the band calculations by Chamel (2012). Incidentally, we naively assume that all the neutrons comove with the interface of the tube or bubble, just like bubbles in boiled water. This might not be always the case with the superfluid system considered here in which a non-dissipative hydrodynamic flow could arise in such a way that some neutrons go across the interface (Martin & Urban, 2016).
3 Shear modulus
Let us now proceed to the shear modulus, , which is associated with the distortion energy to be produced by adding long-wavelength transverse shear deformation of each of the five phases of inhomogeneous nuclear matter. The distortion energy comes mainly from the change of the Coulomb energy due to the deformation, and a particular form of the corresponding shear modulus was adopted in our previous studies except for the tube phase. In the case of a bcc Coulomb lattice composed of spherical nuclei, the effective shear modulus was originally derived as
| (4) |
where , , and denote the ion number density, the charge number of the nuclei, and the radius of the Wigner-Seitz cell, i.e., (Ogata & Ichimaru, 1990; Strohmayer et al., 1991). Note that this was obtained via Monte Carlo method by averaging over all directions of the wave vector of the distortion with the assumption that each nucleus is a point particle. Recently, this shear modulus has been modified by taking into account the effect of electron screening (Kobyakov & Pethick, 2013) and the effect of polycrystalline nature (Kobyakov & Pethick, 2015). In this study, however, we adopt the traditional formula given by Eq. (4) for simplicity.
The elastic properties in the rod and slab phases have been discussed by de Gennes & Prost (1993); Pethick & Potekhin (1998). The shear modulus in the phase of cylindrical nuclei was derived through the deformation energy to be produced by adding a two-dimensional displacement perpendicular to the elongated direction of the equilibrium configuration of cylindrical nuclei. In practice, it can be effectively expressed as
| (5) |
where and denote the Coulomb energy per volume of a Wigner-Seitz cell and the volume fraction of cylindrical nuclei, respectively, and the coefficient of comes from the average over all directions between the wave-vector of the distortion and the elongated direction under the assumption that crystallites of cylindrical nuclei randomly point. We remark that in the liquid drop model is given by
| (6) |
where and are the proton charge density and the proton radius of a cylindrical liquid drop (Ravenhall, Pethick & Wilson, 1983). By following a similar line of argument, it was shown that the deformation energy in the phase of slab-like nuclei becomes of higher order with respect to the displacement. That is, this phase behaves as a fluid within the linear response. This is the reason why one can consider the torsional oscillations inside the phases of spherical and cylindrical nuclei separately from those inside the phases of tubes and bubbles.
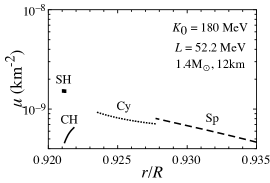
The shear modulus in the tube (bubble) phase, i.e., (), can be derived in a similar fashion to that in the phase of cylindrical (spherical) nuclei, because the liquid crystalline structure of tubes (bubbles) is the same as that in the phase of cylindrical (spherical) nuclei. In this study, therefore, we adopt Eq. (5) for the tube phase and Eq. (4) for the bubble phase by properly replacing the relevant quantities in these formulae: In the tube phase, in Eq. (5) (including ) is replaced by the volume fraction of a gas of dripped neutrons, while in the bubble phase and are replaced by the number density of bubbles and the effective charge number of a bubble, respectively (Sotani, Iida & Oyamatsu, 2017a). In practice, is given by , with the volume of the bubble, , and the effective charge number density of the bubble, , defined by the difference of the charge number density inside the bubble from that outside the bubble, i.e., with the proton number density outside the bubble () and the number density of a uniform electron gas ().
 |
 |
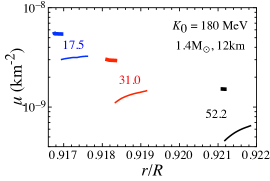
In Fig. 1, we illustrate the profile of the shear modulus inside the tube and bubble phases for neutron star models constructed from the first three sets of the OI-EOSs listed in Table 1. From this figure, one can observe that the shear modulus becomes discontinuous at the transition between the tube and bubble phases, which is similar to the case of the transition between the phases of spherical and cylindrical nuclei (Sotani, Iida & Oyamatsu, 2018). In addition, it is to be noted that the shear modulus in the tube phase can decrease as the density increases and that this tendency becomes stronger for larger . This tendency may well come from the decrease of the volume fraction of a gas of dripped neutrons with density (e.g., Watanabe & Iida (2003)).
4 Torsional oscillation frequencies and comparison with QPOs
We now turn to evaluations of the eigenfrequencies of fundamental torsional oscillations in the sphere-cylinder and tube-bubble layers of the crust of a neutron star. To this end, we start with the perturbation equation in a spherical coordinate system, which is given by linearizing the relativistic equation of motion that determines the torsional oscillations (Schumaker & Thorne, 1983; Sotani, Kokkotas & Stergioulas, 2007) as
| (7) |
where denotes the Lagrangian displacement in the direction, while is the effective enthalpy given by Eq. (3). With the appropriate boundary conditions, the problem to solve becomes an eigenvalue problem, where is the eigenvalue. Then, the eigenfrequency of the torsional oscillations is given by . As for the boundary conditions relevant to the torsional oscillations that are excited inside the tube and bubble phases, there are two boundaries, namely, the boundary between the bubble phase and uniform matter, which corresponds to the inner boundary, and the boundary between the slab and tube phases, which corresponds to the outer boundary. In practice, one has to impose the zero-traction conditions at the inner and outer boundaries, i.e., . In addition, one has to impose the junction condition at the boundary between the tube and bubble phases, where the traction should be continuous, i.e.,
| (8) |
 |
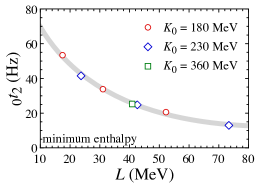 |
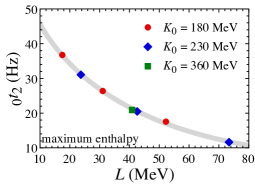
In Fig. 2, we plot the fundamental frequencies of torsional oscillations in the tube and bubble phases that are calculated for the neutron star models with and km, with various EOS parameter sets shown in Table 1, and with the maximum and minimum enthalpies ( and 0). From this figure, one can observe that the frequency depends only weakly on , but shows a significant sensitivity to . In fact, we find that the fundamental frequencies can be well fitted as a function of via
| (9) |
where , , and are the adjustable parameters that depend on and as well as the value of . The obtained fitting [Eq. (9)] is also shown in Fig. 2. We remark that this fitting has a different functional form from that obtained for the fundamental frequencies of crustal torsional oscillations in the phases of spherical and cylindrical nuclei (Sotani, Iida & Oyamatsu, 2018). We also remark that the fundamental frequency in the tube and bubble phases can be smaller than that in the phases of spherical and cylindrical nuclei and that the fundamental frequencies with general values of can also be well fitted in the same functional form:
| (10) |
with a different set of the adjustable parameters , , and . Hereafter we will thus attempt to identify the observed QPO frequencies by using the fitting formula (10) for the tube-bubble layer, in addition to the formula given in Sotani, Iida & Oyamatsu (2018) for the sphere-cylinder layer.
Note that the obtained fundamental frequencies in the tube-bubble layer are generally lower than those obtained in our earlier analysis by assuming that only the bubble phase is oscillating (Sotani, Iida & Oyamatsu, 2017a). This tendency is more significant for larger values of . This is partly because for larger , the bubble phase is less likely to appear, as shown in Table 1, and partly because the shear modulus and hence the shear velocity is relatively small in the tube phase, as shown in Fig. 1. As we shall see later, therefore, the 26 Hz QPO observed from SGR 1806-20 is identified as the fundamental torsional oscillation in the tube-bubble layer, in contrast to our earlier analysis (Sotani, Iida & Oyamatsu, 2017a) in which it was identified as the fundamental torsional oscillation.
Up to now, we have already done many trials to identify the QPOs observed in SGR 1806-20 and SGR 1900+14 as the crustal torsional oscillations. As long as we adopt the QPO frequencies derived in the conventional non-Bayesian analyses of RXTE data for the X-ray afterglows of the giant flares and the recurrent X-ray outbursts, such identification has worked out relatively well (Sotani et al., 2012, 2013a, 2013b; Sotani, Iida & Oyamatsu, 2016, 2017a, 2018). In fact, the observed QPOs, except for the 26 Hz QPO in SGR 1806-20, can be identified as the torsional oscillations inside the phases of spherical and cylindrical nuclei in such a way that the QPOs of frequencies lower than Hz correspond to the fundamental oscillations with various values of , while the higher QPOs observed in SGR 1806-20 correspond to the overtones (Sotani, Iida & Oyamatsu, 2018). In this case, since it is still uncertain how much fraction of dripped neutrons in the phase of cylindrical nuclei would be locked to the motion of protons in the nuclei, we introduced a parameter , where and respectively denote the number of dripped neutrons outside the cylindrical nuclei and the number of a superfluid part of the dripped neutrons that behave independently of the oscillations, and examined the extreme cases with and 1. We remark that all (none) of the dripped neutrons outside the cylindrical nuclei participate in the oscillations for . We also remark that for the corresponding value of in the phase of spherical nuclei, we adopt the results by Chamel (2012), which are based on the band theory.
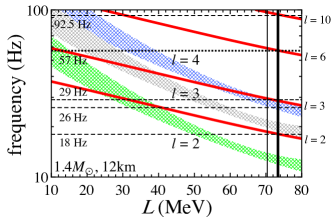
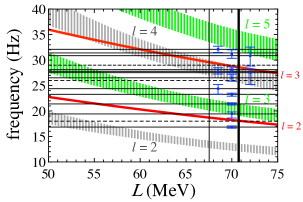
Let us now illustrate how the newly examined torsional oscillations in the tube-bubble layer could be accommodated to the QPO observations of frequencies lower than 100 Hz, including 26 Hz, for typical - sets of the stellar models. For and km, such illustration can be seen from Fig. 3, in which the 18, 29, 57, and 92.5 Hz QPOs in SGR 1806-20 are as usual identified as the , 3, 6, and 10 fundamental frequencies in the sphere-cylinder layer, whereas the 26 Hz QPO, which is difficult to explain in terms of the oscillation in the sphere-cylinder layer, can reasonably be identified as the fundamental frequency in the tube-bubble layer. We remark that the optimal value of for explaining the observed low-lying QPOs ranges between 70.4 and 73.4 MeV for neutron stars with and km.
 |
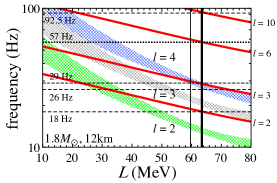 |
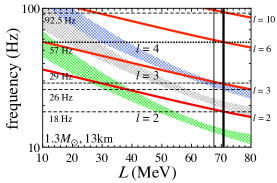
We then examine whether or not the above-mentioned identification, which strictly holds for , still works out for other sets of . For neutron star models with and , we again calculate the eigenfrequencies of the double-layer torsional oscillations, as shown in Fig. 4. We find that the 18, 29, 57, and 92.5 Hz QPOs in SGR 1806-20 can be still consistent with the , and 10 fundamental frequencies in the sphere-cylinder layer for such a range of the optimal as 67.5–70.8 MeV and 59.6–63.5 MeV, respectively. This shift of the optimal could open up an opportunity of selecting and/or because the dependence of the fundamental frequencies in the sphere-cylinder layer is different from that in the tube-bubble layer. In fact, one can observe the tendency that the more massive neutron star, the more difficult to explain the 26 Hz QPO in terms of the fundamental oscillation in the tube-bubble layer, as long as we adopt the optimal value of that enables us to identify the 18, 29, 57, and 92.5 Hz QPOs as the oscillations in the sphere-cylinder layer. Note that the fundamental frequencies scale as both in the tube-bubble and sphere-cylinder layers, implying that is not constrained in the present approach. We can thus conclude that light neutron star models are favored over heavy ones in our identification. Incidentally, the case is consistent with the neutron star models considered to be relevant as a result of the comparison of the constraint on , which is obtained by assuming that the lowest overtone frequency in the sphere-cylinder layer is equal to the QPO frequency of 626.5 Hz observed from SGR 1806-20, with the terrestrial constraint on (Sotani, Iida & Oyamatsu, 2018). Furthermore, the case is consistent with the mass and radius formulas for low-mass neutron stars (Sotani et al., 2014), given the optimal value of MeV, and also with the constraint on the mass and radius of each of the merging binary neutron stars (Abbott et al., 2018).
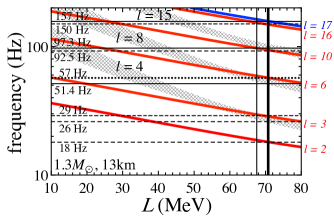
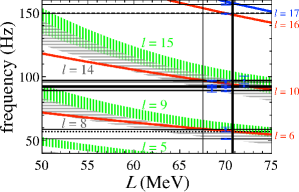
Thanks to the smaller shear modulus in the tube phase, which leads to the smaller fundamental frequencies in the tube-bubble layer than those in the sphere-cylinder layer, we have a chance to explain not only the originally discovered QPOs but also the QPOs newly found by a Bayesian procedure, e.g., the 51.4, 97.3, and 157 Hz QPOs in SGR 1806-20 (Miller, Chirenti & Strohmayer, 2018)111In appendix A, we tabulate a possible correspondence between the crustal torsional oscillations and all the 26 QPOs shown in Table 1 in Miller, Chirenti & Strohmayer (2018).. In practice, we illustrate the identification of these three QPOs for the neutron star models with and km in Fig. 5. As already shown in Sotani, Iida & Oyamatsu (2018), the frequencies of 18, 29, 57, 92.5, and 150 Hz can be identified as the , 3, 6, 10, and 16 fundamental frequencies in the sphere-cylinder layer. In a similar way, we find that the newly found QPO of 157 Hz can also be identified as the fundamental frequency, while the newly found QPOs of 51.4 and 97.3 Hz can be identified as the fundamental oscillations in the tube-bubble layer, as is the case with the 26 Hz QPO, in such a way that 26, 51.4, and 97.3 Hz correspond to the , 8, and 15 fundamental oscillations in the tube-bubble layer.
5 Conclusion
We have calculated the eigenfrequencies of the torsional oscillations in the tube-bubble layer, in contrast to our previous work in which we calculated those only in the bubble layer, and successfully identified the newly found QPOS as the fundamental oscillations either in the tube-bubble or sphere-cylinder layer. In the course of the calculations, we find that the shear modulus, which characterizes the torsional oscillations, decreases in the tube phase as the slope parameter increases. As a result, the fundamental frequencies in the tube-bubble layer can become smaller than those in the sphere-cylinder layer. We also find that the fundamental frequencies in the tube-bubble layer can be parameterized as a function of , and that the dependence on is different from that obtained for the fundamental frequencies in the sphere-cylinder layer. Remarkably, such a different dependence on helps us to explain not only the QPO frequencies originally discovered in SGR 1806-20 but also those newly found in the same object by a Bayesian procedure in terms of the eigenfrequencies of the fundamental torsional oscillations either in the tube-bubble or sphere-cylinder layer of a relatively low mass neutron star constructed from the EOS of MeV. We also remark that such a neutron star model and the suitable value of are consistent with the mass and radius formulas of low-mass neutron stars and the constraint from the gravitational waves from the neutron star binary merger, GW170817.
As a possible extension of this study, it would be of interest to analyze the QPO widths, which could give us information of the internal magnetic structure via possible coupling of the crustal torsional oscillations with the Alfvén continuum in the core (Miller, Chirenti & Strohmayer, 2018). Generally, magnetars are considered to have a toroidal field that is by an order of magnitude higher than the poloidal field. The question of whether or not this picture is relevant might be possibly answered.
This work was supported in part by Grants-in-Aid for Scientific Research through Grant Nos. 17K05458, 18H01211, and 18H05406 provided by Japan Society for the Promotion of Science (JSPS).
Appendix A Possible identifications of newly found QPOs as the crustal torsional oscillations
In this Appendix, we attempt overall identifications of the 26 QPOs in SGR 1806-20 newly found by a Bayesian analysis that adopts the signals with Bayes factors larger than 1000 and frequency widths less than 10 Hz as QPOs (Miller, Chirenti & Strohmayer, 2018), together with the six QPOs originally discovered in SGR 1806-20, as the crustal torsional oscillations. Although the originally discovered QPOs are expected to be more robust than those newly found by the Bayesian procedure, it would be convincing if most of the newly found 26 QPOs could also be identified as the fundamental torsional oscillations with various values of that are excited either in the sphere-cylinder layer or in the tube-bubble layer. The comparison between the QPO frequencies and the fundamental frequencies of the crustal torsional oscillations is shown in Fig. 6. Most of the newly found QPOs, except for a few lowest-lying ones, turn out to be reasonably identifiable, as shown in Table 2.
In Table 2, we also list the frequency widths, , given by Strohmayer & Watts (2006); Huppenkothen et al. (2014); Miller, Chirenti & Strohmayer (2018) in the second column, where the values of more than 1.5 Hz among the newly found QPOs are shown in boldface. One can observe from this table that all the QPOs with relatively large frequency widths are identifiable as the torsional oscillations in the tube-bubble layer. This might suggest that the torsional oscillations in such a deep region of the crust are easy to undergo Landau damping by coupling with the neighboring magnetic oscillations in the core.
In addition, some of the newly found QPOs, which are rather difficult to identify, are marked with the question mark in Table 2. These are all low-lying and could be marginally identifiable as shown in the table. As an exception, the 23.26 Hz QPO seems to be unidentifiable within our framework. Moreover, we should remark that the possible presence of the 9.2 Hz QPO in SGR 1806-20 was deduced from another Bayesian analysis (Pumpe et al., 2018), which is in fact difficult to understand within our framework. For future research involved, it is interesting to note that these two QPOs, of which the origin needs to be clarified if any, have a frequency (23.26 Hz) that is almost twice as high as the fundamental frequency in the tube-bubble layer and a frequency (9.2 Hz) that is almost half as high as the fundamental frequency in the sphere-cylinder layer.
 |
 |
| QPO (Hz) | (Hz) | SP+C | CH+SH |
|---|---|---|---|
| 18 | |||
| 26 | |||
| 29 | |||
| 57 | 4.4 | ||
| 92.5 | |||
| 150 | |||
| 16.83 | 0.51 | (?) | |
| 19.42 | 3.42 | ||
| 21.38 | 0.51 | (?) | |
| 23.26 | 0.51 | ? | ? |
| 24.38 | 4.19 | (?) | |
| 26.51 | 2.03 | ||
| 27.52 | 1.28 | ||
| 27.78 | 1.24 | ||
| 28.11 | 1.38 | ||
| 30.85 | 5.43 | ||
| 31.19 | 1.90 | ||
| 32.12 | 1.93 | ||
| 51.40 | 0.52 | ||
| 58.81 | 5.36 | () | |
| 88.90 | 0.73 | ||
| 89.51 | 4.78 | ||
| 91.58 | 1.14 | ||
| 92.09 | 0.82 | ||
| 92.47 | 0.69 | ||
| 92.49 | 0.71 | ||
| 93.21 | 0.50 | ||
| 95.90 | 3.74 | ||
| 96.82 | 0.60 | ||
| 97.31 | 5.94 | ||
| 149.41 | 0.79 | ||
| 156.59 | 1.14 |
References
- Abbott et al. (2018) Abbott B. P. et al., 2018, Phys. Rev. Lett., 121, 161101
- Andersson & Kokkotas (1996) Andersson N., Kokkotas K. D., 1996, Phys. Rev. Lett., 77, 4134
- Chamel (2012) Chamel N., 2012, Phys. Rev. C, 85, 035801
- de Gennes & Prost (1993) de Gennes P. G., Prost J., The Physics of Liquid Crystals, Oxford Univ. Press, Oxford
- Doneva et al. (2013) Doneva D. D., Gaertig E., Kokkotas K. D., Krüger C., 2013, Phys. Rev. D, 88, 044052
- Gabler et al. (2013) Gabler M., Cerdá-Durán P., Font J. A., Muller E., Stergioulas N., 2013, MNRAS, 430, 1811
- Gearheart et al. (2011) Gearheart M., Newton W. G., Hooker J., Li B. A., 2011, MNRAS, 418, 2343
- Hansen & Cioffi (1980) Hansen C., Cioffi D.F, 1980, ApJ, 238, 740
- Haensel, Potekhin & Yakovlev (2007) Haensel P., Potekhin A. Y., Yakovlev D. G., Neutron Stars 1: Equation of State and Structure, Springer, New York.
- Huppenkothen et al. (2014) Huppenkothen D., Heil L. M., Watts A. L., Göğüş E., 2014, ApJ, 795, 114
- Hurley et al. (1999) Hurley K. et al., 1999, Nature, 397, L41
- Iida & Sato (1997) Iida K., Sato K., 1997, ApJ, 477, 294
- Israel et al. (2005) Israel G. et al., 2005, ApJ, 628, L53
- Khan & Margueron (2013) Khan E., Margueron J., 2013, Phys. Rev. C, 88, 034319
- Kobyakov & Pethick (2013) Kobyakov D., Pethick C. J., 2013, Phys. Rev. C, 87, 055803
- Kobyakov & Pethick (2015) Kobyakov D., Pethick C. J., 2015, MNRAS, 449, L110
- Kouveliotou et al. (1998) Kouveliotou C. et al., 1998, Nature, 393, L235
- Lattimer (1981) Lattimer J. M., 1981, Annu. Rev. Nucl. Part. Sci., 31, 337
- Li (2017) Li B. A., 2017, Nucl. Phys. News, 27, 7
- Lorenz et al. (1993) Lorenz C. P., Ravenhall D. G., Pethick C. J., 1993, Phys. Rev. Lett., 70, 379
- Martin & Urban (2016) Martin, N., Urban M. 2016, Phys. Rev. C 94, 065801
- Miller, Chirenti & Strohmayer (2018) Miller M. C., Chirenti C., Strohmayer T. E., arXiv:1808.09483
- Newton et al. (2014) Newton W. G., Hooker J., Gearheart M., Murphy K., Wen D. H., Fattoyev F. J., Li B. A., 2014, Eur. Phys. J. A, 50, 41
- Ogata & Ichimaru (1990) Ogata S., Ichimaru S., 1990, Phys. Rev. A, 42, 4867
- Oyamatsu (1993) Oyamatsu K., 1993, Nucl. Phys. A, 561, 431
- Oyamatsu & Iida (2003) Oyamatsu K., Iida K., 2003, Prog. Theor. Phys., 109, 631
- Oyamatsu & Iida (2007) Oyamatsu K., Iida K., 2007, Phys. Rev. C, 75, 015801
- Passamonti & Andersson (2012) Passamonti A., Andersson N., 2012, MNRAS, 419, 638
- Passamonti & Pons (2016) Passamonti A., Pons J. A., 2016, MNRAS, 463, 1173
- Pethick & Potekhin (1998) Pethick C. J., Potekhin A. Y., 1998, Phys. Lett. B, 427, 7
- Pumpe et al. (2018) Pumpe D., Gabler M., Steininger T., Enßlin T. A., 2018, A&A, 610, A61
- Ravenhall, Pethick & Wilson (1983) Ravenhall D. G., Pethick C. J., Wilson J. R., 1983, Phys. Rev. Lett., 50, 2066
- Samuelsson & Andersson (2007) Samuelsson L., Andersson N., 2007, MNRAS, 374, 256
- Schumaker & Thorne (1983) Schumaker B. L., Thorne K. S., 1983, MNRAS, 203, 457
- Sotani, Tominaga & Maeda (2001) Sotani H., Tominaga K., Maeda K. I., 2001, Phys. Rev. D, 65, 024010
- Sotani, Kohri & Harada (2004) Sotani H., Kohri K., Harada T., 2004, Phys. Rev. D, 69, 084008
- Sotani, Kokkotas & Stergioulas (2007) Sotani H., Kokkotas K. D., Stergioulas N., 2007, MNRAS, 375, 261
- Sotani (2011) Sotani H., 2011, MNRAS, 417, L70
- Sotani et al. (2011) Sotani H., Yasutake N., Maruyama T., Tatsumi T., 2011, Phys. Rev. D, 83, 024014
- Sotani et al. (2012) Sotani H., Nakazato K., Iida K., Oyamatsu K., 2012, Phys. Rev. Lett., 108, 201101
- Sotani et al. (2013a) Sotani H., Nakazato K., Iida K., Oyamatsu K., 2013a, MNRAS, 428, L21
- Sotani et al. (2013b) Sotani H., Nakazato K., Iida K., Oyamatsu K., 2013b, MNRAS, 434, 2060
- Sotani (2014) Sotani H., 2014, Phys. Lett. B, 730, 166
- Sotani et al. (2014) Sotani H., Iida K., Oyamatsu K., Ohnishi A., 2014, Prog. Theor. Exp. Phys., 2014, 051E01
- Sotani, Iida & Oyamatsu (2016) Sotani H., Iida K., Oyamatsu K., 2016, New Astron., 43, 80
- Sotani (2016) Sotani H., 2016, Phys. Rev. D, 93, 044059
- Sotani, Iida & Oyamatsu (2017a) Sotani H., Iida K., Oyamatsu K., 2017a, MNRAS, 464, 3101
- Sotani, Iida & Oyamatsu (2017b) Sotani H., Iida K., Oyamatsu K., 2017b, MNRAS, 470, 4397
- Sotani, Iida & Oyamatsu (2018) Sotani H., Iida K., Oyamatsu K., 2018, MNRAS, 479, 4735
- Steiner & Watts (2009) Steiner A. W., Watts A. L., 2009, Phys. Rev. Lett., 103, 181101
- Stone, Stone & Moszkowski (2014) Stone J. R., Stone N. J., Moszkowski S. A., 2014 Phys. Rev. C, 89, 044316
- Strohmayer et al. (1991) Strohmayer T., Van Horn H. M., Ogata S., Iyetomi H., Ichimaru S., 1991, ApJ., 375, 679
- Strohmayer & Watts (2005) Strohmayer T. E., Watts A. L., 2005, ApJ, 632, L111
- Strohmayer & Watts (2006) Strohmayer T. E., Watts A. L., 2006, ApJ, 653, 593
- Van Horn et al. (1995) Van Horn H. M., Lee U., Epstein, R. I., Collins, T. J. B., in Ichimaru S., Ogata S., eds. Elementary Processes in Dense Plasmas, Addison-Wesley, Reading, p. 25
- Watanabe & Iida (2003) Watanabe G., Iida K., 2003, Phys. Rev. C, 68, 045801