FeTi2O5: a spin Jahn-Teller transition enhanced by cation substitution
Abstract
We have used muon-spin rotation, heat capacity and x-ray diffraction measurements in combination with density functional theory and dipole field calculations to investigate the crystal and magnetic structure of FeTi2O5. We observe a long range ordered state below =41.8(5) K with indications of significant correlations existing above this temperature. We determine candidate muon stopping sites in this compound, and find that our data are consistent with the spin Jahn-Teller driven antiferromagnetic ground state with =(1/2,1/2,0) reported for CoTi2O5 (=26 K). By comparing our data with calculated dipolar fields we can restrict the possible moment size and directions of the Fe2+ ions.
I Introduction
Compounds containing lattices of magnetic moments in which the exchange interactions are frustrated by the site symmetry of the moments are of great scientific interest due to the fact that comparably small terms in the Hamiltonian can play an important role in stabilising a particular ground state. This leads to a plethora of physical phenomena that can occur in such geometrically frustrated systems, such as spin ice states showing magnetic monopole excitations, spin liquids with fractional excitations, or topological spin textures. The Jahn-Teller effect is a spontaneous distortion of a systems that reduces its symmetry and energy, and lifts an orbital degeneracy. An analogous effect can occur that involves the magnetoelastic coupling of the spin instead of the orbital degrees of freedom. This spin Jahn-Teller effect is rather rare and until recently had been only identified in high symmetry scenarios. Examples include pyrochlore systems, in which the large degeneracy of the spins occupying a lattice of corner-sharing tetrahedra is lifted through a distortion of those tetrahedra Yamashita and Ueda (2000); Tchernyshyov et al. (2002). In a number of cubic spinels Watanabe et al. (2012); Onoda and Hasegawa (2003) a tetragonal distortion has been reported to relax the frustration in an entirely analagous way.
Recently, we reported an antiferromagnetic ground state in CoTi2O5 Kirschner et al. (2019), which we concluded to be driven by a spin Jahn-Teller effect. We observe CoTi2O5 to be orthorhombic and to undergo a transition to a long-range ordered state below 26 K with antiferromagnetically coupled chains of Co2+ along the axis. As the symmetry of the structure dictates that the orbital levels of the Co ions are nondegenerate and the interchain couplings are exactly frustrated, the observed long-range ordered state necessitates the presence of a spin-driven lattice distortion.
One possible pathway to tuning the properties of such a delicate ground state is cation substitution. In this paper we report a structural and magnetic characterisation of FeTi2O5. High quality single crystals of FeTi2O5 can now be prepared owing to recent advances in solid-state synthesis techniques Balbashov et al. (2017). This compound is isostructural to CoTi2O5 Müller-Buschbaum and Waburg (1983), but importantly the Fe2+ () ions have larger ionic radii and increased moments compared to the Co2+ () ions, which will affect the competition between the structural and magnetic energies involved in reaching the magnetic ground state. We expect that the larger Fe moments will enhance the magnetostructural coupling, whereas the slightly larger wavefunctions of the Fe ions are likely to lead to larger overlap with the oxygen orbitals and thereby increase the superexchange (Fe–O–Fe) couplings. This leads to the interesting prospect that FeTi2O5 may be more susceptible to structural distortions and that the effect of externally applied strain, either through chemical or physical means, would also be more significant, making it better suited to such studies.
In our measurements we observe a transition to a magnetically ordered state below 41.8(5) K, substantially higher than the transition temperature in CoTi2O5, and through a combination of calculational techniques demonstrate that the magnetic ground state is consistent with that found in CoTi2O5 with =(1/2,1/2,0), with the Fe magnetic moment lying in one of a small number of possible directions, with moment sizes ranging from about 2.54 to 3.44 depending on the direction. Since the Fe2+ () ions have site symmetry and their super-superexchange is exactly frustrated this magnetic structure requires a structural distortion, which we expect to be concomittant with the onset of long-range spin order. This makes FeTi2O5 another example demonstrating that the spin Jahn-Teller can occur in low symmetry compounds and such behaviour may even be universal in these orthorhombic systems.
II Experimental Details
A polycrystalline FeTi2O5 sample was prepared using FeO (99.5%) and TiO2 (99.99%) powders via the solid state reaction technique. The powders were mixed and sintered at 1200° C for 48 h in a highly pure argon atmosphere with intermediate grinding. We confirmed the resulting powder to be phase pure via x-ray diffraction, before sintering a cylindrical rod of diameter 10 mm and length 100 mm at 1250° C in a highly pure argon atmosphere for 12 h. Finally, we grew a single crystal in a four-mirror optical floating-zone furnace (Crystal Systems, Inc.) in an argon flow atmosphere with a growth rate of 1–2 mm/h.
Single crystal x-ray diffraction experiments were performed using a laboratory based Oxford Diffraction Supernova diffractometer fitted with a Mo Kα x-ray source. The sample was kept at room temperature, and an approximately full sphere of data was collected giving 4805 statistically significant, measured diffraction intensities. The diffraction data were refined with fullprofRodríguez-Carvajal (1993).
We performed zero-field (ZF) muon-spin rotation (SR) measurements on a sample of five single crystals of FeTi2O5 (=0.265 g) in a 4He flow cryostat on the GPS instrument at the Swiss Muon Source, PSI (Switzerland). The crystals were coaligned with the -plane perpendicular to the beam of incoming muons, i.e. the crystals shared the -axis, and the spin rotator was set to 45° relative to the muon momentum. All muon data were analysed with WiMDA Pratt (2000). The heat capacity was measured using a Quantum Design physical property measurement system (PPMS), while the magnetic susceptibility was measured with a Quantum Design magnetic property measurement system (MPMS).
III Results
III.1 Heat Capacity and Magnetic Susceptibility
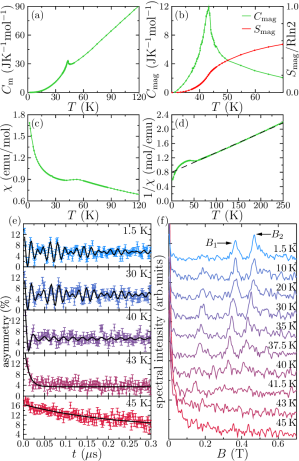
The molar heat capacity of FeTi2O5, plotted in Figure 1(a), exhibits a clear feature around 43 K. We obtain an estimate of the magnetic contribution to the heat capacity by subtracting a phenomenological phonon background term of the form =, where the fitted values are =578 K, =42 K and =0.77. The result is presented in Figure 1(b), together with the corresponding entropy . The entropy associated with the magnetic transition is about 60% of the expected value of Rln2, indicating significant correlations above . The magnetic susceptibility, shown in Figure 1(c), is consistent with a magnetic transition near 43 K and a fit to a Curie-Weiss law, presented in Figure 1(d), yields a Curie-Weiss temperature of =(1) K and hence a value of /3.5.
III.2 X-ray Diffraction
A global fit of the unit cell metric showed that the x-ray diffraction peak positions were consistent with an orthorhombic space group, and the refined lattice parameters are given in Table 1. Having indexed all measured intensities within the orthorhombic metric, data reduction using fullprofRodríguez-Carvajal (1993) showed the diffraction pattern to be in excellent agreement with the respective Laue Class (: 3.58%), and gave 306 independent reflections for structural refinement. The orthorhombic crystal structure previously reported for FeTi2O5 and CoTi2O5 Müller-Buschbaum and Waburg (1983) was Rietveld-refined against the diffracton intensities, again using fullprof. An excellent agreement between model and data was achieved (, , ). A statistically significant improvement to the fit was found when cation site mixing was included, constrained such that the total occupation of every cation site equalled one, but Fe was free to substitute Ti and vice versa. Approximately 10% Fe was found to be located on nominally Ti sites, though this fraction is difficult to establish precisely as x-ray diffraction measurements are only weakly sensitive to the site mixing of cations with similar atomic number.
| Cell parameters | ||||||
| Space group: (#194) | ||||||
| () 3.74098(9) 9.7609(2) 10.0914(2) | ||||||
| Volume () 368.49(2) | ||||||
| Atomic fractional coordinates | ||||||
| Atom | Site | Occ. | ||||
| Fe1 | 0 | 0.19322(6) | 1/4 | 0.896(9) | ||
| Ti1 | 0 | 0.19322(6) | 1/4 | 0.104(9) | ||
| Ti2 | 0 | 0.13401(5) | 0.56666(5) | 0.948(4) | ||
| Fe2 | 0 | 0.13401(5) | 0.56666(5) | 0.052(4) | ||
| O1 | 0 | 0.7917(3) | 1/4 | 1 | ||
| O2 | 0 | 0.0452(2) | 0.1123(2) | 1 | ||
| O3 | 0 | 0.3148(2) | 0.0586(2) | 1 | ||
| Anisotropic atomic displacement parameters () | ||||||
| (U12 = U13 = 0 for all sites) | ||||||
| Atom | U11 | U22 | U33 | U23 | ||
| Fe1 | 0.0062(3) | 0.0040(3) | 0.0061(3) | 0 | ||
| Ti2 | 0.0042(3) | 0.0048(3) | 0.0066(3) | 0.0003(2) | ||
| O1 | 0.005(1) | 0.008(1) | 0.005(1) | 0 | ||
| O2 | 0.013(1) | 0.0042(9) | 0.0050(9) | 0.0000(8) | ||
| O3 | 0.003(1) | 0.0059(9) | 0.008(1) | -0.0005(7) | ||
| Data reduction (: 3.58%) | ||||||
| measured reflections: 4805 | ||||||
| independent reflections ): 306 | ||||||
| fitted parameters: 29 | ||||||
III.3 SR
The measured ZF muon asymmetry is shown in Figure 1 together with its Fourier transform. There is clear evidence for a transition to a state with long range magnetic order, and also for two symmetry inequivalent muon sites with different local magnetic fields. There is a possible third peak in the Fourier transform near 0.2 T, but this is not clearly resolvable for all , including for the highest statistics dataset at 1.5 K. Our time-domain fitting did not converge when including this third peak, so we discount it from our analysis. In general, the asymmetry can be well fitted for all to the model
| (1) |
where =135.5 MHzT-1 is the muon gyromagnetic ratio. The terms in the sum represent muons at two different stopping sites precessing in their local fields , with the relaxation rates allowing for temporal fluctuations of the fields. The background term corresponds to muons that stop in the sample but have their spins aligned with the local field, as well as a small contribution from muons landing in the cryostat or sample holder. The values of and are approximately -independent as they only depend on the total flux of muons and the setup of the experiment. Their temperature averaged values are =11.2(5) % and =5.3(3) %. The fraction () of muons experiencing field () is also roughly constant with a value of 0.57(7) [0.43(7)]. Furthermore, we note that , suggesting the two muon sites to be of similar character. Above we can fit by setting ==0 in equation 1.
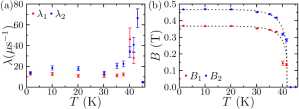
The results of fitting equation 1 are plotted in Figure 2. The relaxation rates peak at , consistent with a critical slowing down near the transition. The fields follow an order parameter like behaviour and can be modelled with the phenomenological form =, from which we obtain =41.8(5) K, as well as =0.367(4) T and =0.466(5) T. The fitted values of =7.5(3.5) and =0.21(13) are unreliable to identify the dimensionality of the behaviour due to the low number of temperature points.
We expect the effect of the site mixing on the muon measurements to be limited as the volume fraction of muons near a mixed site will be below our experimental sensitivity and the likely effect to muon sites further away from a mixed site will be a broadening of the magnetic field spectrum. The values of at low temperatures are approximately double those found for CoTi2O5, Kirschner et al. (2019) due to a wider field distribution which we attribute to the site mixing.
IV Muon Sites
To determine candidate muon sites in FeTi2O5 we carried out density functional theory (DFT) calculations using the plane-wave code Quantum ESPRESSO Giannozzi et al. (2009, 2017) within the generalised gradient approximation Perdew et al. (1996). Ultrasoft pseudopotentials were employed to model the ions Rappe et al. (1990), and a norm-conserving hydrogen pseudopotential was used for the muon. The cutoff for the wavefunction (charge density) was set to 60 Ry (600 Ry), and the Brillouin zone integration was carried out on a 533 Monkhorst-Pack -grid Monkhorst and Pack (1976). Within these parameters we obtained well-converged results that reproduced the atomic positions and lattice parameters within 3.5% of the experimental ones Müller-Buschbaum and Waburg (1983).
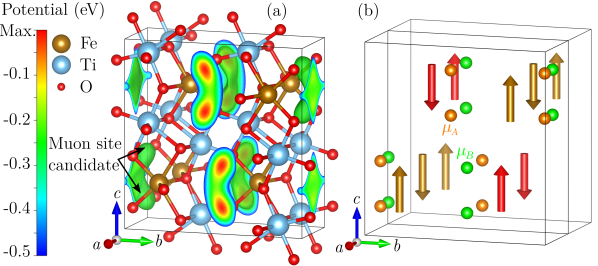
We employed two complementary approaches to determine the potential muon stopping sites. First, we compute the electrostatic Coulomb potential from the converged electron density and plot it throughout the unit cell, as shown in Figure 3(a). The maxima of the potential correspond to the lowest energies required to add a positive charge, and have been reliable indicators of possible muon sites Möller et al. (2013). From the electrostatic potential we can identify one muon site candidate at about [0.45, 0.05, 0.15], which is only approximate as it does not account for local distortions caused by the implanted muon. In a second approach, we insert a single muon into the unit cell at various different positions and allow all ions to move until the structure finds its lowest energy state. These relaxation calculations include muon-induced perturbations and yield the energetically most favourable muon location to be at [0.331, 0.045, 0.133]. This site represents a simple distortion from the location of the maximum potential towards the nearest oxygen, with which the muon forms a 1.0 O–H like bond. Such bonds appear to be typical for muon sites in oxygen containing compounds Möller et al. (2013); Foronda et al. (2015); Kirschner et al. (2018); Princep et al. (2019). This fully relaxed site is also completely consistent with that found in CoTi2O5, although the local distortions it causes are subtly different. While the presence of the muon seems to perturb the O and Ti in much the same way in the two compounds, we find that our DFT+ calculations predict a significantly reduced effect on the Fe ions. Whereas the Co ions are on average displaced by 0.12 , the Fe ions only move by about 0.05 . One possible explanation is that because the Fe ions have one fewer electron in the outer shell they are less strongly repulsed by the positive muon, although other factors beyond such a simple Coulomb-like picture may also play a role.
V Dipole field calculations
The muon site calculated via DFT has 16 symmetry-equivalent position in the unit cell of the parent structure. However, we only observe two muon signals experimentally, which requires that the 16 crystallographically equivalent muon sites must map into two inequivalent groups of sites within the magnetically ordered state of FeTi2O5. Furthermore, the experimental signals have an amplitude ratio of about 1:1, which tells us that each group should contain 8 of the 16 symmetry-equivalent muon sites. This restricts the possible magnetic structure of FeTi2O5 greatly. One possible candidate magnetic structure is that found in CoTi2O5 Kirschner et al. (2019), in which the mirror , which is broken at the transition observed in CoTi2O5, would be a natural operation for mapping the 16 muon sites onto two groups and , as illustrated in Figure 3(b). The magnetic fields at and would be swapped upon application of the operator. Assuming the propagation vector =(1/2,1/2,0) of one of the domains found in CoTi2O5, but allowing for a different Fe moment size and direction, we can compute the expected dipolar fields at the muon stopping sites. By comparing the number, relative sizes and multiplicities of the computed fields, presented in detail in the Appendix, we can constrain the possible moment directions and sizes to those summarised in Table 2. These give values for the relative error between observed and computed fields of 6 % to 10 %, showing a good agreement with our experimental data, particularly considering that we have neglected hyperfine fields. If one assumes an octahedral environment of the Fe2+ and Co2+ ions and high spin states we would expect the ratio of moment sizes to be =1.265. This suggests that the Fe2+ moment is most likely to lie along as this yields a moment size approximately 1.265 times the Co2+ moment size reported for CoTi2O5.Kirschner et al. (2019) However, we cannot unequivocally assign this direction as the crystal environment is neither octahedral, nor should the -factors of the Fe and Co ions necessarily be the same, nor is the site mixing the same in the two studied compounds.
| ( | (T) | (T) | (%) | |
|---|---|---|---|---|
| 3.44 | 0.382 | 0.443 | 6.3 | |
| 2.54 | 0.382 | 0.447 | 5.9 | |
| 2.86 | 0.392 | 0.431 | 10.1 | |
| 2.57 | 0.386 | 0.439 | 7.8 | |
| experimental | 0.367(4) | 0.466(5) | ||
VI Conclusions
We have observed long-range magnetic order in FeTi2O5, which is consistent with the antiferromagnetic state previously reported in CoTi2O5, but with a substantially higher transition temperature of 41.8(5) K. We presented detailed calculations of the muon site candidates and dipolar fields at these sites for different moment directions and sizes. While a small number of moment directions was found to give fields consistent with the experimentally observed ones, we argued that the most likely direction is along with a moment size of =3.44 . Furthermore, our x-ray diffraction data show FeTi2O5 to have the same crystal structure as CoTi2O5. Given that these two compounds are therefore isostructural crystallographically and magnetically this means that FeTi2O5 is most likely also a spin Jahn-Teller driven antiferromagnet like CoTi2O5. This leads to the interesting question whether similar behaviour may be common to related orthorhombic systems. In addition, we find there is significant missing entropy associated with the magnetic heat capacity, which indicates strong correlations above the transition. One possible explanation is the formation of antiferromagnetic correlations along the direction (the most strongly coupled direction because of Fe–O–Fe superexchange) persisting above (but below ). The amount of site mixing is another important aspect to consider. A larger site mixing would effectively reduce the magnetic contribution to the free energy, and thereby might reduce the transition temperature or suppress the transition altogether. A future study in which the site mixing is increased purposefully could study the effect of this on the magnetic ordering. Furthermore, it would be useful to study the effect of increasing the cation size even further, especially since the orthorhombic crystal structure may become unstable for larger cations, similar to the Goldschmidt tolerance factor in perovskites Goldschmidt (1926); Li et al. (2016).
Acknowledgements.
This work is supported by EPSRC (UK) grant No EP/N024028/1. R.D.J. acknowledges support from a Royal Society University Research Fellowship. Part of this work was performed at the Swiss Muon Source, PSI Switzerland. The authors made use of the University of Oxford Advanced Research Computing (ARC) facility Richards (2015).Appendix A direction and size determination
Denoting the Fe moments by at positions we can calculate the dipolar fields at the muon site via
| (2) |
with = and denoting the position of the muon. The possible muon positions are taken to be the 16 symmetry-equivalent sites per crystallographic unit cell that correspond to the most likely muon site candiate calculated from DFT. The positions of the Fe ions are taken to be those determined by our x-ray diffraction experiments, and we refer to the four symmetry-equivalent crystallographic sites with respect to the unit cell as Fe1: [0,,], Fe2: [,,], Fe3: [,,], Fe4: [0,1,], where =0.19322(6). Because all the Fe ions are structurally equivalent and hence share the same chemical environment, we furthermore constrain the magnetic moment sizes of these ions to be equal. The propagation vector is taken to be =(1/2,1/2,0), corresponding to one of the domains found in CoTi2O5, as it is the most likely candidate given the similarity between the crystal structures and the observed muon spectra of FeTi2O5 and CoTi2O5. Within these assumptions we performed a symmetry analysis using the isotropy Suite Campbell et al. (2006); Stokes et al. (2007) taking the crystal structure as the parent. Through systematic tests it was found that only two scenarios exist that lead to magnetic structure models with a single irreducible representation. These two scenarios area: I) the moments on sites Fe1 and Fe4 are parallel, and moments on the Fe2 and Fe3 sites are antiparallel. If the moment is along the relevant irrep is mS (space group , this is the structure reported for CoTi2O5)Kirschner et al. (2019), and if the moment is perpendicular to the irrep is mS (space group ). II) the moments on sites Fe1 and Fe4 are antiparallel, and moments on the Fe2 and Fe3 sites are parallel. If the moment is along the relevant irrep is mS (space group ), and if the moment is perpendicular to the irrep is mS (space group ). In both of these scenarios two domains exist, with the moments on sites Fe1 and Fe2 either aligned parallel or antiparallel to each other. Both domains yield the same dipolar fields at the muon sites and hence cannot be distinguished by our measurements.

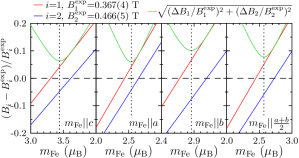
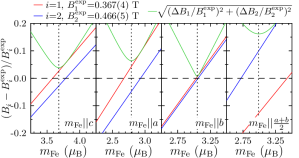
In Figure 4 we plot the dipolar fields obtained for a range of possible Fe moment directions for scenario I) as described above. We see that for the vast majority of tested directions we obtain fields that are inconsistent with the experimentally observed ones. (We can probably accept a value of / which is a little outside the experimentally determined ratio of 1.27(3) shown as dashed lines in Figure 4 because of the uncertainty due to the unknown value of the hperfine fields). This is because either these moment directions yield more than two fields, or two fields with multiplicity ratios that are far from the experimental ratio of about 1:1, or because the ratio of the two field strengths is vastly different from that of the experimental one. This allows us to restrict the possible moment directions to be along, or very close to, one of the orthorhombic axes or along /2. For these directions we obtain two local fields with ratios for the multiplicity and strength consistent with our data. We can scale these fields with the moment size , as shown in Figure 5, and minimise the value of = to optimise the agreement with our experimental observations. This leads to potential magnetic structures with moment sizes and directions summarised in Table 2.

For completeness we have repeated these calculations for the case of the moments on the Fe1 and Fe4 sites antiparallel, and the moments on the Fe2 and Fe3 sites parallel, which is referred to as scenario II) above. The results are given in Figures 6 and 5, and Table 3. They show that similar to scenario I) only a few moment directions would be consistent with our experimental data (two fields with the correct ratios of field strengths and multiplicities). While some of these directions can lead to good agreement with the experimentally observed fields, the moment size predicted within these magnetic structures differ significantly from those one expects for the Fe2+ ions: the Co moment in CoTi2O5 was measured to be 2.72 and a simple calculation based on octahedral environments and high spin states of the ions yields =3.44 . Therefore, we believe the most likely magnetic structure of FeTi2O5 that is consistent with our data to be isostructural to that reported for CoTi2O5:Kirschner et al. (2019) Fe moments of equal magnitude aligned along with their relative alignment as described in scenario I) above (magnetic space group ). However, given the inherent uncertainties of our calculations (we have neglected hyperfine field contributions, the environments of the ions are not octahedral, the effect of site mixing has not been quantified) we cannot conclusively rule out that FeTi2O5 might adopt some of the other tested magnetic structures that we have tested. We note that the case of II) with (magnetic space group ) would also lead to a spin Jahn-Teller driven transition due to the complete frustration of the exchange pathways between the ions.
| ( | (T) | (T) | (%) | |
| 3.68 | 0.377 | 0.453 | 3.8 | |
| 2.79 | 0.383 | 0.443 | 6.4 | |
| 3.05 | 0.369 | 0.464 | 0.7 | |
| 2.99 | 0.320 | 0.512 | 16 | |
| + | 2.83 | 0.368 | 0.465 | 0.3 |
| experimental | 0.367(4) | 0.466(5) | ||
References
- Yamashita and Ueda (2000) Y. Yamashita and K. Ueda, Physical Review Letters 85, 4960 (2000).
- Tchernyshyov et al. (2002) O. Tchernyshyov, R. Moessner, and S. L. Sondhi, Physical Review Letters 88, 067203 (2002).
- Watanabe et al. (2012) T. Watanabe, S.-I. Ishikawa, H. Suzuki, Y. Kousaka, and K. Tomiyasu, Physical Review B 86, 144413 (2012).
- Onoda and Hasegawa (2003) M. Onoda and J. Hasegawa, Journal of Physics: Condensed Matter 15, L95 (2003).
- Kirschner et al. (2019) F. K. K. Kirschner, R. D. Johnson, F. Lang, D. D. Khalyavin, P. Manuel, T. Lancaster, D. Prabhakaran, and S. J. Blundell, Physical Review B 99, 064403 (2019).
- Balbashov et al. (2017) A. M. Balbashov, A. A. Mukhin, V. Y. Ivanov, L. D. Iskhakova, and M. E. Voronchikhina, Low Temperature Physics 43, 965 (2017).
- Müller-Buschbaum and Waburg (1983) H. Müller-Buschbaum and M. Waburg, Monatshefte für Chemie 114, 21 (1983).
- Rodríguez-Carvajal (1993) J. Rodríguez-Carvajal, Physica B: Condensed Matter 192, 55 (1993).
- Pratt (2000) F. L. Pratt, Physica B: Condensed Matter 289-290, 710 (2000).
- Giannozzi et al. (2009) P. Giannozzi, S. Baroni, N. Bonini, M. Calandra, R. Car, C. Cavazzoni, D. Ceresoli, G. L. Chiarotti, M. Cococcioni, I. Dabo, A. D. Corso, S. de Gironcoli, S. Fabris, G. Fratesi, R. Gebauer, U. Gerstmann, C. Gougoussis, A. Kokalj, M. Lazzeri, L. Martin-Samos, N. Marzari, F. Mauri, R. Mazzarello, S. Paolini, A. Pasquarello, L. Paulatto, C. Sbraccia, S. Scandolo, G. Sclauzero, A. P. Seitsonen, A. Smogunov, P. Umari, and R. M. Wentzcovitch, Journal of Physics: Condensed Matter 21, 395502 (2009).
- Giannozzi et al. (2017) P. Giannozzi, O. Andreussi, T. Brumme, O. Bunau, M. B. Nardelli, M. Calandra, R. Car, C. Cavazzoni, D. Ceresoli, M. Cococcioni, N. Colonna, I. Carnimeo, A. D. Corso, S. de Gironcoli, P. Delugas, R. A. DiStasio, A. Ferretti, A. Floris, G. Fratesi, G. Fugallo, R. Gebauer, U. Gerstmann, F. Giustino, T. Gorni, J. Jia, M. Kawamura, H.-Y. Ko, A. Kokalj, E. Küçükbenli, M. Lazzeri, M. Marsili, N. Marzari, F. Mauri, N. L. Nguyen, H.-V. Nguyen, A. O. de-la Roza, L. Paulatto, S. Poncé, D. Rocca, R. Sabatini, B. Santra, M. Schlipf, A. P. Seitsonen, A. Smogunov, I. Timrov, T. Thonhauser, P. Umari, N. Vast, X. Wu, and S. Baroni, Journal of Physics: Condensed Matter 29, 465901 (2017).
- Perdew et al. (1996) J. P. Perdew, K. Burke, and M. Ernzerhof, Physical Review Letters 77, 3865 (1996).
- Rappe et al. (1990) A. M. Rappe, K. M. Rabe, E. Kaxiras, and J. D. Joannopoulos, Physical Review B 41, 1227 (1990).
- Monkhorst and Pack (1976) H. J. Monkhorst and J. D. Pack, Physical Review B 13, 5188 (1976).
- Möller et al. (2013) J. S. Möller, P. Bonfà, D. Ceresoli, F. Bernardini, S. J. Blundell, T. Lancaster, R. De Renzi, N. Marzari, I. Watanabe, S. Sulaiman, and M. I. Mohamed-Ibrahim, Physica Scripta , 068510 (2013).
- Foronda et al. (2015) F. R. Foronda, F. Lang, J. S. Möller, T. Lancaster, A. T. Boothroyd, F. L. Pratt, S. R. Giblin, D. Prabhakaran, and S. J. Blundell, Physical Review Letters 114, 017602 (2015).
- Kirschner et al. (2018) F. K. K. Kirschner, F. Lang, F. L. Pratt, T. Lancaster, Y. Shi, Y. Guo, A. T. Boothroyd, and S. J. Blundell, in Proceedings of the 14th International Conference on Muon Spin Rotation, Relaxation and Resonance (SR2017), Vol. 011013 (Journal of the Physical Society of Japan, 2018) pp. 1–6.
- Princep et al. (2019) A. J. Princep, H. L. Feng, Y. F. Guo, F. Lang, H. M. Weng, P. Manuel, D. Khalyavin, A. Shenshyn, M. Rahn, Y. H. Yuan, Y. Matsushita, S. J. Blundell, K. Yamaura, and A. T. Boothroyd, 1, 1 (2019), arXiv:1902.04482 .
- Momma and Izumi (2008) K. Momma and F. Izumi, Journal of Applied Crystallography 41, 653 (2008).
- Goldschmidt (1926) V. M. Goldschmidt, Naturwissenschaften 14, 477 (1926).
- Li et al. (2016) Z. Li, M. Yang, J.-S. Park, S.-H. Wei, J. J. Berry, and K. Zhu, Chemistry of Materials 28, 284 (2016).
- Richards (2015) A. Richards, University of Oxford Advanced Research Computing, Zenodo (2015).
- Campbell et al. (2006) B. J. Campbell, H. T. Stokes, D. E. Tanner, and D. M. Hatch, Journal of Applied Crystallography 39, 607 (2006).
- Stokes et al. (2007) H. T. Stokes, D. M. Hatch, and B. J. Campbell, ISOTROPY Software Suite (2007).