1Erciyes University, Astronomy and Space Science Observatory, TR-38039, Kayseri, Turkey
\affilTwo2Observatorio Astronomico Nacional, Universidad Nacional Autonoma de México, Apartado Postal 106, C.P. 22800, Ensenada, B.C., México.
\affilThree3Department of Astronomy and Space Sciences, Science Faculty, Istanbul University, 34119, Istanbul, Turkey.
Photometry of NGC 2323 and NGC 2539 Open Clusters
Abstract
The open clusters NGC 2323 and NGC 2539 have been analysed using CCD photometric data, observed at the San Pedro Mártir Observatory. Cluster memberships have been determined with the proper motion and parallax measures from the GaiaDR2 astrometric data release. Photometric metal and heavy element abundances have been obtained as (NGC 2323) and (NGC 2539), from the – technique in the two colour diagrams, which are used to select the appropriate PARSEC isochrones.
The estimated reddening of NGC 2323 is E(B-V)=0.230.04 using 11 early type stars. For NGC 2539, we find E(B-V)= 0.020.06. For – colour, distance moduli and distances for NGC 2323 and NGC 2539 are derived as (–, (pc)) = (10.000.10, 100050) and (–, (pc)) = (10.000.04, 100020), respectively. The median GaiaDR2 distance d=1000140 pc (=0.9980.136 mas) for the likely members of NGC 2323 is in concordance with its four colour photometric distances 910–1000 pc. For NGC 2539, its GaiaDR2 distance d=1330250 pc (=0.7510.139 mas) is close to its four colour photometric distances, 1000 pc.
Fitting the PARSEC isochrones to the colour magnitude diagrams (CMDs) gives an old age, 890110 Myr, for NGC 2539. Whereas NGC 2323 has an intermediate-age, 20050 Myr. One Red Clump/Red Giant candidate (BD-12 2380) in the CMDs of NGC 2539 has been confirmed as a member in terms of the distances =95050 pc and =91090 pc of filters within the uncertainties, as compared to the distance, 100020 pc of NGC 2539. This giant’s GaiaDR2 distance (d=120070 pc) is not close to these photometric distances.
keywords:
Galaxy evolution—open clusters and associations, individual—Hertzsprung-Russell and C-M diagrams.iakkaya@erciyes.edu.tr
?? ?? 2019?? ?? 2019
12.3456/s78910-011-012-3 \artcitid#### \volnum000 0000 \pgrange1– \lp1
1 Introduction
CCD photometric data which include the filter for open clusters (OCs) are quite valuable for determining the interstellar reddening, – and the photometric metallicity and heavy-element abundance ([M/H], Z) on colour-colour diagram (CC). The two parameters are vital importance for deriving the distance modulus, – and the distance, (kpc) and age, (Gyr) from colour-magnitude diagrams (CMDs).
In this study we have analysed the deep CCD photometry of the OCs, NGC 2323 and NGC 2539 from the Sierra San Pedro Mártir National Astronomical Observatory (SPMO) open cluster survey (cf. Schuster et al.2007; Tapia et al.2010 (T10); Akkaya et al.2010 (A10); Akkaya Oralhan et al.2015 (A15). Both OCs are uniformly and homogeneously analysed with regards to the instrumentation, observing techniques, and reduction and calibration methods. The two OCs which are located in 3rd quadrand have no spectroscopic metal abundances in the literature. Their basic parameters from the literature (Kharchenko et al.2013) are listed in Table 1. NGC 2323 has been studied by Sharma et al.(2006) using CCD UBVI photometry and by Claria et al.(1998) from photoelectric UBV photometry. For NGC 2539, Choo et al.(2006) used CCD UBVI photometry to search variable stars. Joshi and Sagar (1986) studied its photoelectric UBV photometry. Claria and Lapsset (1986) use CCD DDO and CMT1T2 photometries for this OC. Many published works of these OCs (Table 11) are of the brighter stars, which are based on old photographic and photoelectric photometries.
Additionally, we use the GaiaDR2 astrometric data (proper motion components and parallaxes) (Gaia Collaboration, Brown et al.2018) for determining the probable members for NGC 2323 and NGC 2539. The membership determinations of previous works have been based on the proper motions () of Roeser et al.(2010) in combination with 2MASS JHKs values of Skrutskie et al.(2006). Cantat-Gaudin et al.(2018) state that the proper motion uncertainties of UCAC4 fall in the range of 1-10 mas yr-1 (Roeser et al.2010; Zacharias et al.2013), whereas the ones of Tycho-Gaia Astrometric Solution (TGAS) (Gaia Collaboration, Brown et al.2016) have the range of 0.5-2.6 mas yr-1.
Because of the above-mentioned scientific grounds, we combine the recent GaiaDR2 astrometric data with deep CCD photometry of both OCs, to derive their reddenings, metal abundances, distance moduli and distances, and ages for four colour indices, (B-V), (V-I), (R-I) and –. This kind of photometric data are also valuable for classifying early-type stars, blue stragglers, and RC/RG candidates in the CMDs, and thus possible candidates are proposed for spectroscopic observations.
This paper is organized as follows: Section 2 describes the observation and reduction techniques. The technique for determining cluster membership is presented in Section 3. Section 4 describes general procedures concerning the derivation of astrophysical parameters, and in Section 5 the results for these astrophysical parameters are presented. Discussions and Conclusions are given in Section 6.
| Cluster | NGC 2323 | NGC 2539 |
|---|---|---|
| 07 02 43.1 | 08 10 40.8 | |
| (07 02 51.6) | (08 10 42) | |
| 08 22 12 | 12 50 24 | |
| (08 20 42) | (12 50 31) | |
| 221.66 | 233.73 | |
| b | -1.33 | 11.11 |
| () | 0.50 0.17 | 2.28 0.19 |
| (0.816 0.248) | (2.347 0.181) | |
| () | 1.75 0.17 | 1.91 0.19 |
| (0.653 0.210) | (0.5690.205) |
| Cluster | RA | DEC | LJD | Air mass | Filter | Filter | Filter | Filter | Filter |
| (2000) | (2000) | (days) | range | Exp. Time (s) | Exp. Time (s) | Exp. Time (s) | Exp. Time (s) | Exp. Time (s) | |
| NGC 2323 | 07:02:52.4 | 08:21:01.2 | 2452669 | 1.352-1.382 | 60,300 | 10,30 | 6,20 | 4,15 | 4,15 |
| NGC 2539 | 08:10:43.4 | 12:51:41.9 | 2452669 | 1.414-1.423 | 300 | 60 | 25 | 10 | 8 |
| PG0918+029 | 09:21:32.6 | 02:47:42.9 | 2452669 | 1.135-1.136 | 300 | 220 | 120 | 80 | 80 |
| RU 149 | 07:24:15.5 | 00:32:58.0 | 2452669 | 1.174-1.175 | 300 | 65 | 45 | 50 | 50 |
| RU 152 | 07:29:58.4 | 02:06:11.2 | 2452669 | 1.198-1.523 | 2x300 | 45,50 | 25,27 | 15,16 | 15,18 |
| F i r s t P a s s | S e c o n d P a s s | |||||||||
|---|---|---|---|---|---|---|---|---|---|---|
| index | points | points | ||||||||
| UUB | 4.1880.022 | 0.4170.016 | -0.0820.009 | 0.018 | 50 | -0.1440.050 | 0.0310.039 | 0.0100.015 | 0.022 | 291 |
| UUV | 4.1980.024 | 0.4280.017 | -0.0490.006 | 0.020 | 56 | -0.0720.016 | 0.0140.012 | 0.0010.002 | 0.021 | 301 |
| BUB | 2.5270.018 | 0.2060.013 | -0.0320.007 | 0.013 | 50 | -0.1040.055 | 0.0140.043 | 0.0470.015 | 0.023 | 291 |
| BBV | 2.5710.019 | 0.1940.013 | -0.0520.010 | 0.014 | 56 | -0.1110.021 | 0.0330.016 | 0.0080.007 | 0.021 | 355 |
| VBV | 2.1890.019 | 0.1180.013 | 0.0670.010 | 0.014 | 56 | 0.0330.020 | 0.0120.015 | 0.0120.007 | 0.020 | 355 |
| VVR | 2.1700.021 | 0.1310.015 | 0.1220.022 | 0.017 | 66 | 0.1180.031 | -0.0150.023 | 0.0140.013 | 0.021 | 427 |
| RVR | 2.2540.021 | 0.0770.015 | 0.0360.021 | 0.016 | 66 | -0.0020.032 | 0.0130.025 | 0.0290.014 | 0.022 | 427 |
| RRI | 2.2260.014 | 0.0910.011 | 0.0650.010 | 0.010 | 56 | 0.0810.033 | -0.0150.025 | -0.0090.010 | 0.021 | 388 |
| IVI | 2.5470.027 | 0.0040.018 | -0.0470.015 | 0.018 | 52 | -0.0840.019 | 0.0360.014 | -0.0100.003 | 0.024 | 368 |
| IRI | 2.5320.028 | 0.0210.020 | -0.1160.017 | 0.022 | 56 | -0.1410.038 | 0.0250.029 | -0.0090.011 | 0.025 | 388 |
| HJD | Meas.(B-V)Air Mass | Landolt Fields |
| 2452668 | 596;0.284–1.605; 1.19–1.34 | PG1047+003 0035 CL13 |
| RU149 0538 CL13 | ||
| 2452669 | 606;0.284–1.727; 1.14–1.50 | G3061911464112566400RM |
| PG0918+029 0068 CL13 | ||
| PG1047+003 0035 CL13 | ||
| RU149 0525 CL13 | ||
| RU152 0561 CL13 | ||
| All | 1202;0.284–1.727; 1.14–1.50 | |
| HJD | Meas.(B-V) Air Mass | Landolt Fields |
| 2452668 | 184;0.034–1.170;1.19–1.34 | RU149 0557 CL13 |
| 2452669 | 96; 0.043–1.528;1.20–1.50 | G3061911464112566400RM |
| RU152 0586 CL13 | ||
| All | 96;0.043–1.528; 1.20–1.50 |
2 Observations and reductions
Observations were carried out at the SPMO, during photometric nights, on June 7-10, 2013 UT using the 0.84-m (f/15) Ritchey-Chretien telescope equipped with the Mexman filter wheel and the ESOPO CCD detector, a 2048x4608 13.5-m square-pixel e2v CCD42-90 with a gain of 1.7 e-/ADU and a readout noise of 3.8 e- at 22 binning. The combination of the telescope and detector ensures an unvignetted field of view of 7.49.3 arcmin2. Each OC was observed through Johnson’s and Kron-Cousin’s 111personel communication of A. Landolt. filters with short and long exposure times in order to properly record both the brighter and fainter stars of the fields under study. Standard fields (Landolt 2009) were also observed near the meridian and at 1.14–1.52 air masses to properly determine the atmospheric extinction coefficients and the equations to transform the instrumental data to the standard system. Flat fields were taken nightly at the beginning and/or the end of the night, whereas biases were recorded between cluster observations. For more details see the works of T10 and A10. The log of the observations is shown in Table 2. It contains the object names, coordinates at the centres of the observed fields, local Julian date of the observations, air-mass range during the observations, and exposure times in each band. The second part of Table 2 contains data of the observed standard fields.
The data reduction was carried out by R. Michel 222Data may be requested from R. Michel. using the IRAF333IRAF is distributed by the National Optical Observatories, operated by the Association of Universities for Research in Astronomy, Inc., under cooperative agreement with the National Science Foundation. package and together with some home-made auxiliary Fortran programs and Awk scripts. The supervised-automatic procedure, implemented by C. Chavarria, can be condensed as follows. All the images were bias subtracted and flat-field corrected (CCDRED); cosmic rays were then removed with the L.A. Cosmic444http://www.astro.yale.edu/dokkum/lacosmic script (van Dokkum 2001).
The images of each set of observations were aligned and trimmed (IMALIGN), generating a template image of each cluster field (IMSUM). By using these template images, in addition to reference images from the ESO Digital Sky Survey555http://archive.eso.org/dss/dss, and equatorial coordinates from the 2MASS All-Sky Catalog of Point Sources (Cutri et al.2003), an astrometric solution is obtained (CCMAP and CCTRAN) providing a means to transform pixel coordinates to equatorial coordinates of each detected star.
For each image, the average sky level and its standard deviation are iteratively calculated with the help of the IMSTAT routine. The average of the stars in each image is also found by means of DAOFIND, FITPSF, and filtering routines. With this information, bright-unsaturated-isolated stars are identified and used iteratively to build the point spread function (PSF) for each image. Consequently, instrumental magnitudes are calculated using the ALLSTAR routine (Stetson 1987).
The aperture photometry (PHOT) of the standard stars was calculated using a fixed aperture radius of where was the average of the run, and its standard deviation. The pixel coordinates of each measured star are then transformed to their corresponding equatorial coordinates. The standard magnitudes were taken from the catalogue by Landolt (2009) and supplemented with the secondary photometric standards by Cutri et al.(2013). As a result, the transformation coefficients were found (FITPARAMS) using Equations 110:
| (1) | ||||
| (2) | ||||
| (3) | ||||
| (4) | ||||
| (5) | ||||
| (6) | ||||
| (7) | ||||
| (8) | ||||
| (9) | ||||
| (10) |
| V | |||||
| NGC 2323 | |||||
| 9-10 | 0.002 | 0.004 | 0.004 | 0.003 | 0.003 |
| 10-11 | 0.001 | 0.003 | 0.003 | 0.002 | 0.001 |
| 11-12 | 0.001 | 0.004 | 0.004 | 0.002 | 0.002 |
| 12-13 | 0.002 | 0.004 | 0.004 | 0.003 | 0.003 |
| 13-14 | 0.002 | 0.004 | 0.004 | 0.005 | 0.007 |
| 14-15 | 0.002 | 0.006 | 0.005 | 0.005 | 0.009 |
| 15-16 | 0.003 | 0.006 | 0.006 | 0.012 | 0.018 |
| 16-17 | 0.007 | 0.009 | 0.011 | 0.025 | 0.041 |
| 17-18 | 0.024 | 0.020 | 0.030 | - | - |
| 18-19 | 0.064 | 0.050 | 0.074 | - | - |
| NGC 2539 | |||||
| 10-11 | 0.003 | 0.006 | 0.005 | 0.004 | 0.004 |
| 11-12 | 0.002 | 0.007 | 0.006 | 0.004 | 0.004 |
| 12-13 | 0.003 | 0.006 | 0.006 | 0.005 | 0.005 |
| 13-14 | 0.004 | 0.009 | 0.008 | 0.007 | 0.008 |
| 14-15 | 0.005 | 0.010 | 0.009 | 0.009 | 0.012 |
| 15-16 | 0.007 | 0.014 | 0.012 | 0.014 | 0.021 |
| 16-17 | 0.013 | 0.024 | 0.021 | 0.025 | 0.039 |
| 17-18 | 0.022 | 0.041 | 0.037 | 0.051 | 0.077 |
| 18-19 | 0.040 | 0.067 | 0.065 | 0.085 | 0.110 |
where , , , , are the magnitudes in the instrumental system, , , , , the magnitudes in the standard system, and is the air mass during the measurement. During the first iteration, only the first-order extinction measurements (for the stars observed over an extended range of air mass) were used to calculate the zero point (), first-order extinction (), and colour () coefficients; the second-order extinction () was zeroed. For the second interation, all data were used, having the zero points and first-order extinction values fixed to the values found in the previous iteration, while the colour-dependent coefficients ( and ) were re-calculated. corrects the shift in due to the convolution of the spectral-energy distribution of the stars with the wavelength dependence of . These values are given in Table 3.
For the case of this observing run, the number of valid measurements used in the transformations is shown in first three rows of Table 4 together with the colour and air-mass range near zenith of the standard fields. Table 4 includes the local Julian date of the observations, the number of measurements, the interval of the colour –, the air-mass range, and Landolt’s field name. The resulting coefficients found using Equations 110, the deviations of the fits, and the number of stars used in the calculations are given in three rows at the bottom of Table 4. New images that contained only the PSF stars were generated with the help of the GROUP, NSTAR and SUBSTAR routines, and aperture corrections were calculated with PHOT and MKAPFILE of IRAF. The mean value of the aperture correction is about magnitude.
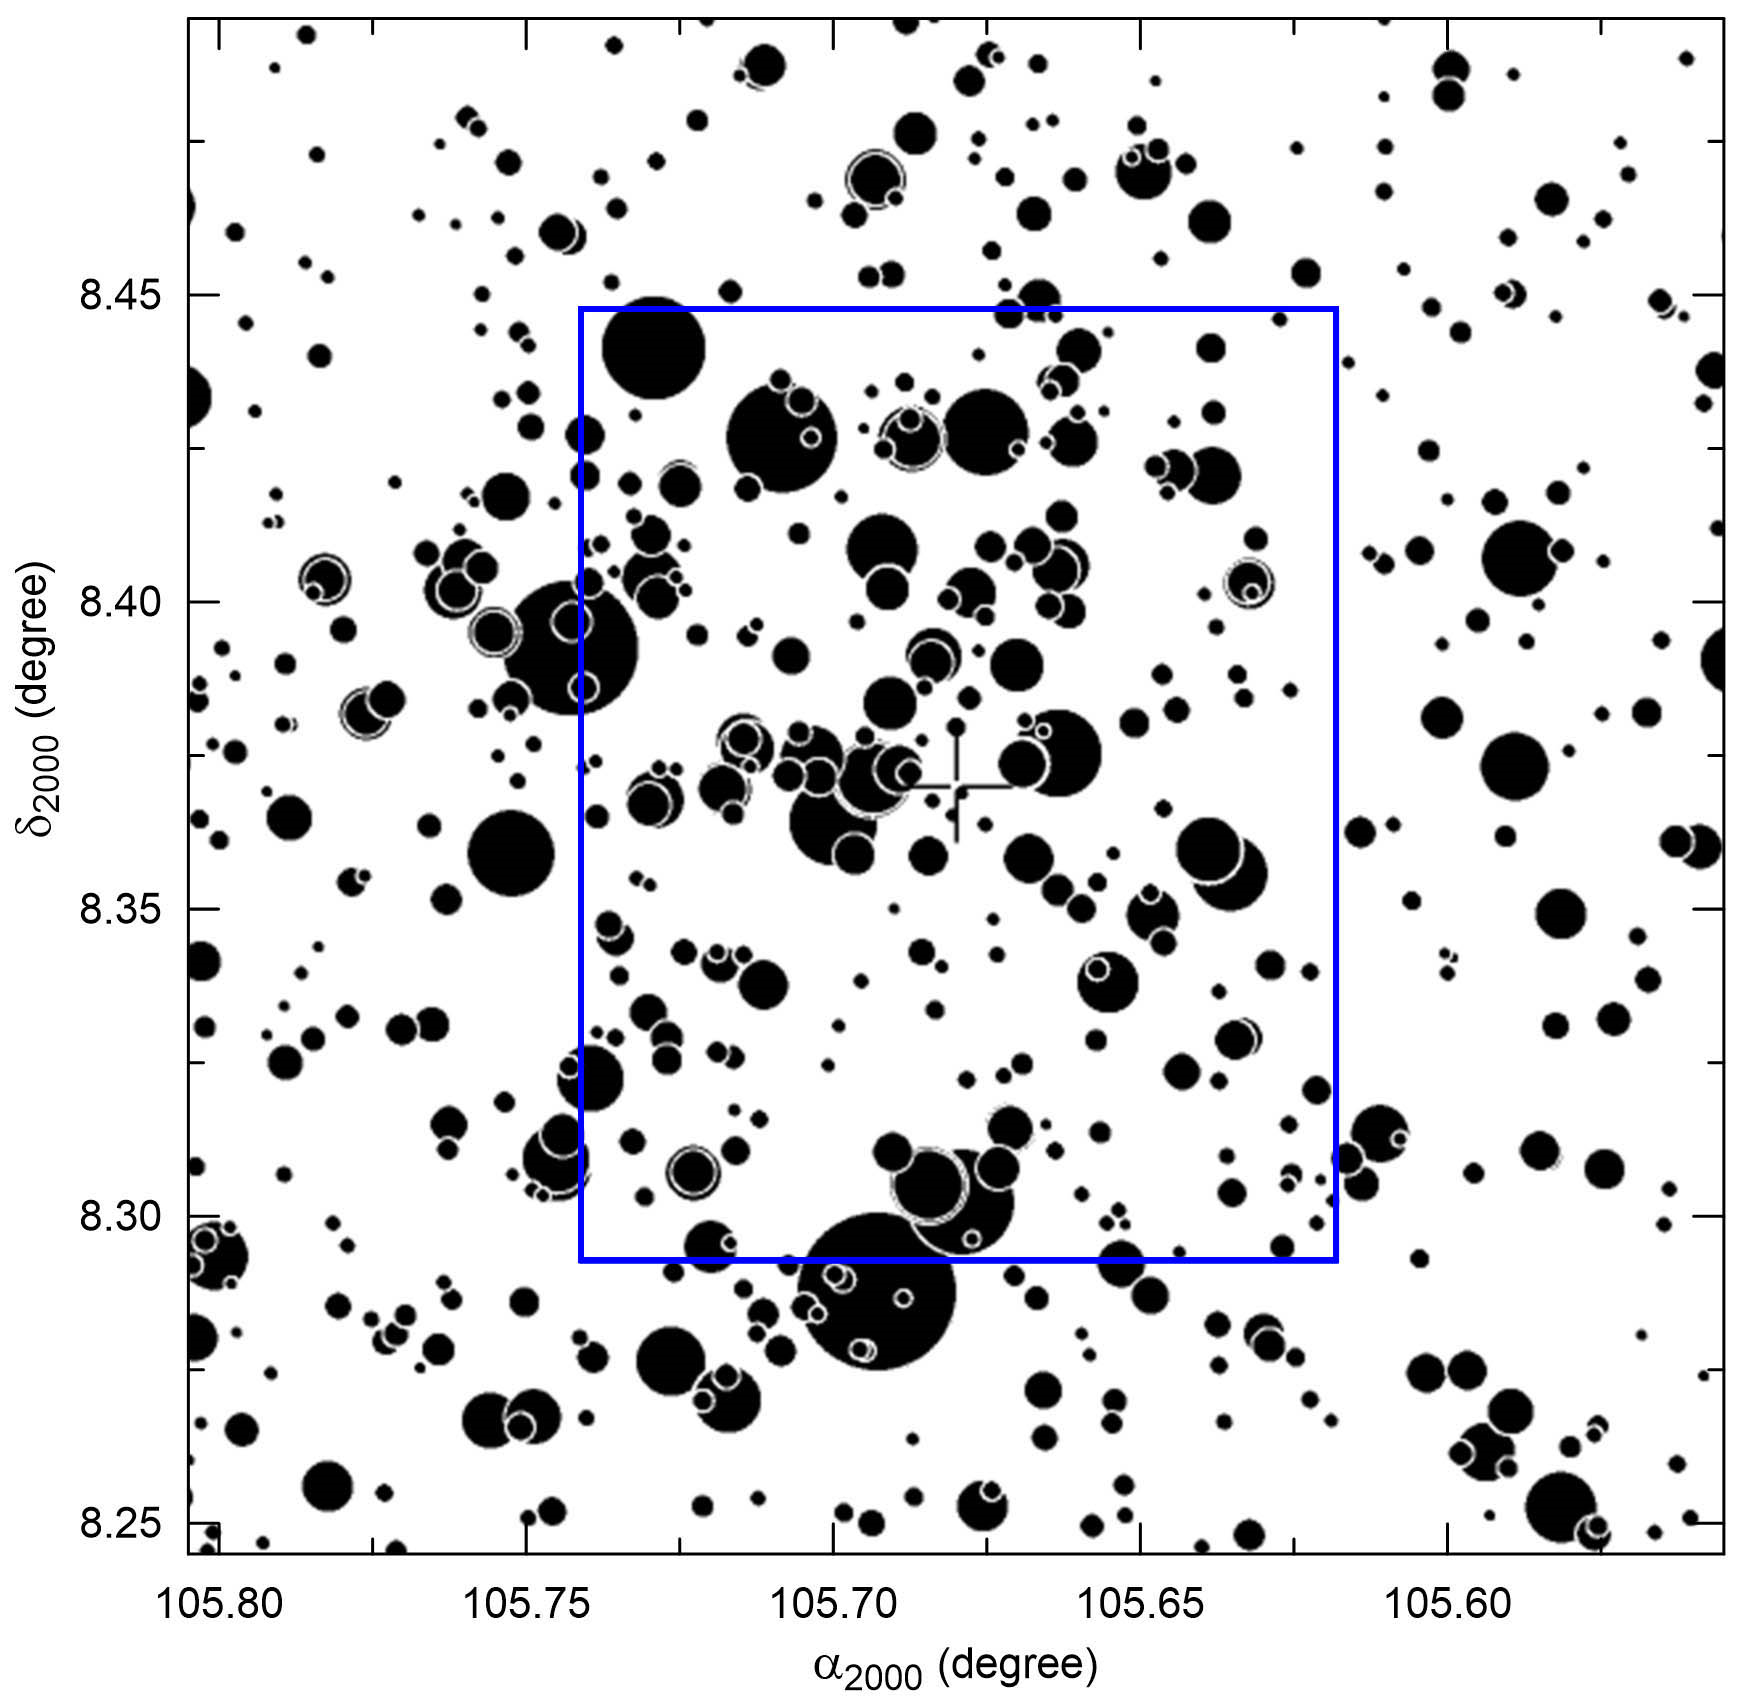
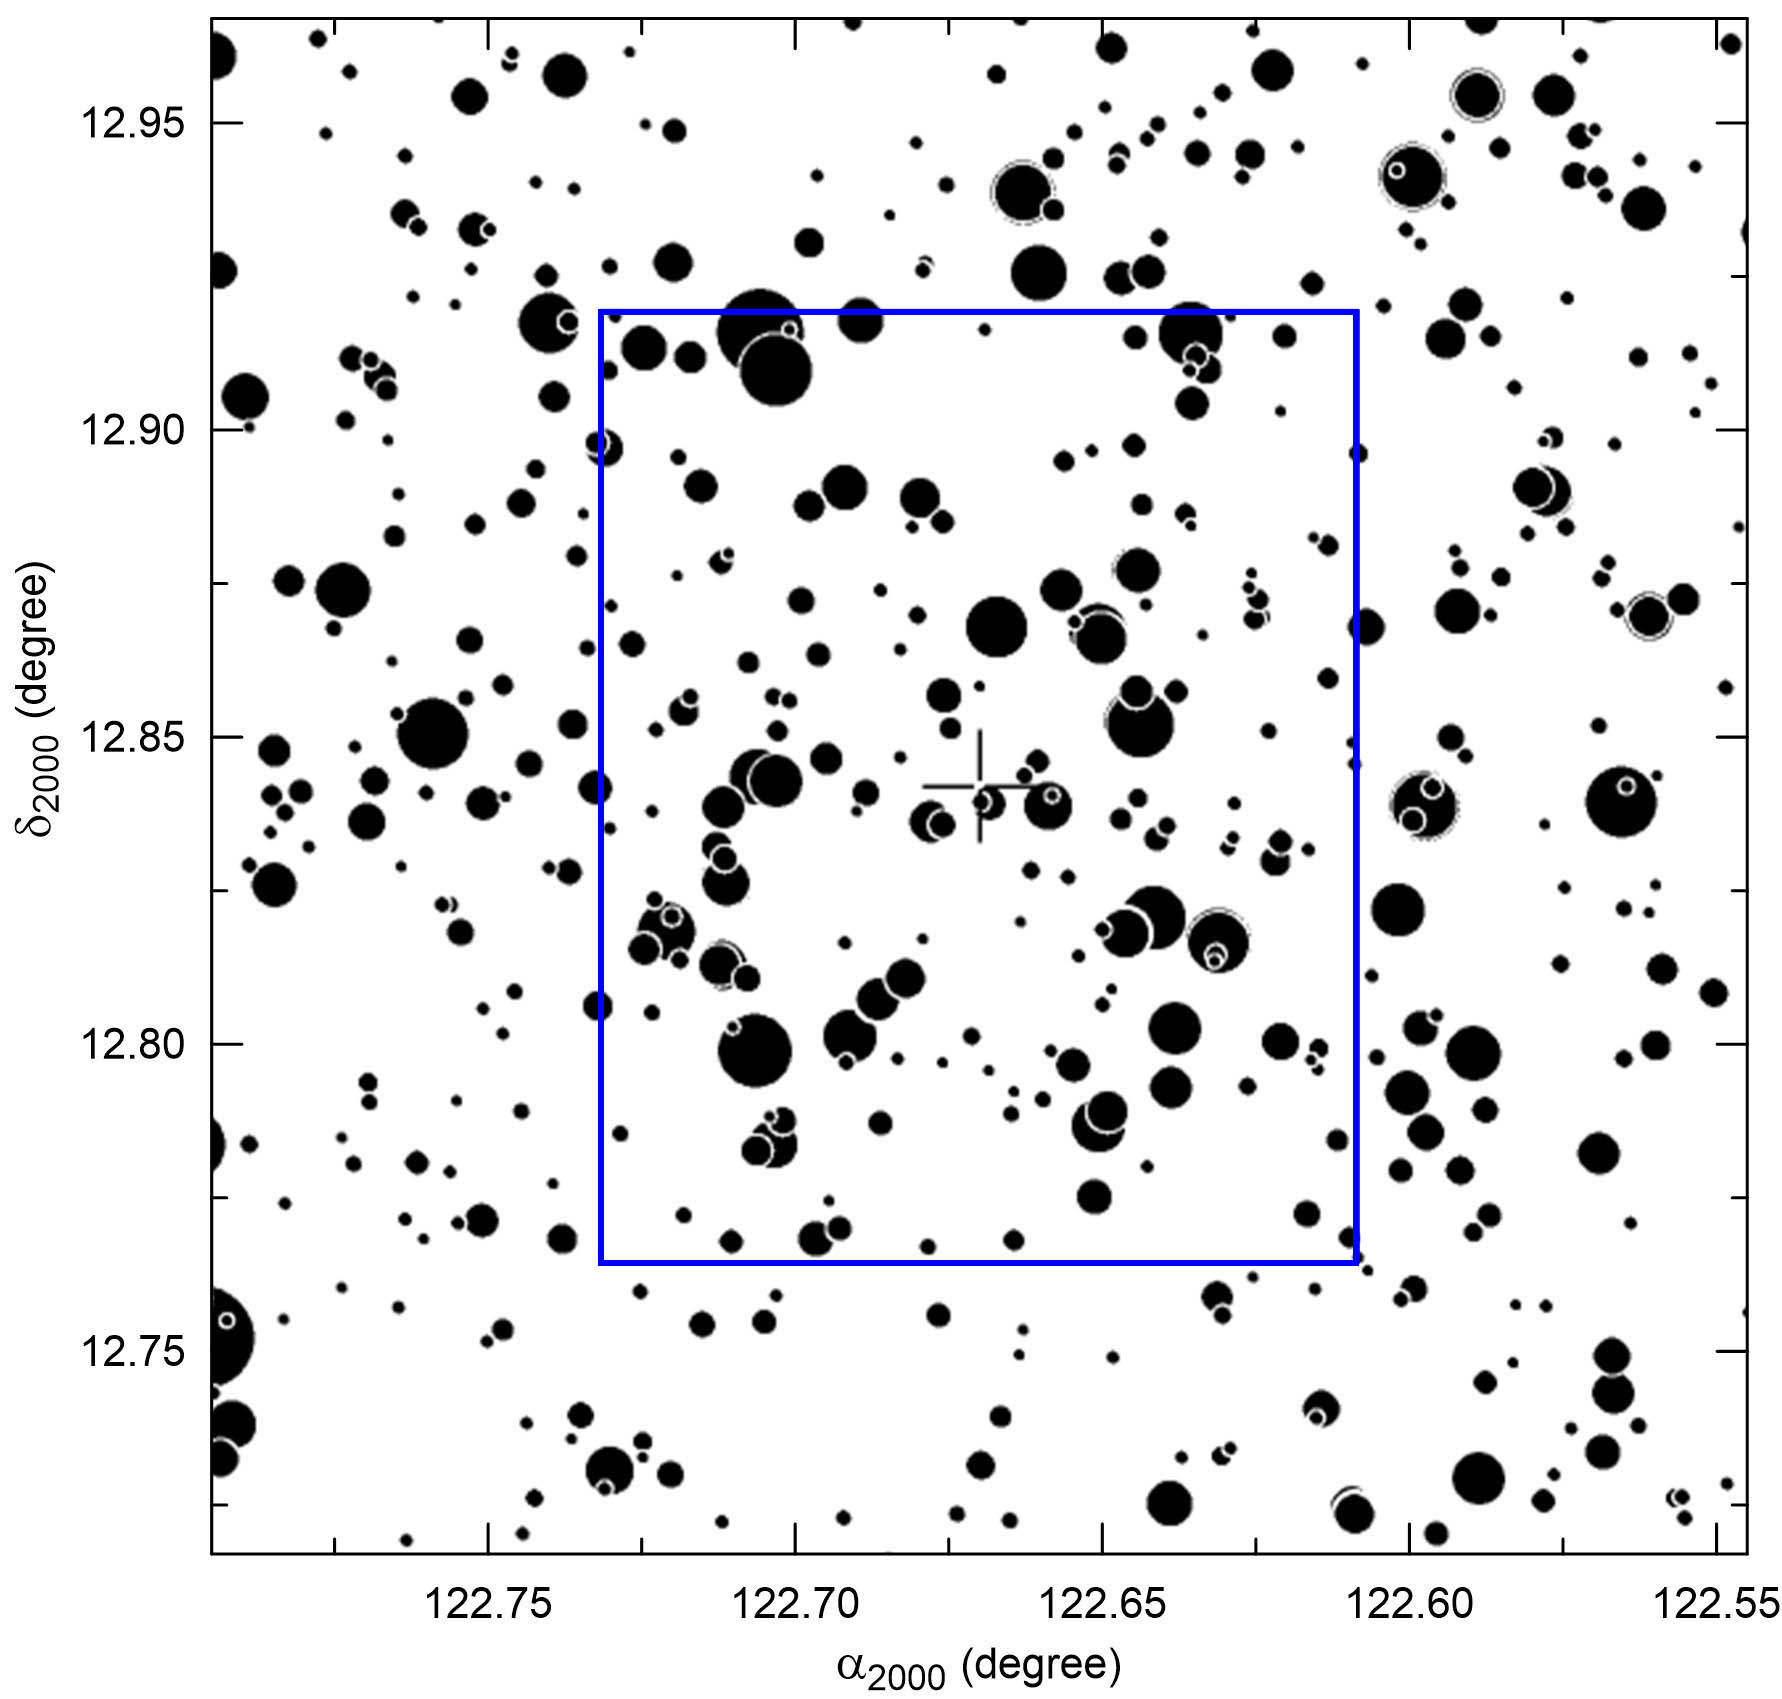
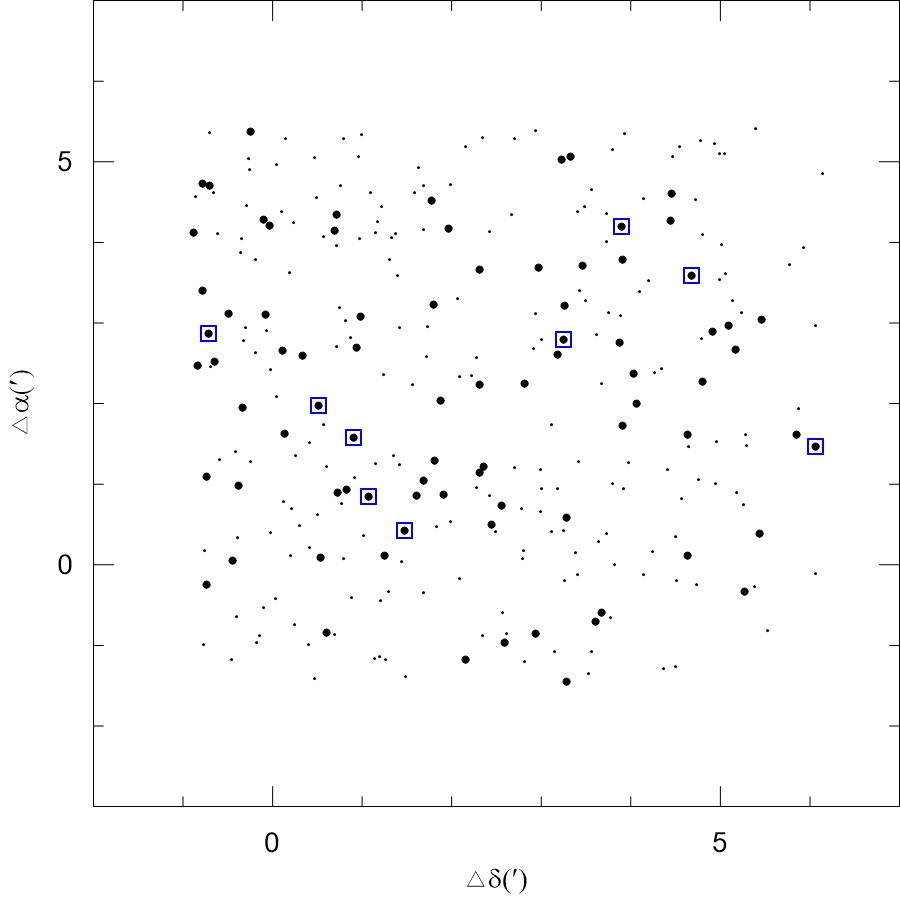
Fig. 1 presents finding charts 666Obtained from https://www.aavso.org (AAVSO) web page of NGC 2323 (x ) and NGC 2539 (x ). The blue rectangles indicate the analysed regions of these OCs, the field of view of the SPMO detector, .
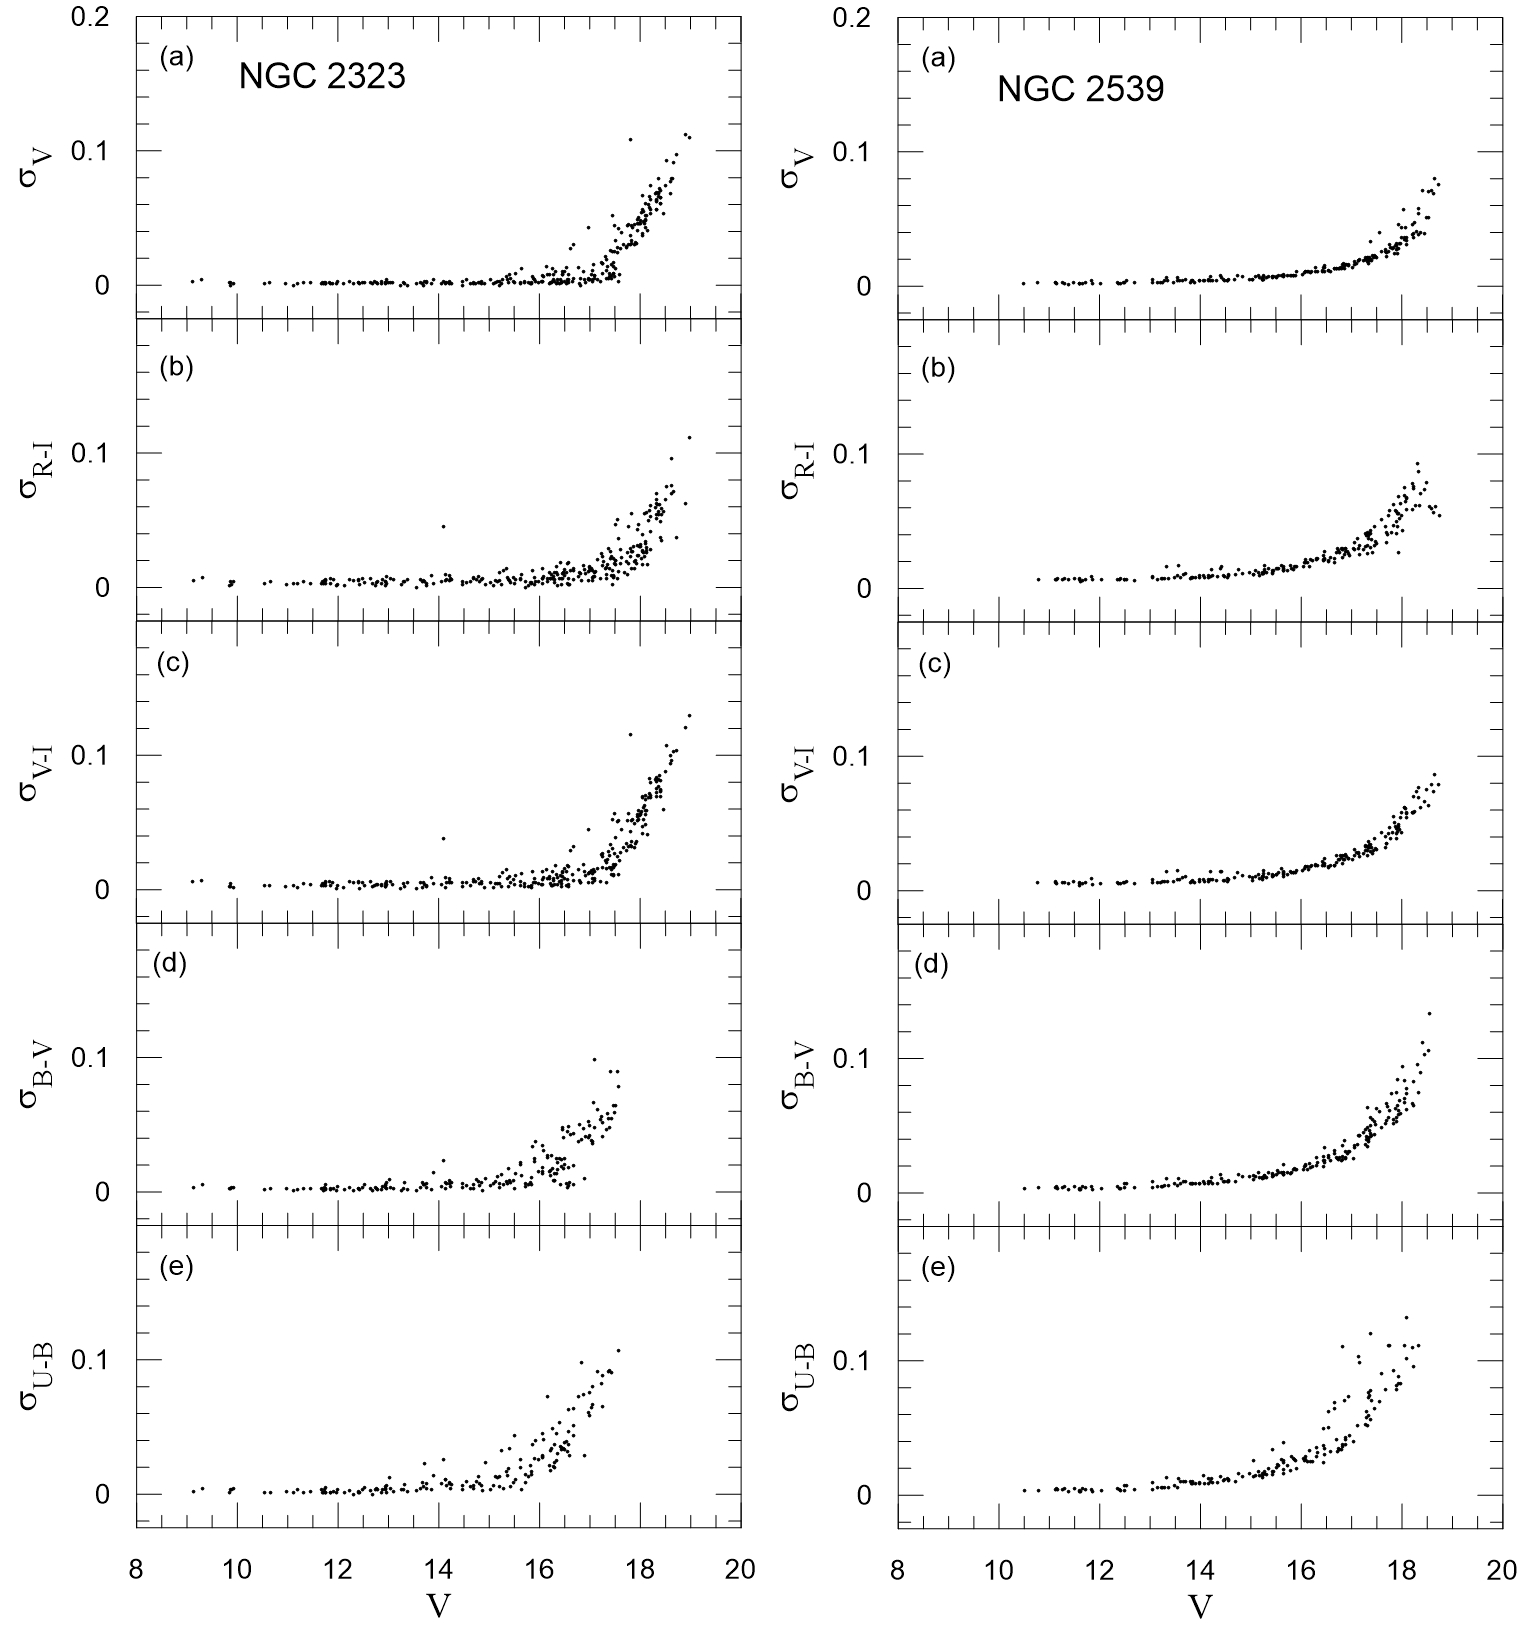
The photometric errors in and colours –, –, –, – of NGC 2323 (left panel) and NGC 2539 (right panel) are presented in Fig. 2. Their mean errors are listed in Table 5. Our inspection of Fig. 2 and Table 5 indicates that stars brighter than have errors smaller than in both magnitudes and colours. For , large errors in – dominate. The stars with have been considered for our analyses.
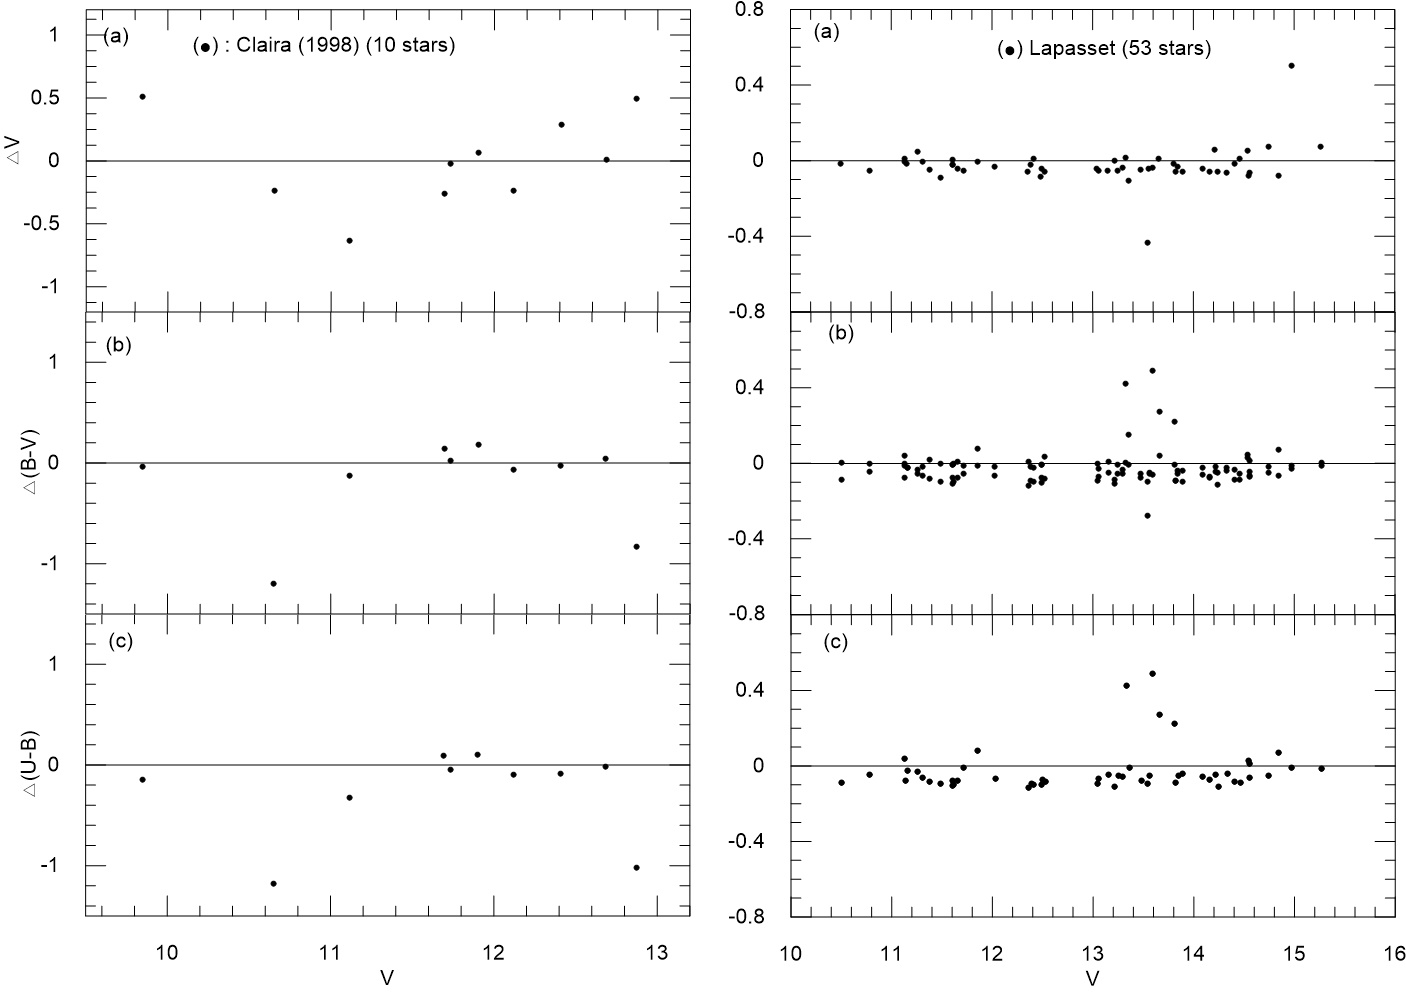
A comparison of the present data with those in the literature for stars in common is done in Fig. 3 for NGC 2323 (left panels) and NGC 2539 (right panels). For the comparisons, we have considered only photoelectric photometry from the literature. For this purpose, a finding chart is shown in Fig. 4 for NGC 2323. The size of filled dots for our CCD UBV photometry is proportional to the magnitudes of stars: – (large dots) and – (small dots). The blue squares show stars with the photoelectric photometry of Claria et al.(1998) for . From the left panels of Fig. 3 (for 10 stars in common), our magnitudes and colours, , –, and –, do not show any systematic trends with the photolectric data of Claria et al.(1998). Three stars with up to = are seen in panel (a), and two stars with large color deviations in and , at and , in panels (b)-(c) of Fig. 3. The magnitudes and colours of Claria et al.(1998) are somewhat fainter and redder than our CCD UBV photometry.
For NGC 2539, the comparison with the photoelectric data of Lapasset (2000) is done for 53 stars in common in the right panels of Fig. 3. For , differences up to in – and – for a few stars indicate that our photometry gives bluer colours than the ones of Lapasset (2000); these 4–5 deviating stars are not easily explained, not by cosmic rays or cosmetic effects in the CCD data, but perhaps by stellar variability or typographical errors of Lapasset (2000).
3 Cluster Membership
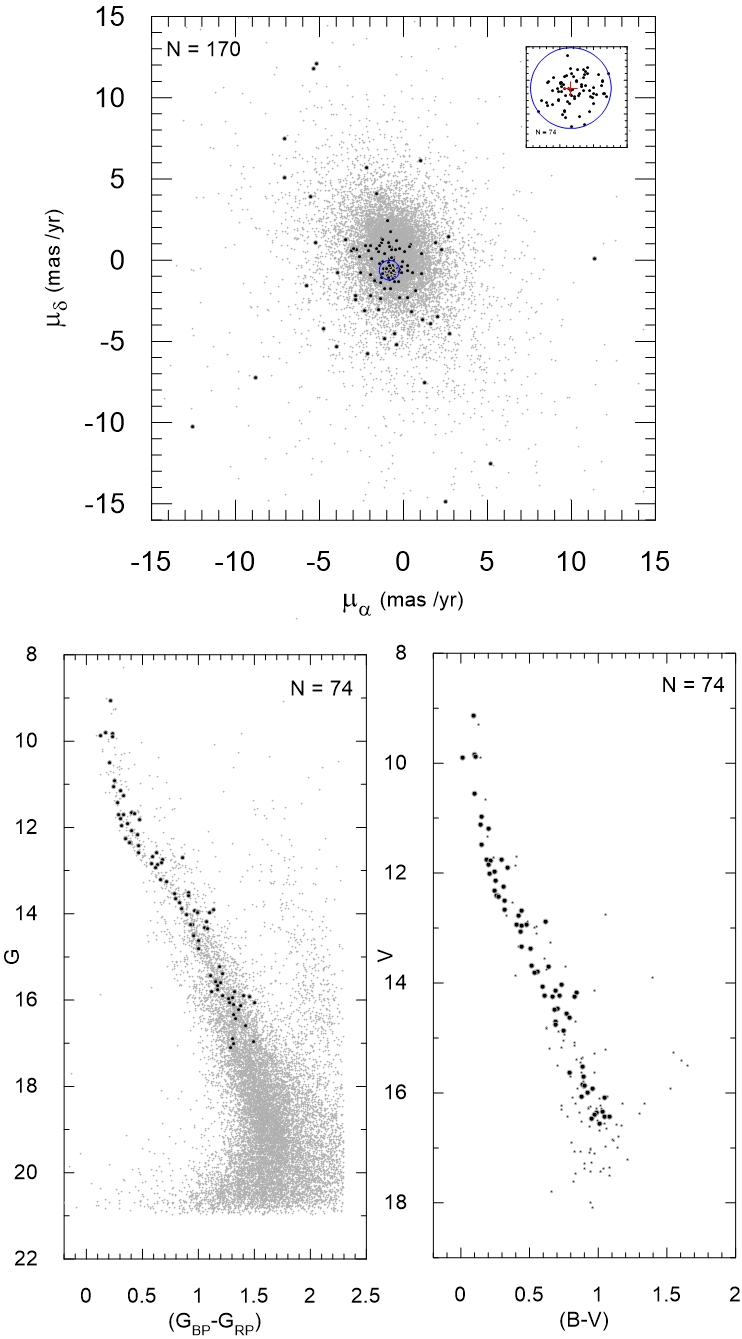
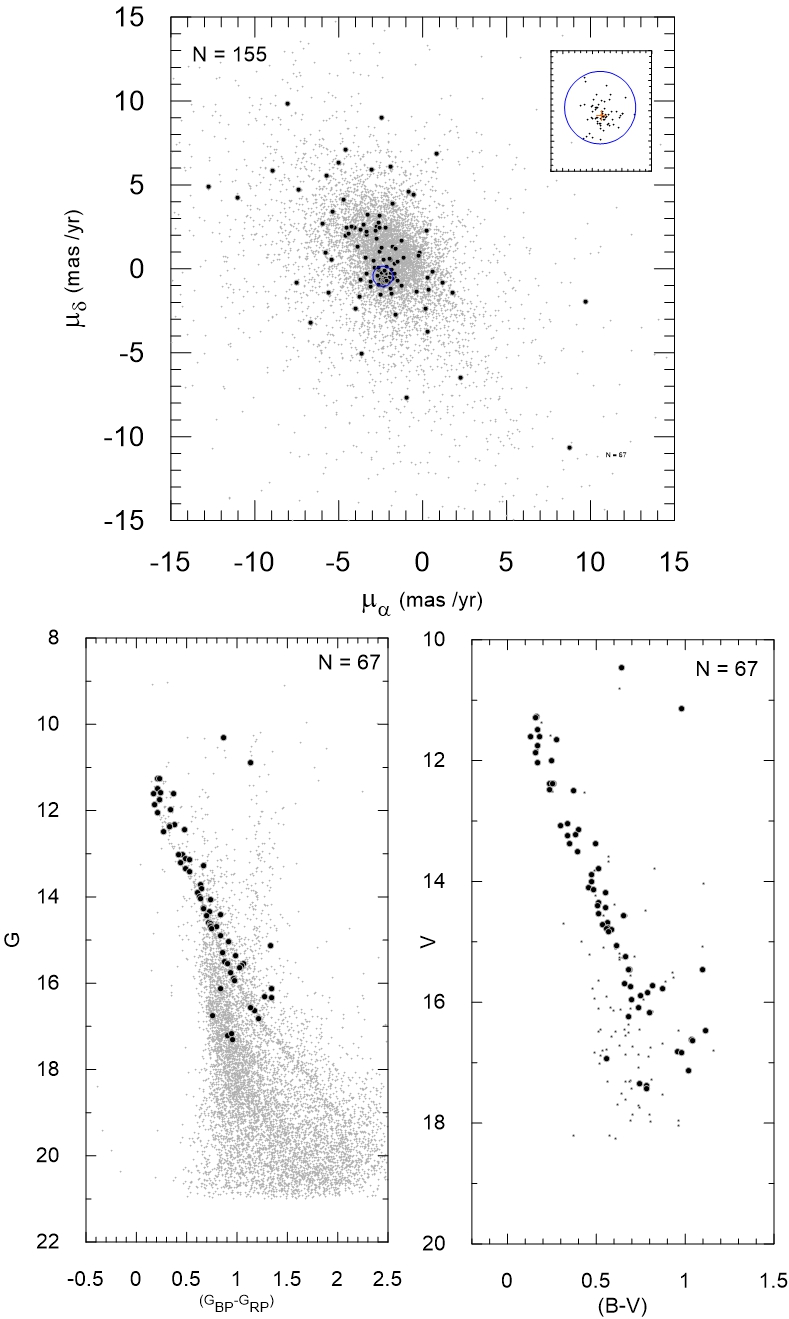
For the separation of the likely cluster members of NGC 2323 and NGC 2539, firstly, CCD photometric data of NGC 2323 (170 stars) and NGC 2539 (155 stars) have been matched with the GaiaDR2 astrometric data (proper motions and parallaxes) from SIMBAD-VizieR777http://vizier.u-strasbg.fr/viz-bin/VizieR. GaiaDR2 astrometric and photometric data of the field stars in a region of arcmin centered on our target OCs have also been considered to determine the cluster’s radii. The versus (Vector Point Diagram, VPD) of the two OCs are plotted in top panels of Fig. 5 for both the background/foreground field stars (small grey dots) and our OCs (filled dots). The proper motion radii (shown with blue circles) of 0.6 mas yr-1 around the centres of their VPDs define the membership criteria. These proper motion radii have been empirically fitted until the likely members inside these radii provide good single stellar sequence on , – and , – plots (bottom panels of Fig. 5). Therefore, the chosen radii are a good compromise for the likely cluster members. These proper motion radii have been constructed via the mathematical equations, and . Here, (x0, y0) are the median values of (, ) (mas yr-1), the radius mas yr-1, and = to . Note that there almost seems to be a clear concentration of stars inside the chosen proper motion radii. The inset plots (Fig. 5) show the likely cluster members inside the proper motion radii of NGC 2323 (74 probable members) and NGC 2539 (67 probable members). The big red pluses indicate the median values of proper motion components of the two OCs.
For the likely members of our OCs, the uncertainties of proper motions and the parallaxes are less than 0.30 mas yr-1 and 0.15 mas, respectively. These limits nearly remain within the uncertainties of the proper motion components of mas yr-1 and mas yr-1, and the uncertainty mas for G 18 mag, which are reported by the Gaia Collaboration, Lindegren et al.(2018) (see their table B.1.).
The median proper motion components plus their equatorial coordinates, found from GaiaDR2 astrometric data for the likely members of our OCs are listed in the parentheses of Table 1. Having applied these proper motion criteria to our OCs, the numbers of the likely cluster members are now appropriate for determining the astrophysical parameters in CC and CMDs.
4 Astrophysical parameters
4.1 Reddenings and photometric metal abundances
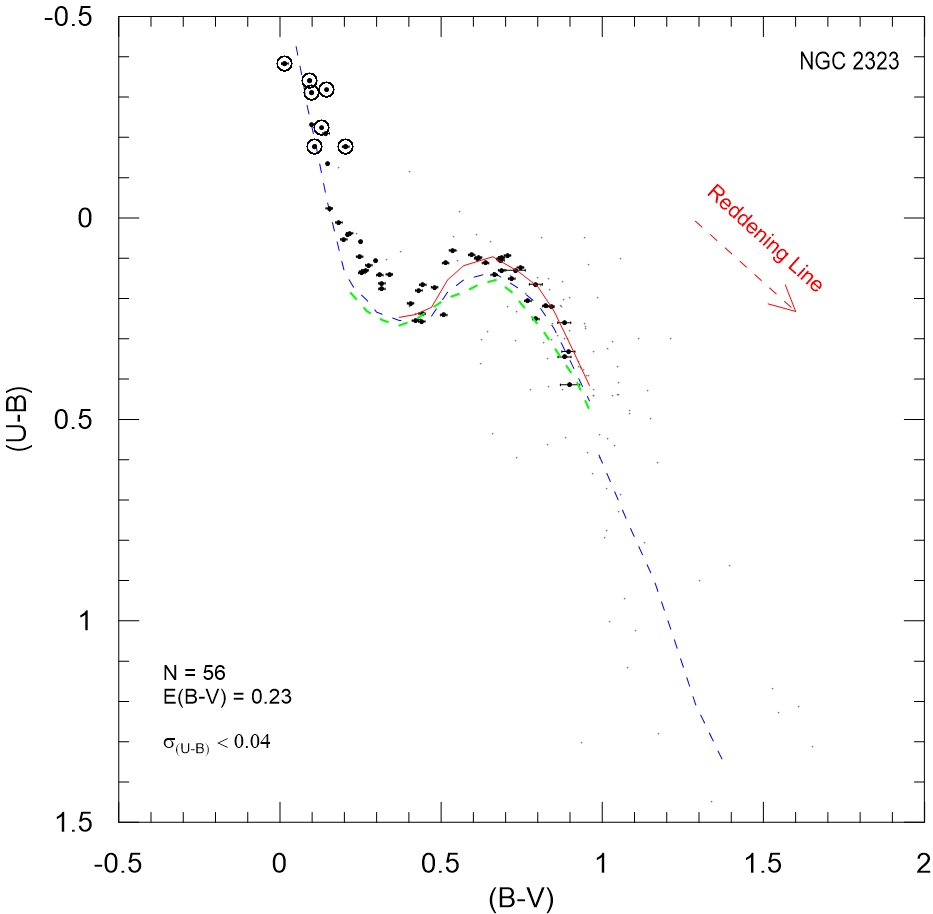
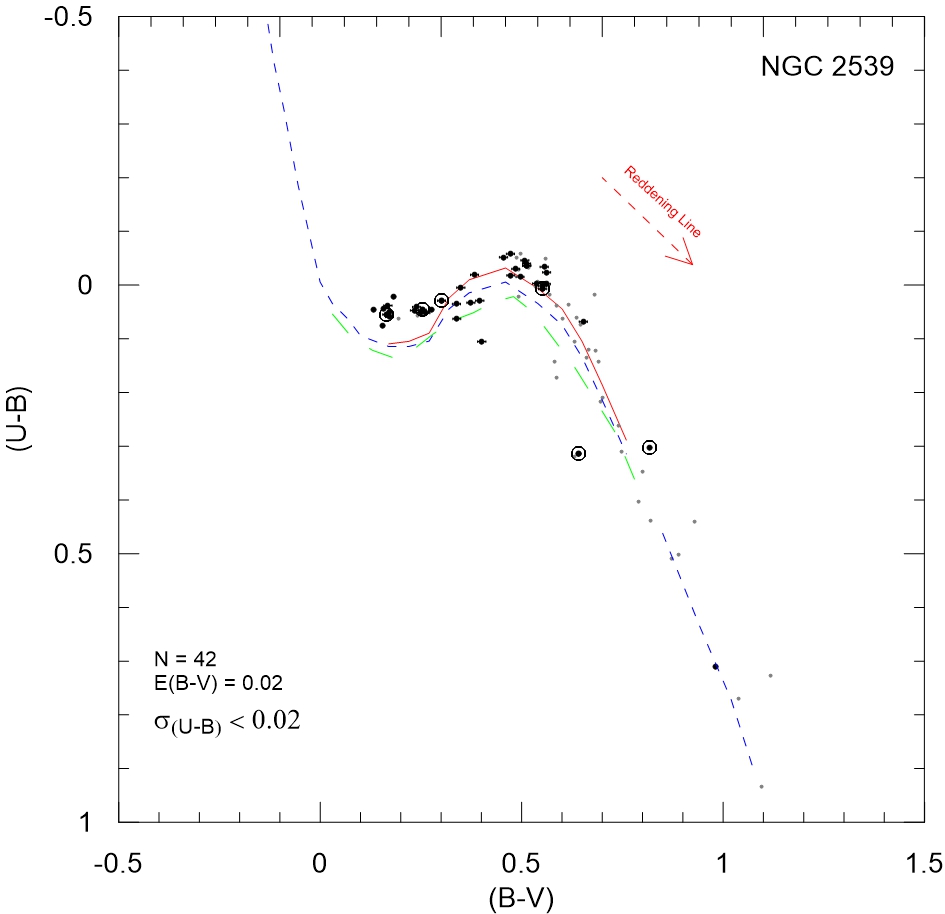
The two colour –, – diagrams of the probable members of NGC 2323 and NGC 2539 are displayed in Figs. 6 and 9. Note that there are 56 (NGC 2323) and 42 stars (NGC 2539) which have – colour. It appears that NGC 2323 contains early-type stars, which are mostly members of young open clusters. By using 11 early type stars with 0 (Fig. 6), the mean interstellar reddening is estimated as = 0.230.04 from Q–technique of early-type stars. The reddened intrinsic-colour sequence of the Schmidt-Kaler (SK82) (blue curve) for this is fitted on the CC of NGC 2323. For this, we adopt the following relations of Johnson and Morgan (1953) : ––, and –. Here E, ––– and –––. The interstellar reddening, of NGC 2539 is derived from displacement of the intrinsic-colour sequences of dwarfs and red giants from Schmidt-Kaler (1982)(SK82) in the CC diagram (Fig. 9), until the best fit to the cluster members has been achieved: along the (U-B) axis by 0.72 E(B–V)+0.05E(B–V)2 and along the axis by .
F-type stars on the CC plots of these two OCs show ultraviolet excess, – above Hyades main sequence (MS) (green dashed curve), which are quite valuable for determining photometric metal abundance, . Here, –––. By shifting the Hyades main-sequence according to the E(B-V)’s (col. 2 of Table 6), a fit is applied to the F-type stars, the same as used to fit the RC/RG stars to the SK82 giant colours. The best fit of iso-metallicity curves as representative of the mean metal abundances of the two OCs are shown as red solid lines in CC diagrams (Figs. 6 and 9). The average –, –, – colours (cols. 3–5 of Table 6) have been fixed as mean values from the distribution of the F-type stars in each cluster. By using these average values, the ultraviolet excesses, – have been measured, and normalized to – via the data of Table 1A given by Sandage (1969). We use , by Karataş & Schuster (2006) to estimate photometric metallicity values ([M/H]) of the two OCs. With the equation , their [M/H] values are converted into the heavy-element abundance mass fraction, . The solar metal content is adopted as . The mean values, –, –, and of the two OCs are listed in cols. 6–9 of Table 6.
The – values from extinction maps given by Schlegel et al.(1998) (SFD) (based on the IRAS 100-micrometer surface brightness converted to extinction) have been obtained from NASA EXTRAGALACTIC DATABASE (NED) as – and 0.032 for NGC 2323 and NGC 2539, respectively. Taking into consideration their distances d (kpc) (Cols. 3 of Tables 7–8) and Galactic latitudes (Col. 5 of Table 1), the final reddening, –, for a given star is reduced compared to the total reddening – by a factor , given by Bahcall & Soneira (1980), where , , and are the Galactic latitude, distance and scale-height. These reduced – values are 0.13 (NGC 2323) and 0.02 (NGC 2539). Here we adopted H125 pc (Bonifacio et al.2000).
| Cluster | – | – | – | – | – | [M/H] | ||
|---|---|---|---|---|---|---|---|---|
| NGC 2323 | 0.230.04 | 0.48 | +0.01 | 0.03 | 0.04 | 0.044 | -0.10 | 0.012 |
| NGC 2539 | 0.020.06 | 0.51 | 0.06 | 0.03 | 0.03 | 0.031 | -0.31 | 0.007 |
4.2 Distance moduli, distances and ages
For the determination of distances and ages of the two OCs, we have used the PARSEC isochrones of Bressan et al.(2012) for values which correspond to . Here, Y0.2485+1.78Z. The PARSEC isochrones of Bressan et al.(2012) are over-plotted in four CMD’s: –, –, –, – (Figs. 7–8 and Figs. 10–11). The –, –) and –) colour excesses are converted from the relations ––, –– (Dean et al.1978, Mathis 1990 and Straiz̧ys 1995) and –– (Bragaglia et al.2018). A visual extinction of – is applied to the absolute visual magnitudes of the isochrones.
The PARSEC isochrones are first shifted both vertically and horizontally on the CMDs according to the interstellar reddening values of –, –, –, and –). Then the PARSEC isochrones have been shifted vertically to obtain the best fit to the observed main sequence, as well as the RC sequence. This vertical shift gives the (true) distance modulus, –. The distance moduli (–) and distances, d(kpc), for the two OCs are presented in Cols. 2–3 of Tables 7–8.
For the determination of the ages (A, log(A)) of these OCs, the isochrones of PARSEC, selected according to their values, have been shifted both vertically and horizontally in the CMD’s with the expression –, for the vertical displacement and , for the horizontal, where denotes the wavelengths of the various passbands. Here C0 means de-reddened colour index. Then the age of the isochrone is varied until a satisfactory fit to the data has been obtained through the observed main-sequence (MS), turn-off (TO), sub-giant (SG) and RG/RC sequences. The derived ages are given in Cols. 4–5 of of Tables 7–8.
To appreciate the uncertainties of the distance moduli and ages, additional PARSEC isochrones have usually been over-plotted in each CMD. The best fit is shown by red solid line, whereas, the uncertainties are represented by gray solid lines. The photometric uncertainties of colour indices are indicated in bottom left of CC and CMD plots.
For comparisons with the literature, we have taken into consideration mostly those physical parameters given by our – colour indices, because the astrophysical parameters of these OCs are mostly given, and best represented, in terms of the CMD: ,– (Table 11).
5 Results
| Colour | – | d (kpc) | log(A) | A (Gyr) |
|---|---|---|---|---|
| – | 10.000.10 | 1.000.05 | 8.300.10 | 0.200.05 |
| – | 09.900.15 | 0.960.07 | 8.300.15 | 0.200.08 |
| – | 09.900.15 | 0.960.07 | 8.300.15 | 0.200.08 |
| – | 09.800.10 | 0.910.04 | 8.350.10 | 0.200.06 |
5.1 NGC 2323
From 11 early type stars with – in Fig. 6, the reddening – of NGC 2323 is determined. As is seen from Table 11, this reddening value is quite consistent with the literature values, ––0.28, within the uncertainties. Our reddening value and the literature values are larger than –. NGC 2323’s – gives the photometric abundance of () from the CC diagram (Fig. 6).
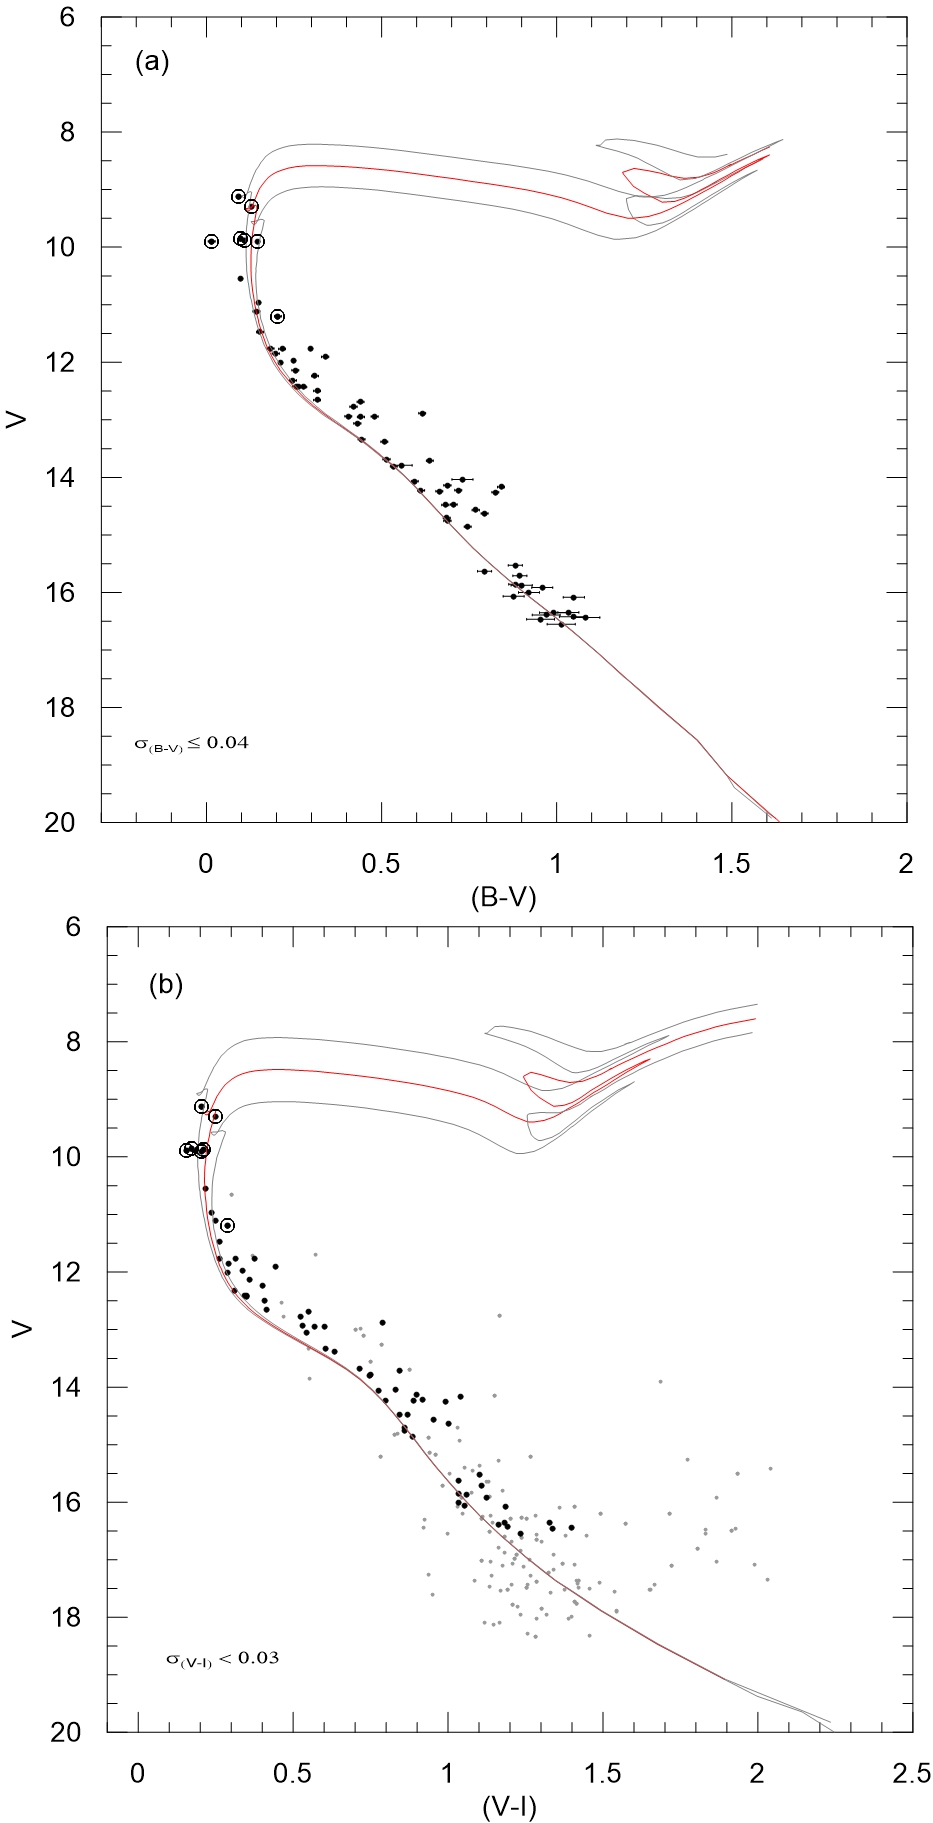
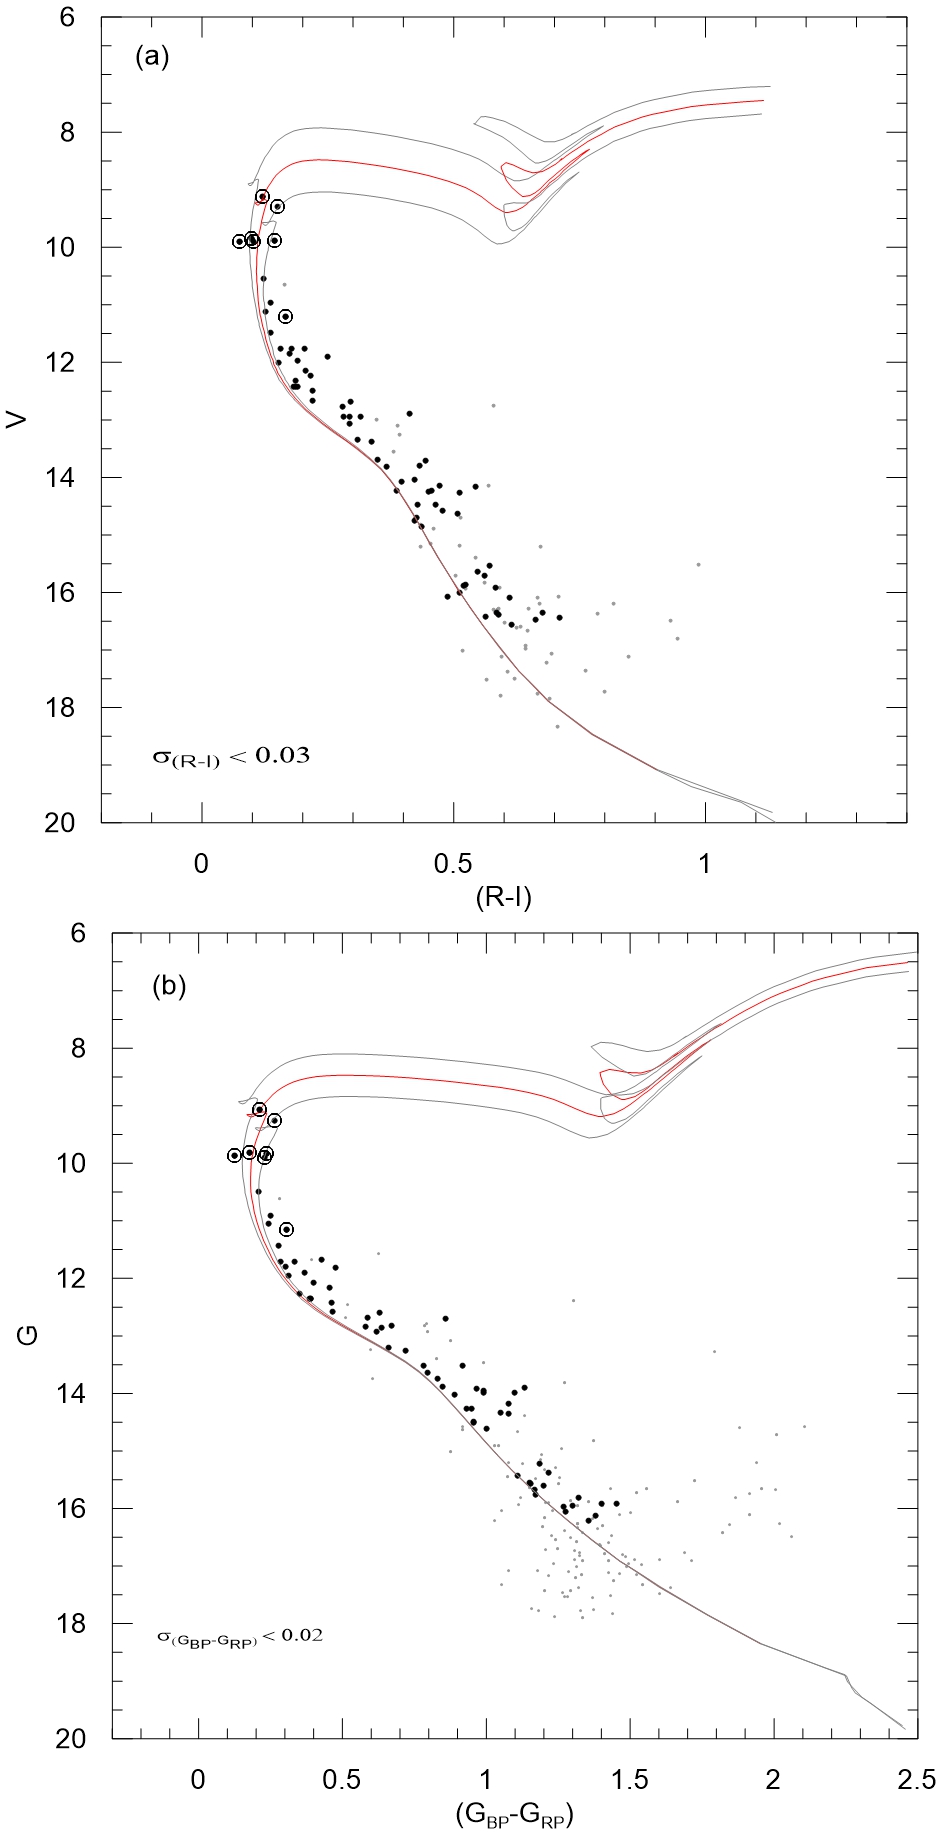
From the CMDs for the colour indices –, –, – and –) (Figs. 7–8), values for the distance moduli, distances, and ages together with their uncertainties for NGC 2323 are presented in Table 7. The 200 Myr PARSEC isochrone with fits well the main sequence for all colour indices. No evolved stars are seen in the CMDs of NGC 2323. The PARSEC isochrones fit well the evolutionary sequences, as is seen from the CMDs. We derived the distance modulus and distance as (–, d(kpc))=(10.000.10, 1.000.05), by fitting the PARSEC isochrones to the – diagram (Fig. 7(a)). The differences with the literature are at a level of –– mag and – kpc. Our age value is somewhat older than the age range of 100–140 Myr in the literature (Table 11). This is to be expected since we used instead of the solar metal abundance. The distance modulus and distance of this OC are in agreement with the literature values (Table 11). Note that some authors of the literature do not give their uncertainties.
Our CCD photometric data of NGC 2323 contain seven definite early-type members, according to the SIMBAD data-base. The GaiaDR2 parallaxes/distances plus UBV photometry of these seven definite members are listed in the top rows of Table 10. These are also marked as big circles in the CC and CMDs (Fig. 6 and Figs. 7–8). Our photometric distances of –, –, –, and –) provide good agreement with the Gaia DR2 distances (Col. 7, Table 10) within their uncertainties.
5.2 NGC 2539
A reddening value, – for NGC 2539 (Fig. 9) is derived. Within the uncertainties, this value is in good coherent with the ones of the literature (Table 11). The reduced – value for this OC is in good agreement with our reddening value. NGC 2539’s – gives the photometric abundance of () from the CC diagram (Fig. 9).
| Colour | – | d (kpc) | log(A) | A (Gyr) |
|---|---|---|---|---|
| – | 10.000.04 | 1.000.02 | 8.950.05 | 0.890.11 |
| – | 10.000.10 | 1.000.05 | 8.950.10 | 0.890.23 |
| – | 10.000.10 | 1.000.05 | 8.950.10 | 0.890.23 |
| – | 10.100.10 | 1.000.05 | 8.950.10 | 0.890.23 |
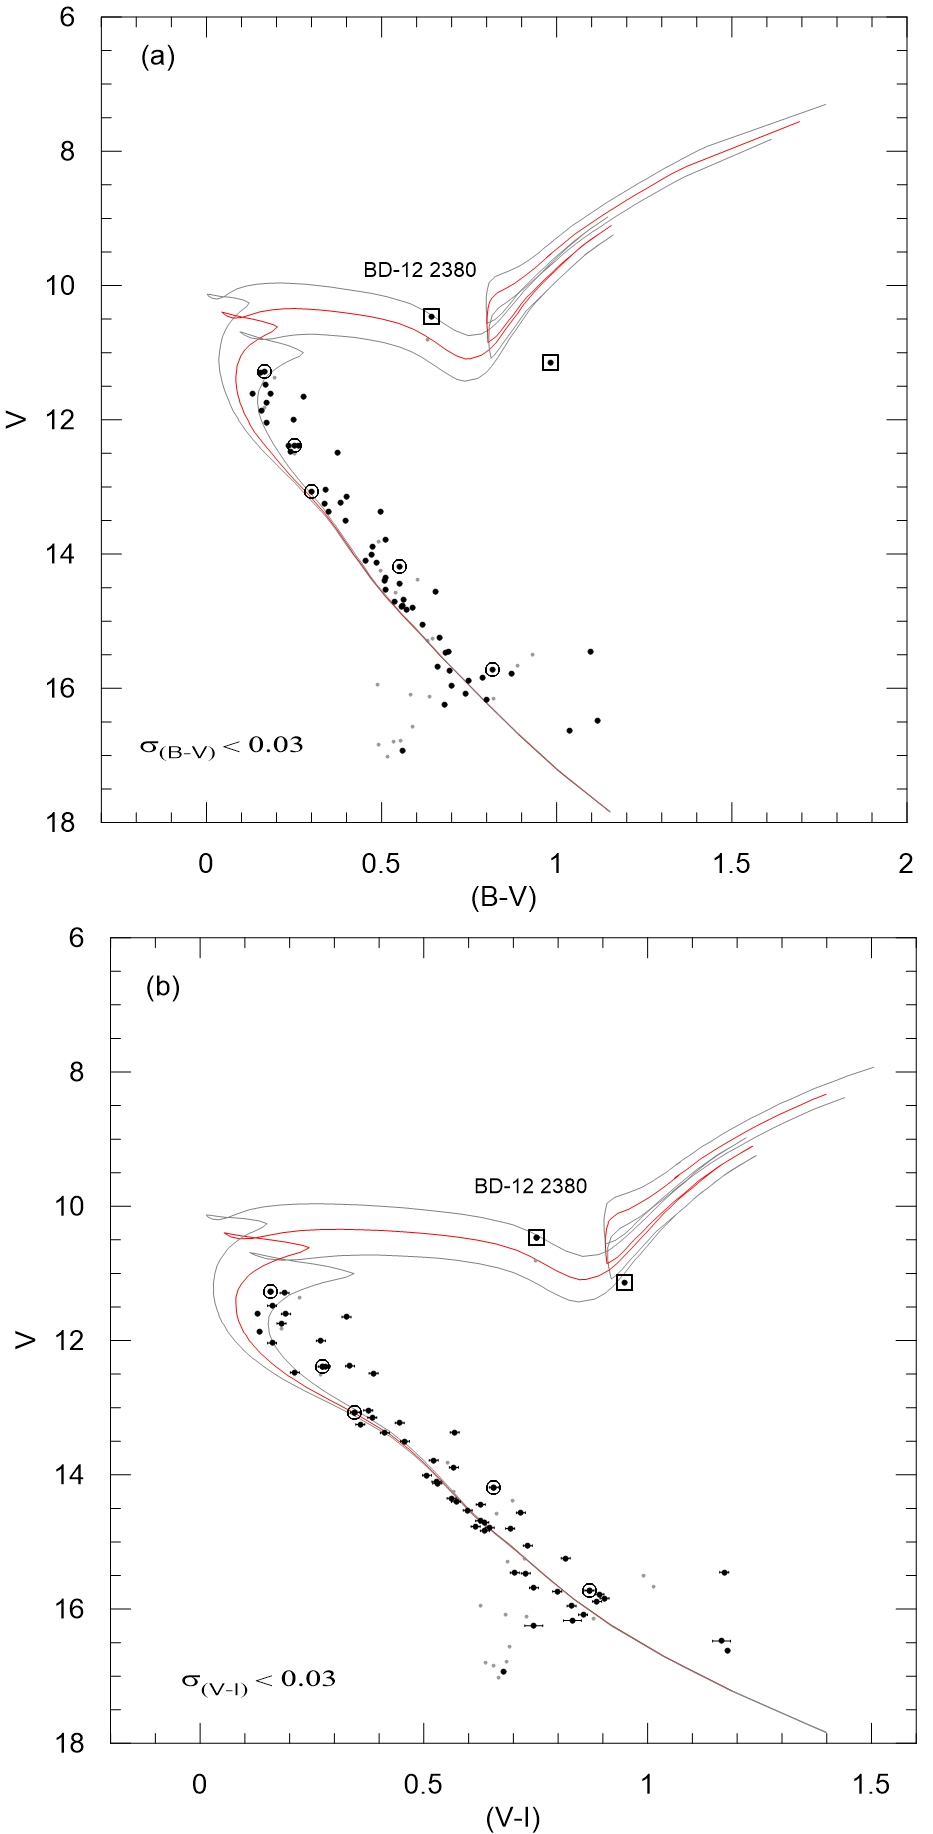
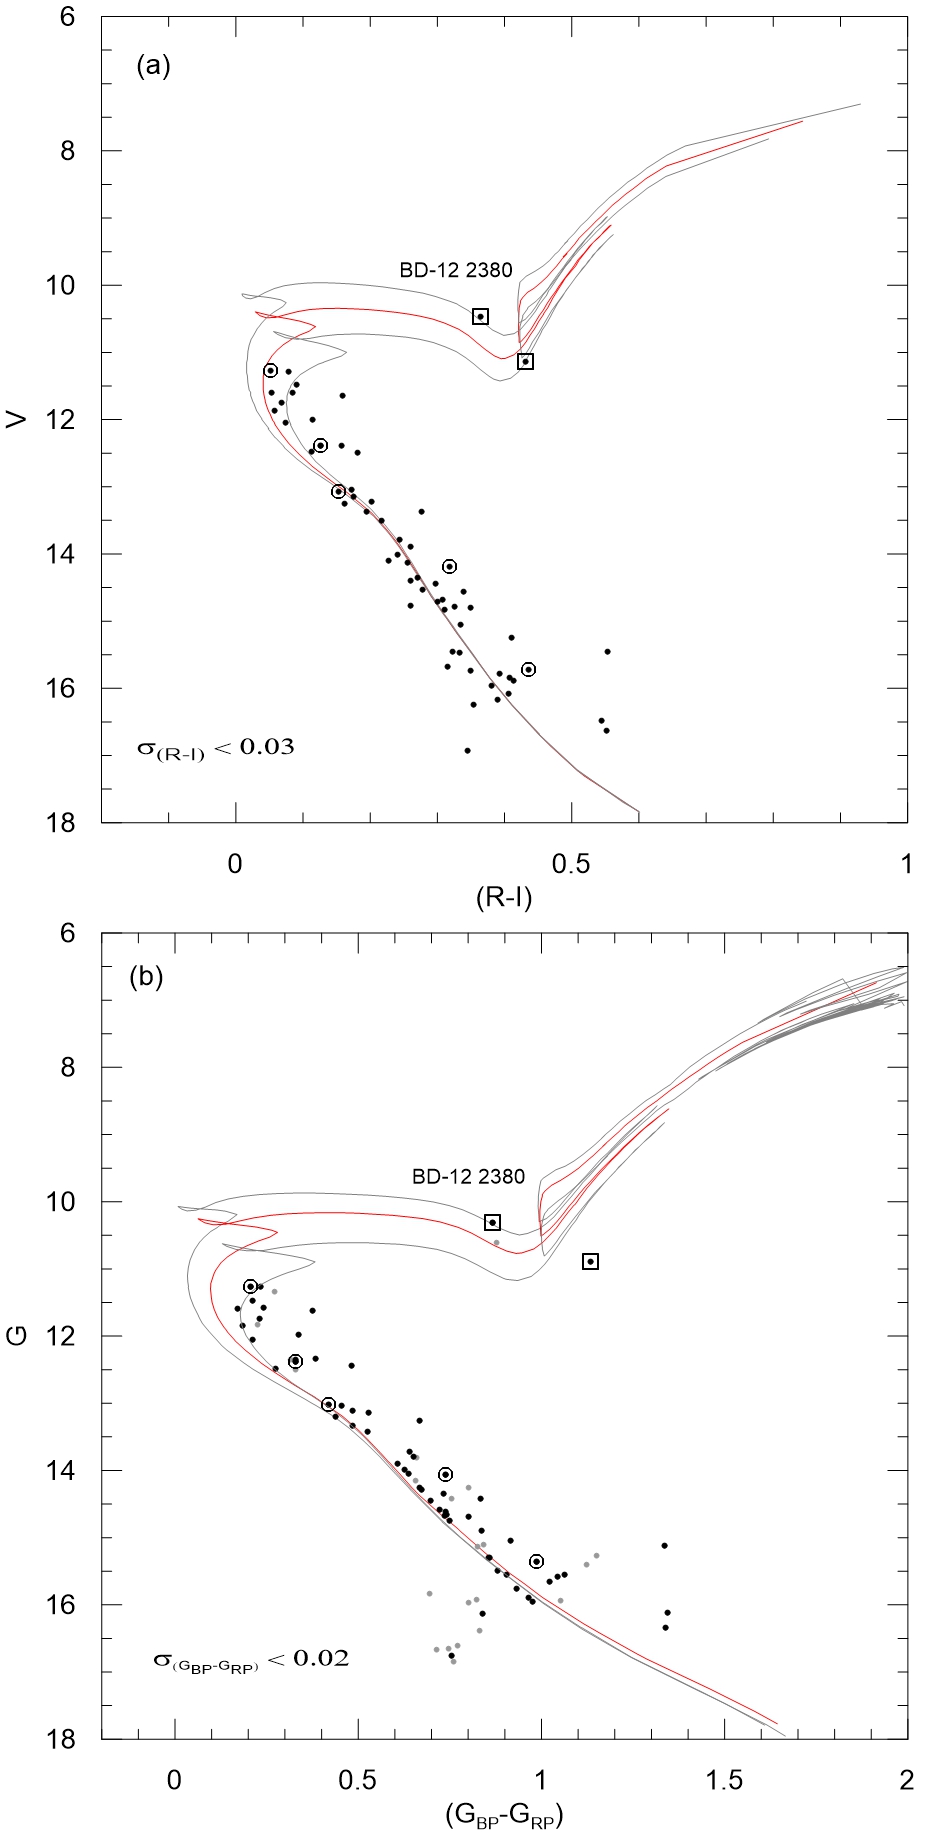
The CMDs for the colour indices –, –, –, –) of NGC 2539 are presented in panels (a)–(b) of Figs. 10–11. The isochrone with fits well the main sequence for all colour indices. The derived fundamental parameters together with their uncertainties from these CMDs have been given in Table 8. For the – colour, our values and (kpc) are in good concordance with the ones of the literature within the uncertainties (Table 11). The differences with the literature for NGC 2539 are at a level of – mag and kpc. Our age value 0.890.11 Gyr (890 Myr) for NGC 2539 seems to be slightly older than the age range of 540–640 Myr of the literature (Table 11).
No RC/RG candidates are detected in the CMDs of NGC 2323 because of its younger age ( Gyr). Note that the possible RC/RG candidates in the CMDs of NGC 2539 (square dots, Figs. 10–11). One of them is named BD-12 2380, according to the SIMBAD data-base. One can expect to detect this possible RC/RG star in the central part of NGC 2539, depending on its age ( Gyr). For the this giant candidate, from the – and – CM diagrams (square dot, panels (a)–(b) of Fig. 10), we have utilised the distance criteria for its membership as a initial test. In the case of the possible RG candidates, the RG candidates will not necessarily give the right distances to these clusters since their apparent magnitudes will depend on their position along the RG branch.
For the case of a possible RC candidate, its distances have been estimated from the mean absolute magnitudes of , (Twarog et al.1997) and (Groenwegen 2008), and listed in Table 9 together with its equatorial coordinates plus its magnitudes of and . For the estimates, the total absorption relations of – and – (Gim et al.1998), are included, with the – value of NGC 2539. The magnitudes of and in Columns 3–4 of Table 9 are used for estimating the and distances. These distances are estimated as kpc and kpc. The giant candidates within 1- agreement of the uncertainties of and from the main-sequence fitting (Table 8) have been assigned as members, “M”, otherwise as non-members “NM” (Columns 7–8 of Table 9). The giant star, BD-12 2380 which fulfills both the and distances within its uncertainties is a definite member of NGC 2539. Its GaiaDR2 distance, kpc () mas is close to the photometric distances of Tables 8–9.
The other giant candidate does not seem to be RC candidate due to its location, –(11.144, 0.982) in the CMDs (square dot, Figs.10–11). Its GaiaDR2 distance pc ( mas) is not close to the photometric distance, 1000 pc of Table 8.
From TO and RC/RG sequences on the CMDs of NGC 2539, for BD-12 2380 RC/RG candiate, we have determined its morphological age index (MAI). For this, and indices given by Phelps et al.(1994) are determined within its CMDs. Here, is the magnitude difference between the TO and RC stars, , and is the difference in the colour indices between the bluest point on the main sequence at the luminosity of the TO and the colour at the base of RG branch one magnitude brighter than the TO luminosity, ––. We measured the values of from its RC candidate, and then converted into by means of the equation of of Phelps et al.(1994). The photometric values obtained are listed at bottom of Table 9. With the aid of its photometric metal abundance, its morphological age is determined from the equation, of Salaris et al.(2004). The estimated MAI age is listed in the bottom line of Table 9 (Cols. 7–8) together with its uncertainty. The age difference between the MAI and isochrone techniques is ( Gyr). These quite small differences indicate good consistency between the techniques.
The GaiaDR2 parallaxes/distances plus photometry of six definite members which belong to NGC 2539, according to SIMBAD-database are listed in the bottom rows of Table 10. Differences fall in the range of = 200–456 pc between the 1000 pc value of all colours (Table 8) and the ones of GaiaDR2 (Col. 7; Table 10). In the sense their distances of these six definite members are not close to the photometric distances of NGC 2539 of four colour indices within the uncertainties.
| RA | DEC | I | V | (kpc) | (kpc) | (test) | (test) |
| 122.71 | -12.88 | 9.71 | 10.462 | 0.950.05 | 0.910.09 | M | M |
| 122.64 | -12.86 | 10.20 | 11.144 | 0.960.06 | 1.230.14 | M | NM |
| VTO | VRC | (B-V)TO | (B-V)RC | log A | A (Gyr) | ||
| 11.40 | 10.70 | 0.08 | 0.89 | 0.73 | 0.81 | 9.040.05 | 1.090.27 |
| Star-ID | Star No | V | (U-B) | (B-V) | d | |
| NGC 2323 | ||||||
| 228 | HD 52965 | 9.13 | -0.34 | 0.09 | 1.0040.042 | 99642 |
| 163 | BD-08 1703 | 9.30 | -0.22 | 0.13 | 1.1700.045 | 85533 |
| 256 | BD-08 1700 | 9.85 | -0.31 | 0.10 | 0.9140.047 | 109456 |
| 402 | BD-08 1695 | 9.88 | -0.18 | 0.11 | 0.9670.046 | 103449 |
| 359 | BD-08 1696 | 9.90 | -0.38 | 0.02 | 1.0080.047 | 99246 |
| 70 | BD-08 1708 | 9.90 | -0.32 | 0.14 | 0.9510.060 | 105266 |
| 105 | HD 52980B | 11.20 | -0.18 | 0.20 | 1.0230.041 | 97839 |
| NGC 2539 | ||||||
| 37 | BD-12 2380 | 10.46 | 0.31 | 0.64 | 0.8330.047 | 120070 |
| 168 | BD-12 2373 | 11.28 | 0.06 | 0.16 | 0.7130.063 | 1403120 |
| 234 | V0691Pup | 12.39 | 0.05 | 0.25 | 0.7960.048 | 125680 |
| 122 | V0693Pup | 13.07 | 0.03 | 0.30 | 0.7820.038 | 127960 |
| 98 | V0694Pup | 14.18 | 0.01 | 0.55 | 0.6870.034 | 145670 |
| 79 | V0695Pup | 15.72 | 0.30 | 0.82 | 0.7300.050 | 137090 |
| Cluster | E(B-V) | – | d(kpc) | Age (Myr) | log A | Z | Isochrone | Photometry | Ref. |
| NGC 2323 | 0.230.04 | 10.000.10 | 1.000.05 | 20050 | 8.30 | 0.012 | Bressan et al.(2012) | CCD UBVRI | This work |
| 0.230.06 | 10.000.15 | 1.000.07 | 14020 | 8.15 | solar | Yi et al. (2001); | UBV; CFHT | 1 | |
| - | - | - | 11520 | 8.06 | solar | Bressan et al.(2012) | UBV; CFHT | 1 | |
| 0.23 | - | 0.895 | 100 | 8.00 | - | - | - | 2 | |
| 0.25 | 9.85 | 1.00 | 140 | 8.15 | 0.019 | Girardi et al.(2000) | Various broadband photometries | 3 | |
| 0.28 | 10.46 | 1.1070.07 | - | 8.30 | 0.019 | Girardi et al.(2002) | 2MASS JH | 4 | |
| 0.20 | 10.50 | 0.95 | 100 | 8.00 | 0.020 | Bertelli et al.(1994) | CCD UBV | 5 | |
| 0.22 | 10.000.17 | 1.000.08 | 130 | - | 0.020 | Ventura et al.(1998) | BV with CFHT12Mosaic camera | 6 | |
| 0.250.05 | 9.86 | 0.94 | 10020 | 8.00 | 0.020 | Bertelli et al.(1994) | Photoelectric UBV | 7 | |
| 0.257 | - | - | - | - | - | - | Stromgren | 8 | |
| - | - | 0.9970.057 | - | - | - | - | GaiaDR2 astrometry | 9 | |
| NGC 2539 | 0.020.06 | 10.000.04 | 1.000.02 | 890110 | 8.95 | 0.007 | Bressan et al.(2012) | CCD UBVRI | This work |
| 0.060.03 | 10.200.10 | 1.100.05 | 630 | 8.80 | 0.019 | Girardi et al.(2000) | CCD UBVI | 10 | |
| 0.06 | 10.42 | 1.21 | 630 | 8.80 | 0.020 | Schaller et al.(1992) | photoelectric UBV | 11 | |
| 0.080.02 | 10.100.30 | 1.050.15 | 540 | 8.73 | 0.030 | Hejlesen (1980) | photoelectric UBV | 12 | |
| 0.080.02 | 09.800.50 | 0.910.21 | 64080 | 8.81 | 0.016 | Mermilliod (1981) | CCD DDO, CMT1T2, UBV | 13 | |
| 0.100.05 | 10.500.50 | 1.290.29 | - | - | - | - | photoelectric UBV | 14 | |
| - | - | 0.7540.064 | - | - | - | - | GaiaDR2 astrometry | 9 |
-
(1):Cummings, J et al. (2016), AJ, 818, 84; (2):Paunzen & Netopil (2014); (3): Frolov, V. N. et al. Ast. Lettr., (2012), 38,74; (4): Bukowiecki, L. et al. (2011), Acta Astronomica, 61, 231; (5): Sharma, S. et.al. (2006), AJ, 132, 1669; (6): Kalirai, J.S. et.al. (2003), AJ, 126, 1402 ;(7):Claria, J.J. et.al. (1998), A&ASS, 128, 131;(8) :Schneider, H., (1987), A&ASS, 71, 531; (9): Cantat-Gaudin, T. et.al. (2018), Astronomy and Astrophysics, 618, 93; (10):Choo, K.J. et.al. (2003), A&A, 399, 99; (11):Lapasset, E. et.al. (2000), A&A, 361, 945 ;(12):Joshi&Sagar, (1986), Bull.Astr. Soc. India, 14, 95; (13):Claria&Lapasset (1986), ApJ, 302, 656; (14):Pesch (1961), ApJ, 134, 602.
6 Discussions and Conclusions
The reddenings of – of NGC 2323 and – of NGC 2539 are quite consistent with the ones of the literature (Table 11). The reddening differences with the literature are at a level of 0.00–0.05 for NGC 2323 and 0.04–0.08 for NGC 2539. For the – colour, distance moduli and distances of NGC 2323 and NGC 2539 are (–, (pc)) = (10.000.10, 100050) and (–, (pc)) = (10.000.04, 100020), respectively. The differences with the literature, derived using the – colour, are at a level of – mag and (kpc)–0.11 for NGC 2323. These differences for NGC 2539 are at a level of – mag and (kpc) –0.29. In the sense our detections are in good concordance with the values of the literature within the uncertainties (Table 11). For four colour indices (Tables 7–8), the values of (–, (kpc)) are 9.80–10.00 and 0.91–1.00 kpc for NGC 2323, and 10.00 and 1.00 kpc for NGC 2539, respectively, which are in agreement with each other and the literature values (Table 11).
The median GaiaDR2 parallax (=0.9980.136 mas) of NGC 2323 (74 likely members) provides pc. This value is also similar to the photometric ones (910–1000 pc) (Table 7), and also in good agreement with the distances of the literature (Table 11). For NGC 2539 (N=67 likely members), the median GaiaDR2 parallax =0.7510.139 mas measures pc, which is reasonably close to our 1000 pc value (Table 8) within the uncertainties. For NGC 2539, the literature values are not as close to each other: mas (d 1.10 kpc) and mas (d 1.29 kpc). Our median parallaxes are similar to the values 0.9970.057 mas (NGC 2323) and 0.7540.064 mas (NGC 2539) of Cantat-Gaudin et al.(2018) (Table 11).
Our age value (20050 Myr) of NGC 2323 is somewhat older than the age range of 100140 Myr in the literature (Table 11). This occurs because we estimated from the ultraviolet excess (Fig.6), instead of assuming the solar metal abundance. Likewise our estimated age, 890110 Myr for NGC 2539 is somewhat older than the age range 540–640 Myr of the literature (Table 11). The works of Joshi & Sagar (1986), Claria & Lapasset (1986), Choo et al.(2003) and Lapasset (2000) use different isochrones (Col. 8 of Table 11), and the differences in ages with respect to our values result from their usage of solar/different abundances with these isochrones. This work uses the abundance, which has been obtained from the – value of Fig.9. The morphological age of NGC 2539 (the MAI method) of the one probable RC star (Table 9) has been determined as 1.090.27 Gyr. This MAI age is quite compatible with its isochrone age (0.89 Gyr; Table 8).
The giant star, BD-12 2380 appears to be a definite member of NGC 2539 (square dot, Figs. 10–11) since the distances of =95050 pc and =91090 pc for filters (Table 9) are in harmony with the photometric distance 100020 pc (Table 8) within the uncertainties. However, its GaiaDR2 distance pc () mas is not close to the photometric distance of NGC 2539. The other giant candidate’s GaiaDR2 distance is pc ( mas) but is not close to the photometric distance of NGC 2539. In the sense this may be a field giant. For further confirmation of its membership, spectroscopic observations are needed.
Acknowledgments
The observations of this publication were made at the National Astronomical Observatory, San Pedro Mártir, Baja California, México, and we wish to thank the staff of the observatory for their assistance during these observations. We thank H.Cakmak for useful helps on the manuscript. This research made use of the WEBDA open-cluster database of J.-C. Mermilliod; also the SIMBAD data-base. This work has been supported by the CONACyT (México) projects 33940, 45014, and 49434, and PAPIIT-UNAM (México) projects IN111500 and IN103014. This paper has made use of results from the European Space Agency (ESA) space mission Gaia, the data from which were processed by the Gaia Data Processing and Analysis Consortium (DPAC). Funding for the DPAC has been provided by national institutions, in particular the institutions participating in the Gaia Multilateral Agreement. The Gaia mission website is http://www.cosmos.esa.int/gaia.
References
- [1] Akkaya İ., Schuster W. J., Michel R., Chavarría-K C., Moitinho A., Vázquez R. and Karataş Y., 2010, Rew Mex, 46, 385 (A10)
- [2] Akkaya Oralhan, I., Karataş, Y., Schuster,W.J., Michel, R., and Chavarría C., 2015, New A, 34, 195 (A15)
- [3] Bahcall, J.N., and Soneira, R.M., 1980, ApJ, 238, 17
- [4] Bertelli, G., Bressan, A., Chiosi, C., Fagotto, F., and Nasi,E. 1994, A&AS, 106, 275
- [5] Bonifacio, P., Monai, S., and Beers, T. C. 2000, AJ, 120, 2065
- [6] Bragaglia, A., Fu, X., Mucciarelli, A., Andreuzzi, G., Donati, P. 2018, A&A, 619, 176
- [7] Bressan A., Marigo, P., Girardi L., Salasnich, B., Dal Cero, C., Rubele, S., Nanni, A., 2012, MNRAS, 427, 127
- [8] Bukowiecki Ł., Maciejewski, G., Konorski, P., Strobel, A., 2011, Acta Astron., 61, 231
- [9] Caetano, T.C., Dias, W.S., Lépine, Monteiro, H.S., Moitinho, A., Hickel, G.R., Oliveira, A.F., 2015, New A, 38, 31
- [10] Cantat-Gaudin, T., Jordi, C., Vallenari, A., Bragaglia, A., Balaguer-Nunez, L., Soubiran, C., Bossini, D., Moitinho, A., Castro-Ginard, A., Krone-Martins, A., and 3 coauthors., 2018, A&A, 618, 93
- [11] Cardelli, J.A., Clayton G.C., Mathis, J.S., 1989, ApJ, 345, 245
- [12] Choo, K. J., Kim, S.-L., Yoon, T. S., Chun, M.-Y., Sung, H., Park, B.-G., Ann, H. B., Lee, M. G., Jeon, Y.-B., Yuk, I.-S., 2003, A&A, 399, 99
- [13] Claria, J. J., Lapasset, E., 1986, ApJ, 302, 656
- [14] Claria, J. J., Piatti, A. E., Lapasset, E., 1998, A&AS, 128, 131
- [15] Cummings, J.D., Kalirai, J.S., Tremblay, P.-E., Ramirez-Ruiz, E., 2016, ApJ, 818, 84
- [16] Cutri, R., et al., 2003, All-Sky Catalogue of Point Sources, CDS/ADC Electronic Catalogues 224
- [17] Cutri, R.M. et al., 2013, yCat, 2328, 0C.
- [18] Dean, J.F., Warren, P.R., Cousins, A.W.J., 1978, MNRAS, 183, 569
- [19] Dias, W.S., Alessi, B.S., Moitinho, A., Lépine J.R.D., 2002, A&A, 389, 871
- [20] Frolov, V. N., Ananjevskaja, Yu. K., Polyakov, E. V., 2012, AstL, 38, 74F
- [21] Gaia Collaboration: Brown,A.G.A, Vallenari, A., Prusti, T., de Bruijne, J.H.J., et al., 2016, A&A, 595, A2
- [22] Gaia Collaboration: Brown, A. G. A., Vallenari, A., Prusti, T. et al., 2018, A&A, 616, 1G
- [23] Gaia Collaboration: Lindegren, L., Hernandez, J., Bombrun, A., Klioner, S. et al., 2018, A&A, 616, A2
- [24] Gim, M., Vandenberg, D.A., Stetson, P., Hesser, J., Zurek, D.R., 1998, PASP, 110, 1318
- [25] Girardi, L., Bressan, A., Bertelli, G., Chiosi, C., 2000, A&AS, 141, 371
- [26] Girardi, L., Bertelli, G., Bressan, A., Chiosi, C., Groenewegen, M. A. T., Marigo, P., Salasnich, B., Weiss, A., 2002, A&A, 391, 195
- [27] Groenewegen, M.A.T., 2008, A&A, 488, 935
- [28] Hejlesen, P. M., 1980, A&AS, 39, 347
- [29] Joshi, U. C., Sagar, R., 2002, BASI, 14, 95
- [30] Johnson, H.L., Morgan, W.W., 1953, ApJ, 117, 313
- [31] Kalirai, J.S., Fahlman G.G., Richer, H.B., Ventura, P., 2003, AJ, 126, 1402
- [32] Karataş, Y., Schuster W.J., 2006, MNRAS, 371, 1793
- [33] Kharchenko, N.V., Piskunov, A.E., Schilbach, E., Röser, S., Scholz, R.D., 2013, A&A, 558, 53
- [34] Landolt, A.U., 2009, AJ, 137, 4186
- [35] Lapasset, E., Claria, J. J., Mermilliod, J.-C., 2000, A&A, 361, 945
- [36] Lynga, G., Computer Based catalogue of Open Cluster Data, 5th. Ed. (Strassbourg: CDS, 1987)
- [37] Mathis, J. 1990, ARA&A, 28,37
- [38] Mermilliod, J. C., 1981, A&AS, 44, 467
- [39] Moitinho, A., 2010, Star clusters: basic galactic building blocks, Proceedings IAU Symposium No.266, eds. R.de Grijs and J.R.D. Lepine
- [40] Paunzen, E., Netopil, M., Maitzen, H. M., Pavlovski, K., Schnell, A., Zejda, M., 2014, A&A, 564, 42
- [41] Pesch, P., 1961, ApJ, 134, 602
- [42] Phelps, R.L., Jane,s K.A., Montgomery, K.A., 1994, AJ, 107, 1079
- [43] Roeser, S., Demleitner, M., Schilbach, E., 2010, AJ, 139, 2440
- [44] Salaris, M., Weiss, A., Percival, S.M., 2004, A&A, 414, 163
- [45] Sandage, A., 1969, ApJ, 158, 1115
- [46] Schaller, G., Shaerer, D., Meynet, G., Maeder, A., 1992, A&AS, 96, 269
- [47] Schlegel, D.J., Finkbeiner, D. P., and Davis, M., 1998, ApJ, 500, 525
- [48] Schneider, H., 1987, A&AS, 71, 531
- [49] Schmidt-Kaler, Th. 1982, in Landolt-Bornstein, Numerical Data and Functional Relationships in Science and Technology, New Series, Group VI, Vol.2b, eds. K. Schaifers and H. H. Voigt (Berlin: Springer), p. 14 (SK82)
- [50] Schuster, W. J., Michel, R., Dias, W., Tapia-Peralta, T., Vázquez, R., Macfarland J., Chavarría, C., Santos, C., and Moitinho, A. 2007, Galaxy Evolution Across the Hubble Time, eds. F. Combes and J. Palou, Proceedings of the International Astronomical Union, IAU Symposium No. 235,(Cambridge, United Kingdom: Cambridge University Press), p. 331
- [51] Sharma, S., Pandey, A. K., Ogura, K., Mito, H., Tarusawa, K., Sagar, R., 2006, AJ, 132, 1669
- [52] Skrutskie, M.F., Cutri, R., Stiening, R., Weinberg, M.D., Schneider, S.E., Carpenter, J.M., Beichman, C., Capps, R., 2006, AJ, 131, 1163
- [53] Stetson P. B., 1987, PASP, 99, 191
- [54] Straiz̧ys, V. 1995, Multicolor Stellar Photometry, Astronomy and Astrophysics Series, Vol. 15, ed. A. G. Pacholczyk (Tucson, Arizona: Pachart Pub. House)
- [55] Tapia, M. T., Schuster, W. J., Michel, R., Chavarría-K, C., Dias, W. S., Vázquez, R., andMoitinho, A., 2010, MNRAS, 401, 621 (T10)
- [56] Twarog, B.A., Ashman, K.M., Anthony-Twarog, B.J., 1997, AJ, 114, 2556
- [57] van Dokkum P. G., 2001, PASP, 113, 1420
- [58] Ventura, P., Zeppieri, A., Mazzitelli, I., & D’Antona, F., 1998, A&A, 334, 953
- [59] Yi, S., Demarque, P., Kim, Y.-C., Lee, Y.-W., Ree, C.H., Lejeune, T., Barnes, S., 2001, ApJ, 136, 417
- [60] Zacharias, N., Finch, C.T., Girard, T.M. et al., 2013, AJ, 145, 44