Disentangling planets from photoelectric instability
in gas-rich optically thin dusty disks
Abstract
Structures in circumstellar disks such as gaps and rings are often attributed to planets. This connection has been difficult to show unequivocally, as other processes may also produce these features. Particularly, a photoelectric instability (PEI) has been proposed, operating in gas-rich optically thin disks, that generates structures predicted by planet–disk interactions. We examine the question of how to disentangle planetary effects on disk structure from the effects of the PEI. We use the Pencil Code to perform 2D global hydrodynamical models of the dynamics of gas and dust in a thin disk, with and without planetary perturbers. Photoelectric heating is modeled with an equation of state where pressure is proportional to dust surface density. The drag force on grains and its backreaction on the gas are included. Analyzing the situation without PEI, we find that gas–dust interactions alter the shape of the planetary gap from the dust-free case when the local dust-to-gas ratio approaches unity. This result applies also to primordial disks, because dust drifting inwards accumulates at the edge of the planetary gap, and any initial dust-to-gas ratio eventually achieves if the dust reservoir is sufficient. We find a result particular to high dust-to-gas ratio disks as well: as dust drifts inwards, the dust front becomes a sharp transition, and the backreaction triggers the Rossby wave instability. When PEI is included, we find that it obscures structures induced by planets unless the planet’s mass is sufficiently large to carve a noticeable gap. Specifically, the instability generates arcs and rings of regular spacing: a planet is discernible when it carves a dust gap wider than the wavelength of the PEI.
Subject headings:
planet–disk interactions — debris disks — exoplanets1. Introduction
Exoplanets form and dwell in disks of gas and dust, which show rings, spirals, and other patterns in optical (Grady et al., 2013; Konishi et al., 2016; Hornbeck et al., 2016), infrared (Currie & Kenyon, 2009; Benisty et al., 2015; Currie et al., 2014, 2016), and sub-millimeter images (Andrews et al., 2011; Dong et al., 2017; Muto et al., 2012; Dong et al., 2015; Dong & Dawson, 2016). Planets orbiting in disks perturb them gravitationally, creating similar patterns to those observed (Kley & Nelson, 2012) that have in turn been used to infer the presence of hidden planets and constrain their properties (e.g. Kuchner & Holman, 2003; Chiang et al., 2009; Dong et al., 2016; Dong & Fung, 2017; Dipierro & Laibe, 2017; Hord et al., 2017). A planet has been observed within the gap of the transition disk around PDS 70 (Müller et al., 2018; Keppler et al., 2018), a disk that indeed shows several of the features predicted by planet–disk interaction, validating the approach of using disk features as signposts for planets.
Yet, our understanding of disk processes and planet–disk interaction is not complete. The dynamics of planet–disk interaction are usually modeled in the dust-free or gas-free limits. The former (e.g. Kley & Nelson, 2012) is applicable to primordial disks, where gas dominates the dynamics, entraining the dust grains seen in optical and infrared images. The latter (e.g. Kuchner & Holman, 2003) is applicable to debris disks, where dust dominates the dynamics. But as disks evolve from gas-rich toward sparse, gas-free systems like our own solar system, they inevitably pass through a phase when they become optically thin, and the gas-to-dust mass ratio drops to the range of 0.1–1. In this phase, the disk physics becomes more complex, because dust grains and gas molecules both interact with stellar photons, and both gas and dust play an important role dynamically due to their similar total masses. (Klahr & Lin, 2005; Besla & Wu, 2007). This phase corresponds to young debris disks and to certain regions of every transitional and pre-transitional disk.
Over the past two decades, studies have shown that gas indeed is a common component of many debris disks (e.g. Chen & Jura, 2003; Redfield, 2007; France et al., 2007; Roberge & Weinberger, 2008; Moór et al., 2011; Welsh & Montgomery, 2013; Riviere-Marichalar et al., 2014; Moór et al., 2015; Lieman-Sifry et al., 2016; Marino et al., 2016; Hales et al., 2017; Marino et al., 2017). The bulk of the gas may be metals, or it may be molecular hydrogen, which is much more difficult to detect (Thi et al., 2001). The origin of the gas in these disks is a matter of continued debate. It is either leftover primordial gas, or it is produced from solid debris by photodesorption (Grigorieva et al., 2007) or collisions (Czechowski & Mann, 2007), processes that should occur in every debris disk at some level.
We have only just begun to understand which processes dominate in gas-rich optically thin disks, the nature of the hydromagnetic turbulence (Kral & Latter, 2016), the instabilities that can arise, and how these processes can affect the morphology of these disks. As a matter of fact, gap carving by a planet, a problem long benchmarked (de Val-Borro et al., 2006), has never been studied in the regime of dust-to-gas ratio close to unity. Gap carving is relatively well understood for gas-rich primordial disks, for which the dust back reaction can usually (but not always) be ignored as the dust-to-gas ratio is close to the interstellar value ().
In this case, gas is cleared away by planetary torques, and viscous torques tend to fill the gap (Kley & Nelson, 2012, and references therein). It is also relatively well understood for gas-free debris disks, as objects are cleared away by eccentricity pumping at resonances, leaving the planet neighborhood following the so-called Tisserand tails (e.g. Zhu et al., 2014). Yet, when both gas and dust are dominant, gap carving may deviate significantly from these idealized cases. This leads to the first question we pose: what happens to a disk gap when dust is added to the point that the gas drag backreaction changes the torques acting to close the gap?
A second question we pose, that depends on understanding the first, is related to the combined effect of the gravitational potential of a planet and a dynamical instability in gas-rich optically thin disks. The instability, suggested by Klahr & Lin (2005); Besla & Wu (2007), is affected by the combined operation of two dynamical processes. First, if the disk is optically thin, stellar UV photons eject electrons from dust grains, heating the gas (Kamp & van Zadelhoff, 2004; Jonkheid et al., 2004; Zagorovsky et al., 2010). Second, the hot gas provides a local pressure maximum that concentrates the dust grains (Whipple, 1972), establishing a positive feedback process. In just a few orbital periods, this photoelectric instability (PEI) can radically reshape the disk structure. In the first 2D and 3D models of this instability, Lyra & Kuchner (2013) found that the PEI would concentrate power in high wavenumbers if not for the effect of the gas drag backreaction, which organizes the dust in rings and arcs. They also found that the PEI leads to several patterns usually associated with planet–disk interactions, challenging any correlations drawn between dust structures and perturbing planets. Richert et al. (2018) incorporate radiation pressure into a PEI model, and show that while grains of different sizes feel very different amounts of different radiation pressure force, the PEI can still produce dramatic structures in such a more realistic disk model, depending on the parameters of the system. The morphology of the flow depends strongly on the gas density (which determines the gas drag), the dust density (which determines the photoelectric heating), and the dust-to-gas ratio (which determines the drag backreaction). For disks with modest level of gas and dust-to-gas ratio , sharp concentric rings and arcs are seen, showing the anticorrelation between gas and dust seen in models of the PEI without radiation pressure (Lyra & Kuchner, 2013). For higher surface density and lower gas-to-dust ratio , erratic spiral structure is seen throughout the disk, with transient small-scale structure in dynamical timescales, and no obvious tendency of the dust and gas to anticorrelate. At even higher gas densities, outward gas flows can entrain even larger grains that do not participate in the instability.
Given the variety of structures that the PEI can generate in a disk, which muddles an unequivocal association with planetary perturbations, a natural question to ask is: what are the expected patterns when both a planet and PEI are present in a disk? How do we disentangle them? This is the goal of the current study.
2. Method
2.1. The Equations
We work in the thin disk approximation using the vertically averaged equations of hydrodynamics. Our model includes gas and dust; the gas is evolved in an Eulerian grid, whereas the dust is treated as Lagrangian particles. The equations solved are
| (1) | |||||
| (2) | |||||
| (3) | |||||
| (4) | |||||
| (5) | |||||
| (6) | |||||
| (7) |
In the equations above, and are the vertically integrated gas density and bulk density of dust, respectively. Their quotient defines the dust-to-gas ratio . 111As we use the 2D infinitely thin approximation, the different scale heights of grains and gas is not resolved. The definition of dust-to-gas ratio used here is the ratio of their column densities; in 3D it should be the ratio of their volume densities, which, because of the different degree of stratification, is larger for loosely coupled grains in the midplane, by (Lyra & Lin, 2013). For well-sedimented grains, the 2D approach may underestimate the local dust-to-gas ratio by orders of magnitude. The velocity of gas parcels is given by ; stands for the vertically integrated pressure, is the gravitational potential, and is the velocities of dust grains. The gravitational potential includes contributions from the star and embedded planets, treated as massive particles with a N-body evolution dynamically integrated with the hydrodynamics evolution. In Eq. (4) is the gravitational constant, is the mass of particle and is the distance relative to particle , located at . The quantity is the distance over which the gravity field of particle is softened to prevent singularities. In Eq. (3), is the gas entropy, given by
| (8) |
where is the specific heat at constant volume, is the adiabatic index, and is the specific heat at constant pressure; and are reference pressure and gas density values, respectively. In Eq. (3) stands for the gas temperature
| (9) |
where is the sound speed; is the thermal coupling times between gas and dust. The quantity is the gas temperature set by equilibrium between the different heating and cooling processes, including photoelectric heating. Calculating it accurately necessitates detailed radiative transfer that is beyond the scope of the present work. Instead, we use a simple prescription for the gas temperature set by photoelectric heating as used in Klahr & Lin (2005)
| (10) |
where is a reference temperature. We keep (see the appendix of Klahr & Lin 2005 and Fig 1 of that work for the estimate of given by a balance between photoelectric heating off silicate grains and cooling via the CII line.) In the Lagrangian dust equations, is the velocity of a dust grain, and is their position. The last term in Eq. (7) is the drag force by which gas and dust interact dynamically. It brings the velocities of the dust grains to that of the gas within the timescale , the friction time. The last term in Eq. (2) is the backreaction of the drag force. We choose the friction time as proportional to the local orbital period
| (11) |
as in this case the relative timescales (the PEI growth rate also scales with the orbital period) are similar at all radii222The drag time in the Epstein regime is (cf. Youdin, 2010) , where is the grain radius, is the grain’s material density, and the gas volume density. As such, Eq. (11) is equivalent to grains of identical size and material density scattered through a disk where . This would be the case for, e.g., and , which are not unreasonable choices for the density and temperature gradients.. We keep . The operator
| (12) |
represents the advective derivative.
Given that the goal of this work is to examine the competing roles of the PEI and gravitational perturbation by a planet, we ignore the effects of radiation pressure. Because the thermal time is expected to be very low, we use the instantaneous thermal coupling approximation (Lyra & Kuchner, 2013). That means that instead of solving the energy equation, and equate and update the sound speed is updated accordingly. This change effectively amounts to choosing a new equation of state that depends on the dust density
| (13) |
We solve the equations with the Pencil Code333The code, including improvements done for the present work, is publicly available under a GNU open source license and can be downloaded at http://www.nordita.org/software/pencil-code, which integrates the evolution equations with sixth order spatial derivatives, and a third order Runge–Kutta time integrator. Sixth-order hyperdissipation terms are added to equations of motion, to provide extra dissipation near the grid scale. They are needed because the high order scheme of the Pencil Code has little overall numerical dissipation (McNally et al., 2012). The calculations are sped up by using the “fargo” orbital advection algorithm (Masset, 2000; Lyra et al., 2017).
2.2. Run Parameters and Units
The simulations are performed on a uniform cylindrical grid (coordinates ) with resolution and linear domain =[0.4,2.5] and full 2 coverage in azimuth. To represent the dust grains, 200,000 Lagrangian superparticles are scattered uniformly across the disk. The star and the planet orbit around the barycenter of the system in circular orbits. Disk self-gravity is ignored. We ran simulations with three different planet masses. The mass ratio of the planet to the host star are . For each planet we simulated 5 different dust-to-gas ratios, from to 1, logarithmically spaced. The runs from to are in the zone of highest growth rate for the PEI (Lyra & Kuchner, 2013; Richert et al., 2018). We choose our units such that
| (14) |
All quantities with subscript “0” are measured at . For and , our unit of time is 160 yr, and the unity of velocity 3 km s-1. We investigate disks of aspect ratios , where , with the disk scale height. For a solar mixture of molecular hydrogen and helium, of mean molecular weight and , these correspond to temperatures of = 5, 20, and 80 K, respectively. We consider monodispersive particles of radius m. This choice, along with the choice of Stokes number unity
| (15) |
sets the unit of density 444The Stokes number should in fact be dynamic, updated by density and temperature as given by Eq. (16). Setting it as a constant is a choice we make, to better isolate the physical phenomenon we want to study. Yet, notice that because the photoelectric heating introduces an anti-correlation between gas density and gas temperature, the product varies a lot less than either or , so is not a bad first approximation).. This is because the friction time in the Epstein regime is
| (16) |
where is the grain internal density. For icy grains, it should be g cm-3. Multiplying Eq. (16) by to obtain the Stokes number and setting to one, yields, solving for density
| (17) |
which results, for , in g cm-3, with associated column density of g cm-2. We keep the gas and dust densities constant with radius, whereas the temperature decreases according to . We usually use corresponding to a negative global pressure gradient, causing the dust to slowly drift inwards. Although a drift is present, the resolution is not high enough to capture the streaming instability (Youdin & Goodman, 2005; Johansen et al., 2007; Lyra & Kuchner, 2013). A subset of simulations use .
The parameters of the simulations we ran are shown in Table 1. We explored the parameter space of planet mass, sound speed, and dust-to-gas ratio.
| Run | h | ||
|---|---|---|---|
| Fiducial runs with no dust | |||
| i | 0.05 | ||
| ii | 0.05 | ||
| Runs with a single planet. | |||
| A | 0.05 | ||
| B | 0.05 | ||
| F | 0.05 | ||
| G | 0.05 | ||
| K | 0.1 | ||
| L | 0.1 | ||
| P | 0.2 | ||
| Q | 0.2 | ||
| AA | 0.05 | ||
| AB | 0.05 | ||
| AC | 0.05 | ||
| AD | 0.05 | ||
| AE | 0.05 | ||
| AF | 0.05 | ||
| Runs with photoelectric instability. | |||
| C | 0.05 | 0 | |
| H | 0.05 | 0 | |
| M | 0.1 | 0 | |
| R | 0.2 | 0 | |
| Runs with a planet and instability. | |||
| D | 0.05 | ||
| E | 0.05 | ||
| I | 0.05 | ||
| J | 0.05 | ||
| N | 0.1 | ||
| O | 0.1 | ||
| S | 0.2 | ||
| T | 0.2 | ||
| Runs with no gas backreaction. | |||
| BA | 0.05 | 0 | |
| BB | 0.05 | 0 | |
To investigate the effect of the photoelectric instability we ran 36 simulations. We used two planets, analogous to a Neptune and a Jupiter mass planet. For each planet we varied 3 disk temperatures, 2 dust-to-gas ratios, and 3 different cases for carving a gap in the disk. The cases are: the effect of a single planet with no photoelectric instability, a disk with the instability on its own, and a combination of an embedded planet and the instability.
3. Results

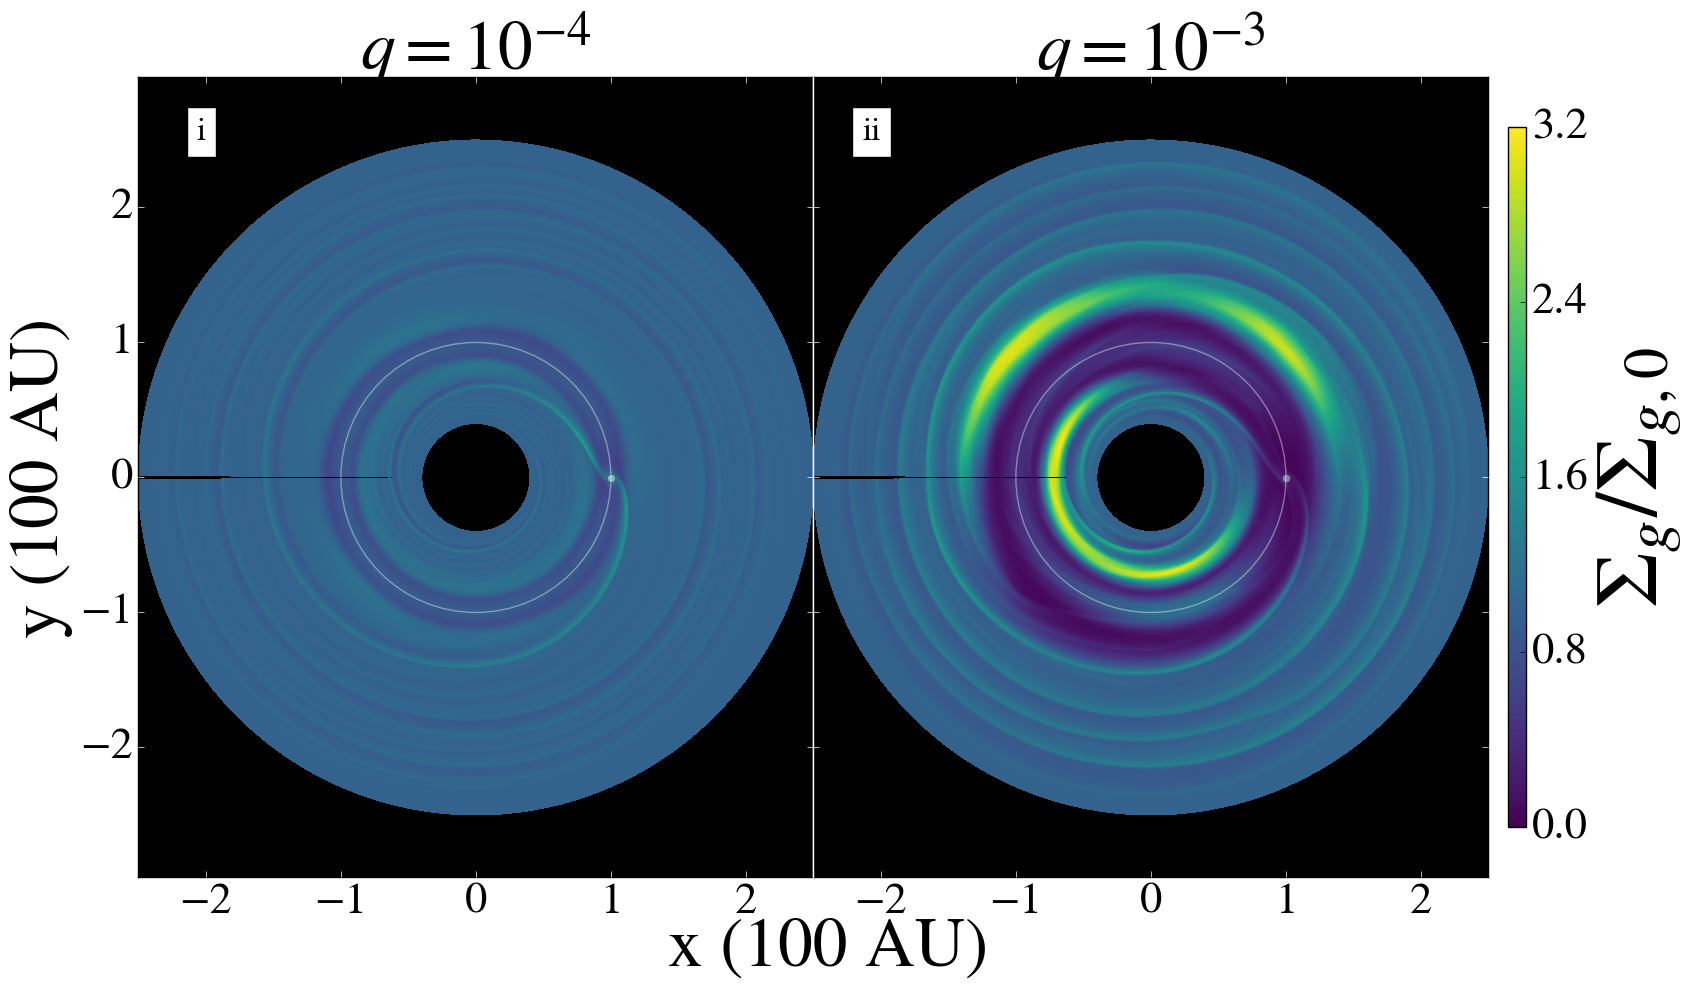
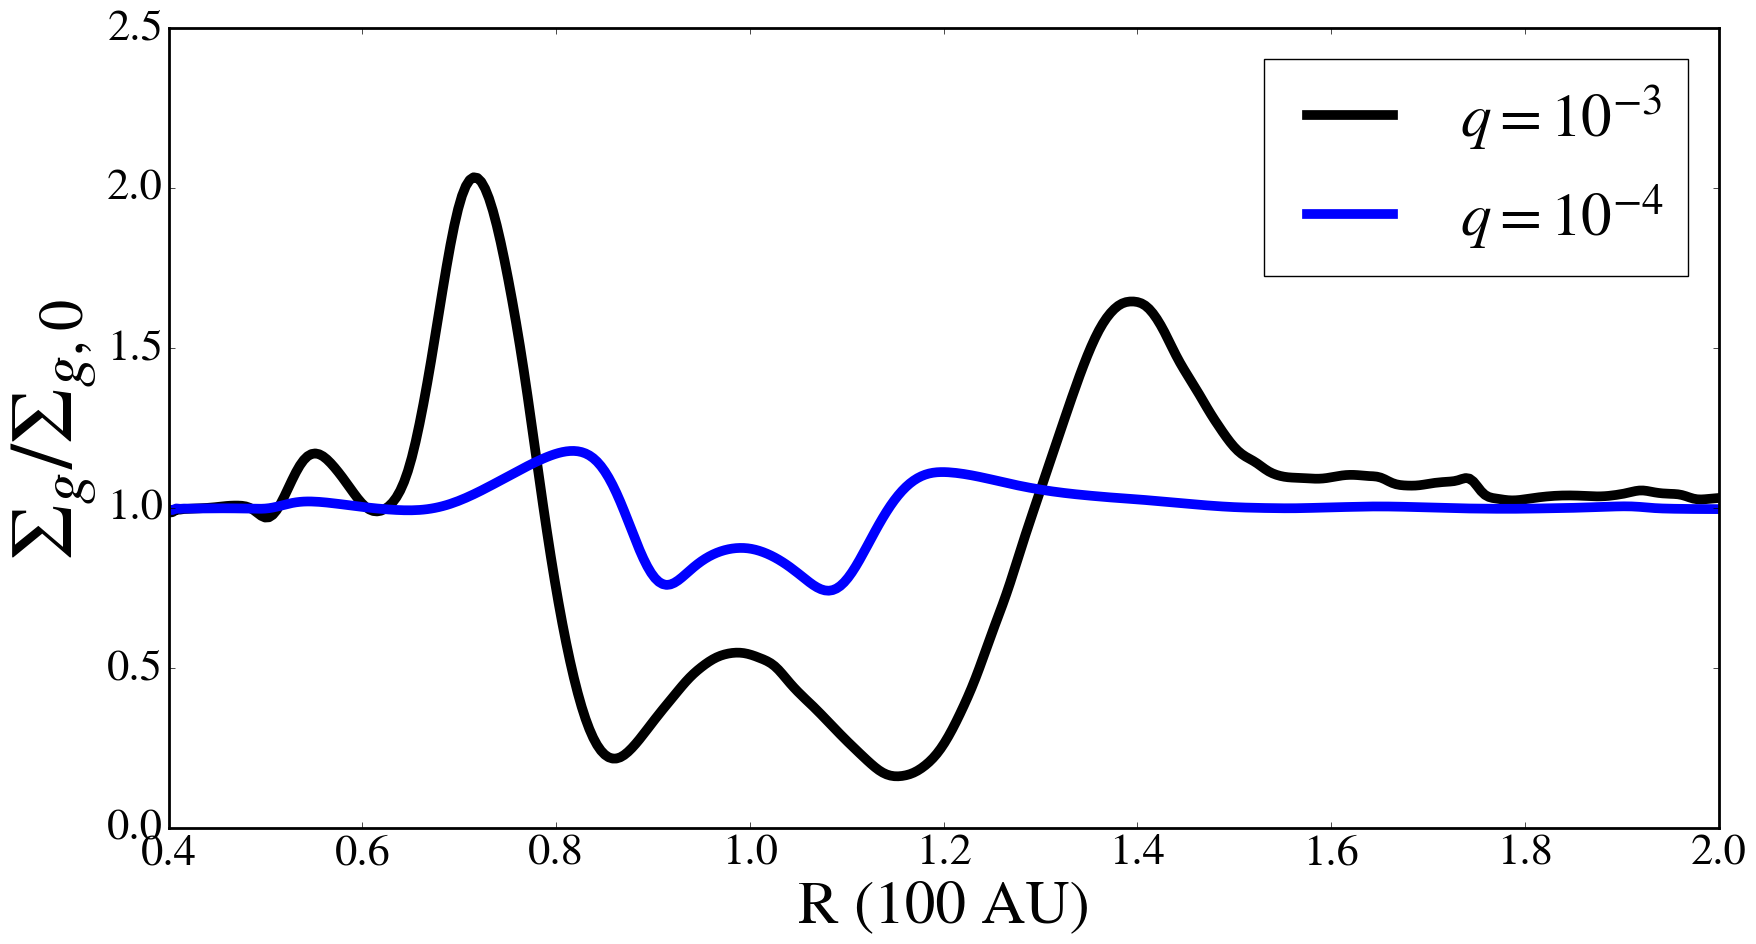
We first show the reproduction of the benchmarks of de Val-Borro et al. (2006) for embedded planets of mass ratio (Jupiter) and (Neptune) in a disk with no dust. In the upper plots of 1, we plot the gas densities. The Jupiter-mass planet carves out a deep gap in its orbit. Strong vortices are also seen in the inner and outer edges of the gap, spawned by the Rossby wave instability (Lovelace et al., 1999; de Val-Borro et al., 2007). The Neptune-mass case has the same qualitative structures, but much weaker in intensity, and the gap is shallower and narrower. In the bottom plots of 2, we plot the density divided by the initial density as a function of distance from the star. The usual gap shapes are reproduced. The runs with dust and photoelectric instability will be compared against these benchmark gap profiles.
3.1. The effect of dust
In order to study the effects of the photoelectric instability in planet–disk interactions we need to first investigate how dust changes the shape of the gap. The vast majority of works on planet–disk interaction assumed either dust-free or gas-free scenarios. Even works with both gas dust explored mainly the regime of low dust-to-gas ratio, appropriate for primordial disks, but where the dust is mostly passive. The regime appropriate for late stage transition disks, or debris disk with gas, of dust-to-gas ratio near unity, has been severely unexplored. Here we seek to find at what point does the dust backreaction generate a noticeable effect on the gap carving process. We explore the parameter space of dust-to-gas ratios and planet-to-star mass ratios . Table 1 shows the explored values.
3.1.1 Dust flattens the gap pressure bump
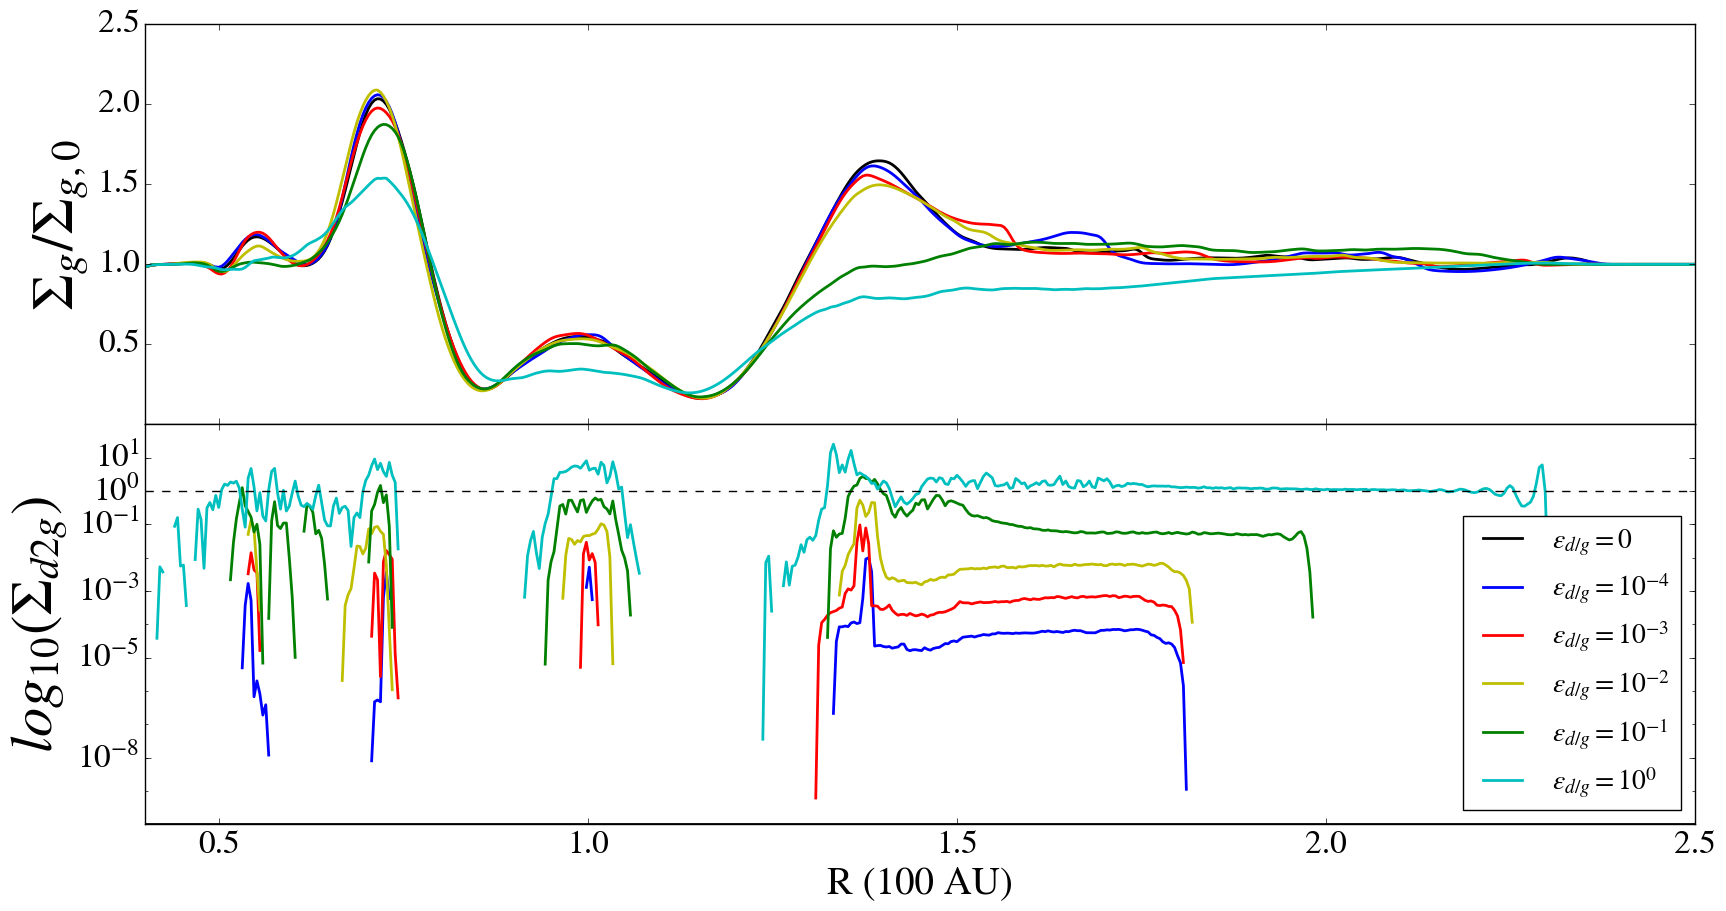
In 2, in the upper panel, we plot the gas density over the initial gas density as a function of distance from the star. The curves correspond to dust-to-gas ratios of 0 (gas-only), , , , , and 1, for . We see that up to the shape of the gap does not deviate much from the gas-only case. However, for and more strongly for , a significant deviation is seen. This corresponds to the regime where the dust begins having a significant effect on the gas. In the lower panel we plot the local dust-to-gas density. The dashed line marks . We see that only the disks with dust-to-gas ratio of 1 or 0.1 cross this threshold. We conclude that only when the local value of reaches unity the shape of the gap is affected, as one would indeed intuitively expect.
3.1.2 Dependency on extent of mass reservoir
Because of the global negative pressure gradient, the grains in the outer disk drift inwards. At later times, the drift is also affected by the pressure gradient generated by the planetary gap. Notice the strong dependency of the drift speed on the dust-to-gas ratio, with the particles started at drifting slowest as they strongly affect the gas.
An immediate conclusion is that if the drift continues, and all grains pile up at the gap edge, any initial dust-to-gas ratio will eventually achieve . Indeed the simulation that started with a global value of (yellow line) is close to this threshold. If they can reach this value based on drift alone is determined by the extent of the disk, i.e., by the extent of the mass reservoir. To estimate the disk size needed to achieve at the gap, let us equate the disk mass in grains beyond the gap with the trapped mass. The former is
| (18) |
where is the slope of the column density gradient, . If =0 then
| (19) |
if we consider the gap trap to be of width , then the trapped mass is
| (20) |
Now we equate and and solve for
| (21) |
requiring , and for , , and , then , i.e., over 500 AU. A steep slope will make the demand of a larger disk even more pronounced, as the mass per ring would be less than in the idealized case we considered.
3.1.3 Differences in the inner disk for different planet masses and dust-to-gas ratio
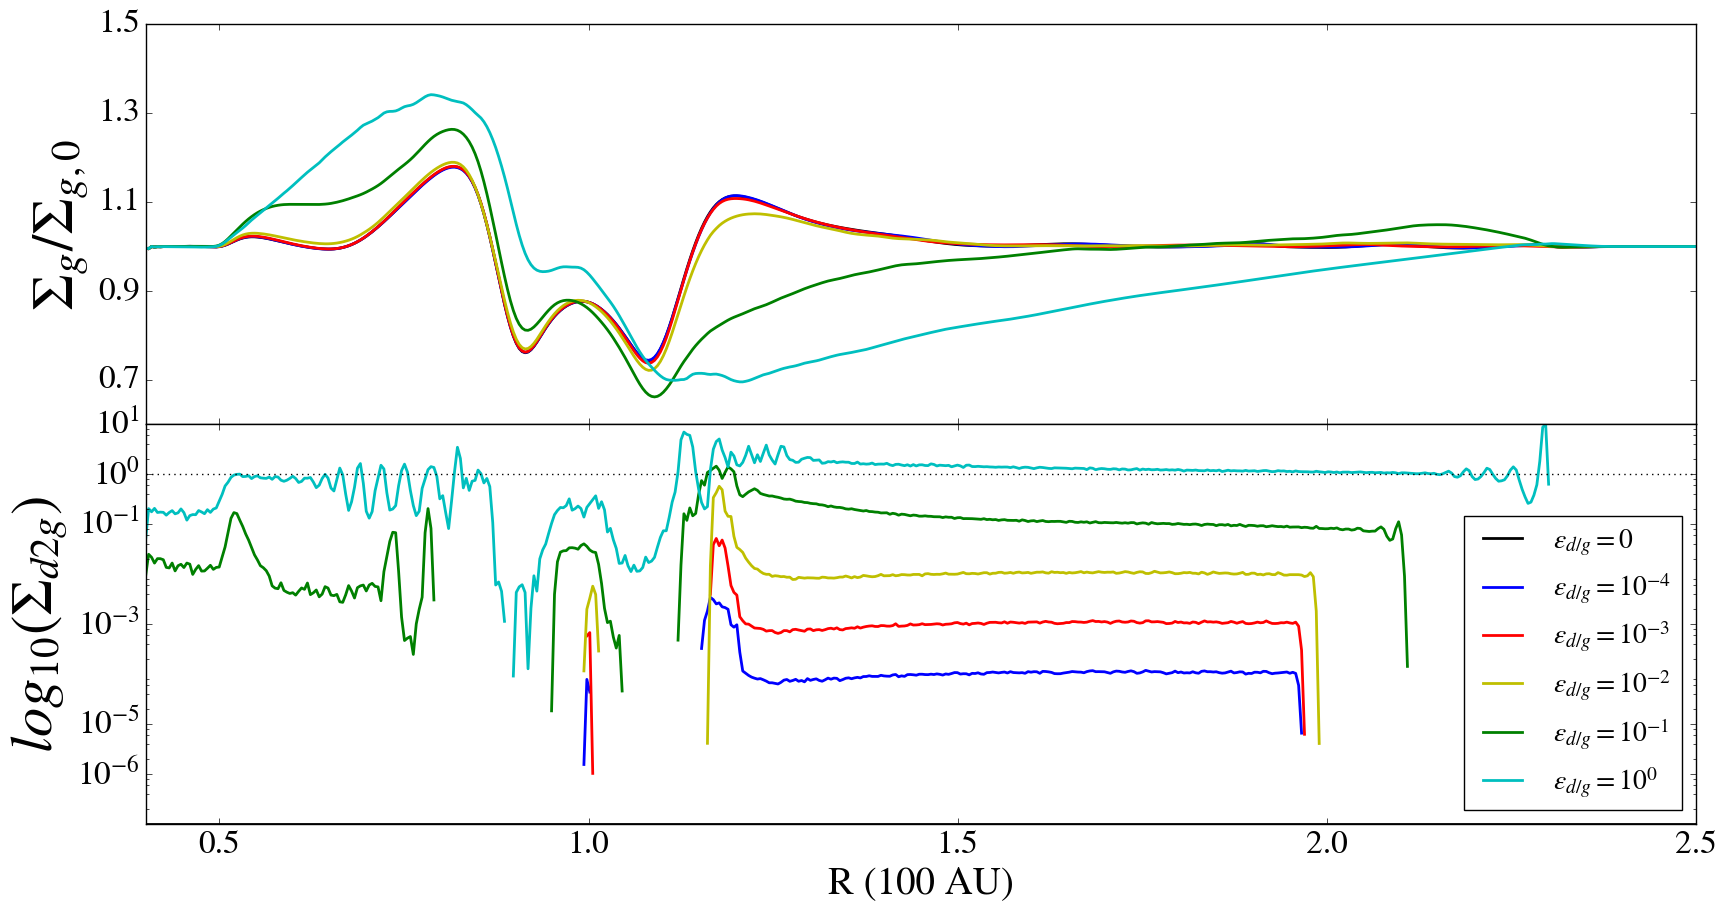
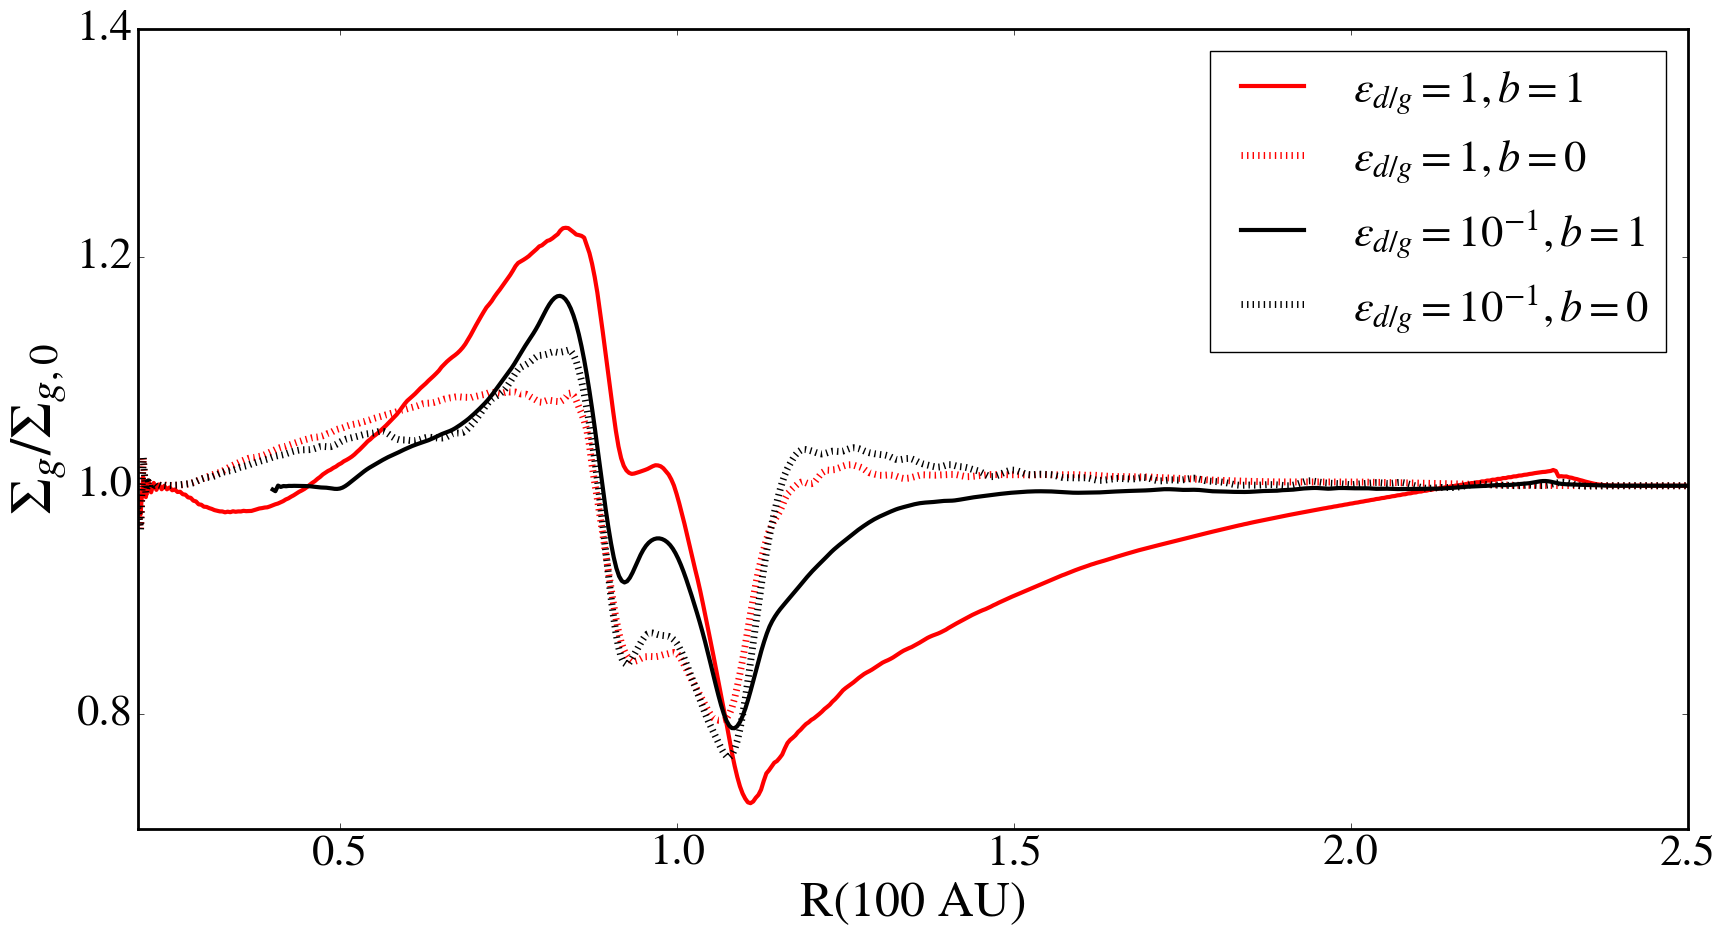
Another feature of 1 and 2 is the reversal seen in the behavior of the inner disk with dust-to-gas ratio for the two planetary masses. In the outer disk both planets show a depression in the gap edge as the dust-to-gas ratio increases. However, for the inner disk, while the Jupiter-mass planet presents the same behavior, the Neptune-mass planet does the opposite, the inner gap wall increasing with dust-to-gas ratio.
The difference in behavior seems to be associated with the particle drift. This effect is seen in 4. The red lines show runs with , and black lines show runs with . Solid lines have ( is the power law of the temperature, giving a global negative pressure gradient); the dashed lines correspond to and thus no global negative pressure. Without the drift the situations are similar, with (red dashed line) slightly more depressed than (black dashed line), because of the flattening effect already discussed. For the runs with the global drift, a pronounced difference is seen. As particle drift inward, to conserve angular momentum they push the gas outwards. For higher dust-to-gas ratio (solid red line), more gas is pushed outwards than for lower dust-to-gas ratio (black solid line). This effect is not seen in the Jupiter-mass case because in this case the planet carves a deep gap early enough. In the Neptune case the shallow gap does not lead to a strong enough pressure gradient to virtually dominate the particle motion as it does in the Jupiter case.
In 5 we show 2D plots of the gas density for the planet masses (upper panels) and (lower panels). Dust-to-gas ratios , , and are shown in the left and right panels, respectively. The effect of a non-zero dust-to-gas ratio is barely distinguishable for and (compare to 1). For dust-to-gas ratio 0.1, the gas in the disk becomes more turbulent at edges of the planet’s orbit. The spirals that are caused by the planet in the dustless case are smooth and laminar, whereas the addition of dust to the necessary threshold causes them to become visibly turbulent at the case. For the wake and gap look even more turbulent, with the spiral clearly passing from laminar to turbulent at some distance from the planet, in a pattern resembling cigarette smoke.
We stress that although we consider debris disks and grains, this particular result depends only on the Stokes number and dust-to-gas ratio. It is therefore applicable to primordial protoplanetary disks if pebbles and boulders ever reach these high values of .
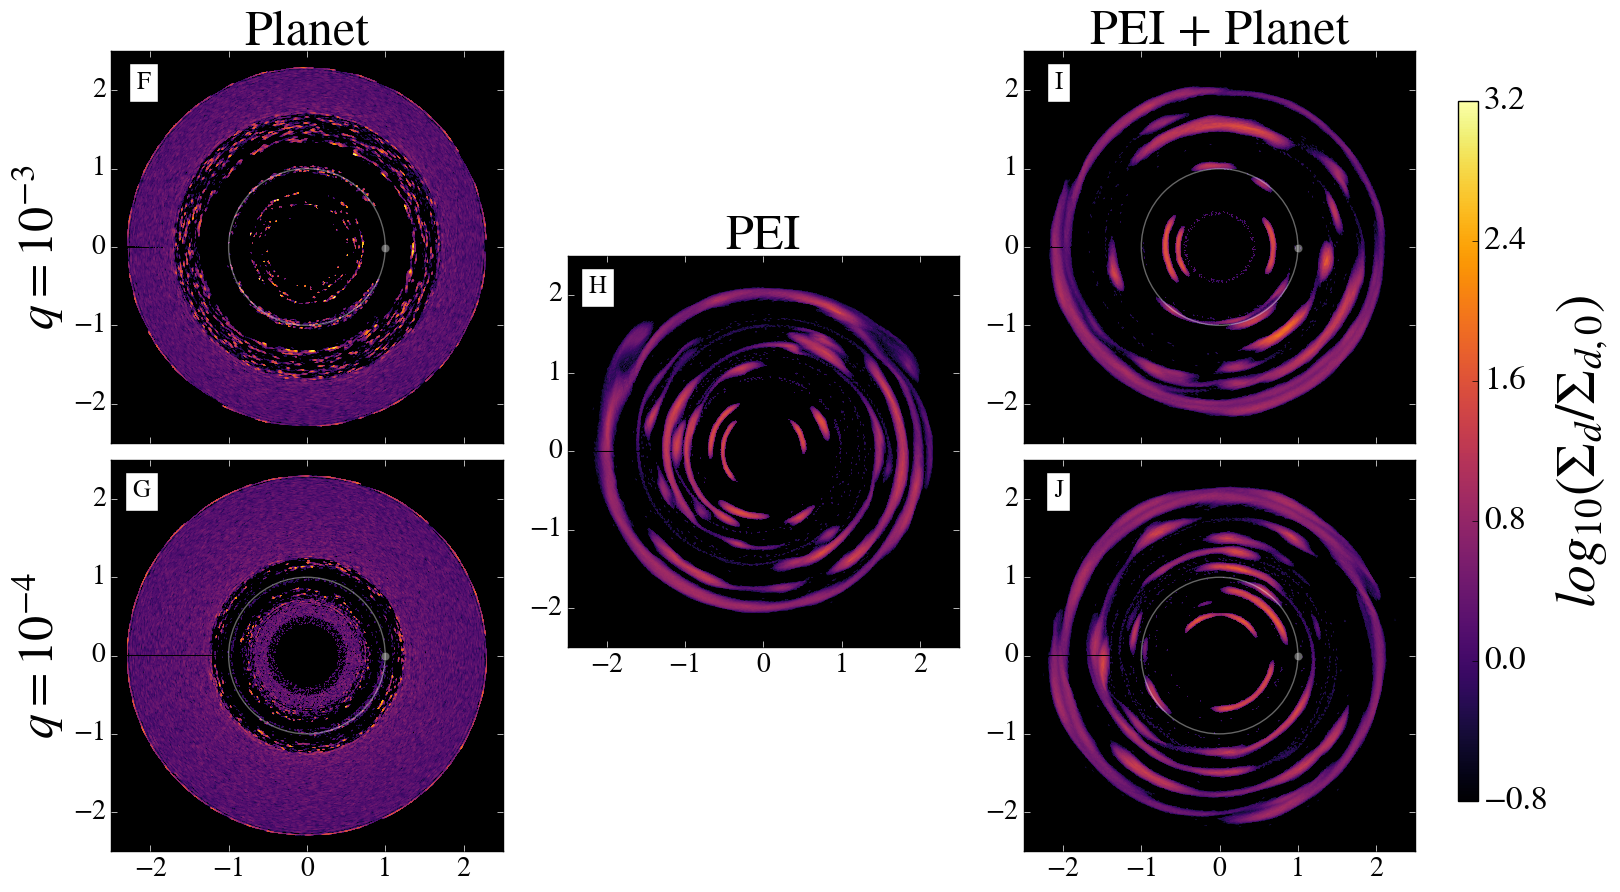
3.2. Disk with and
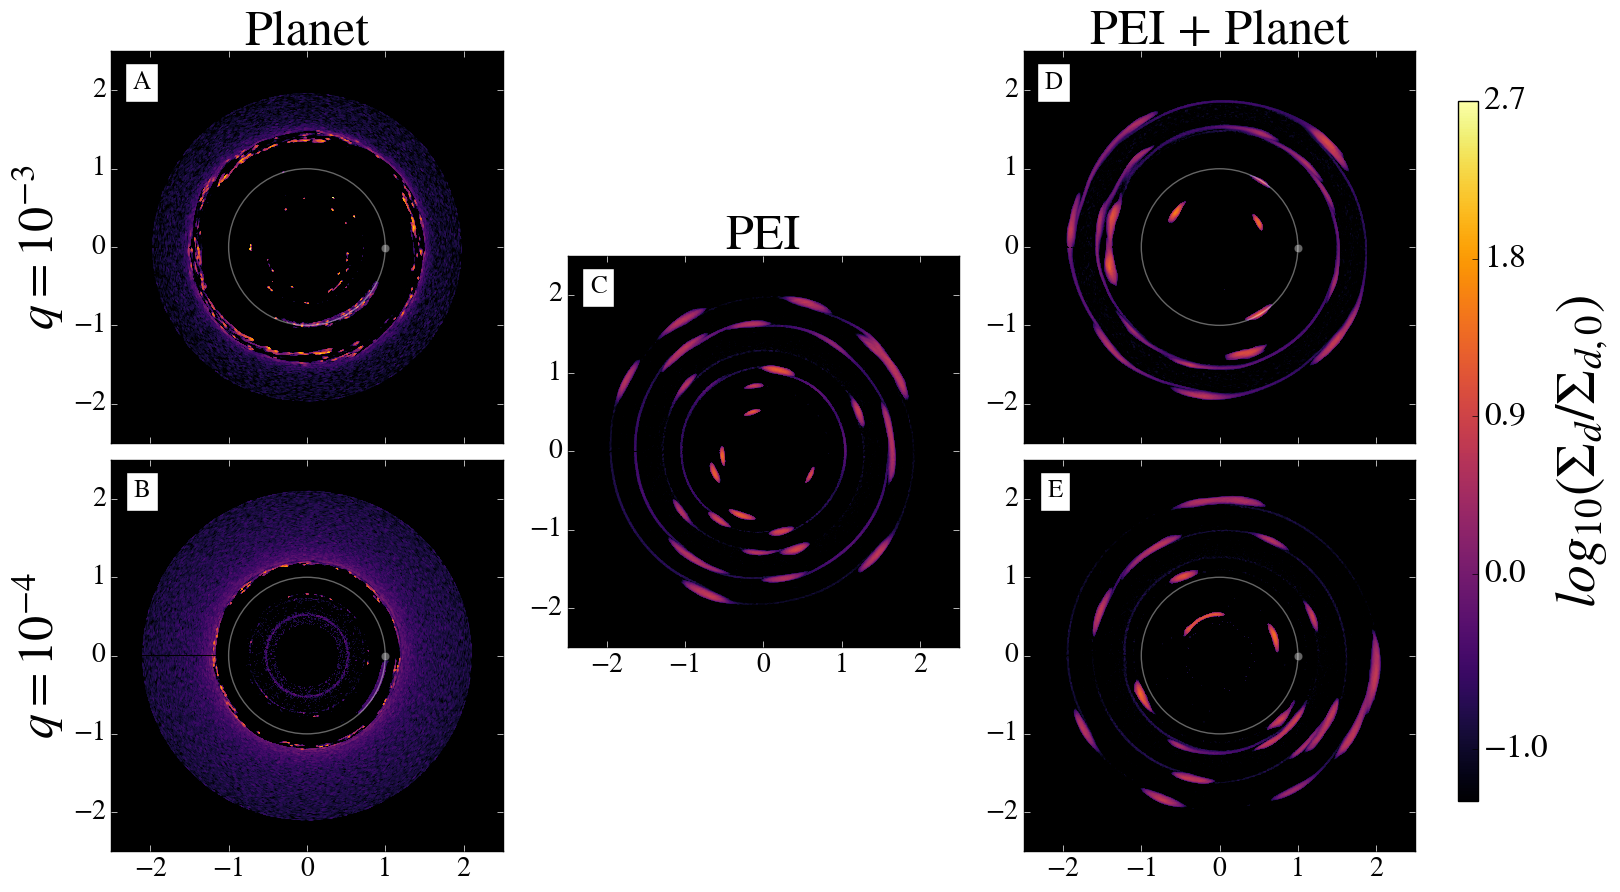
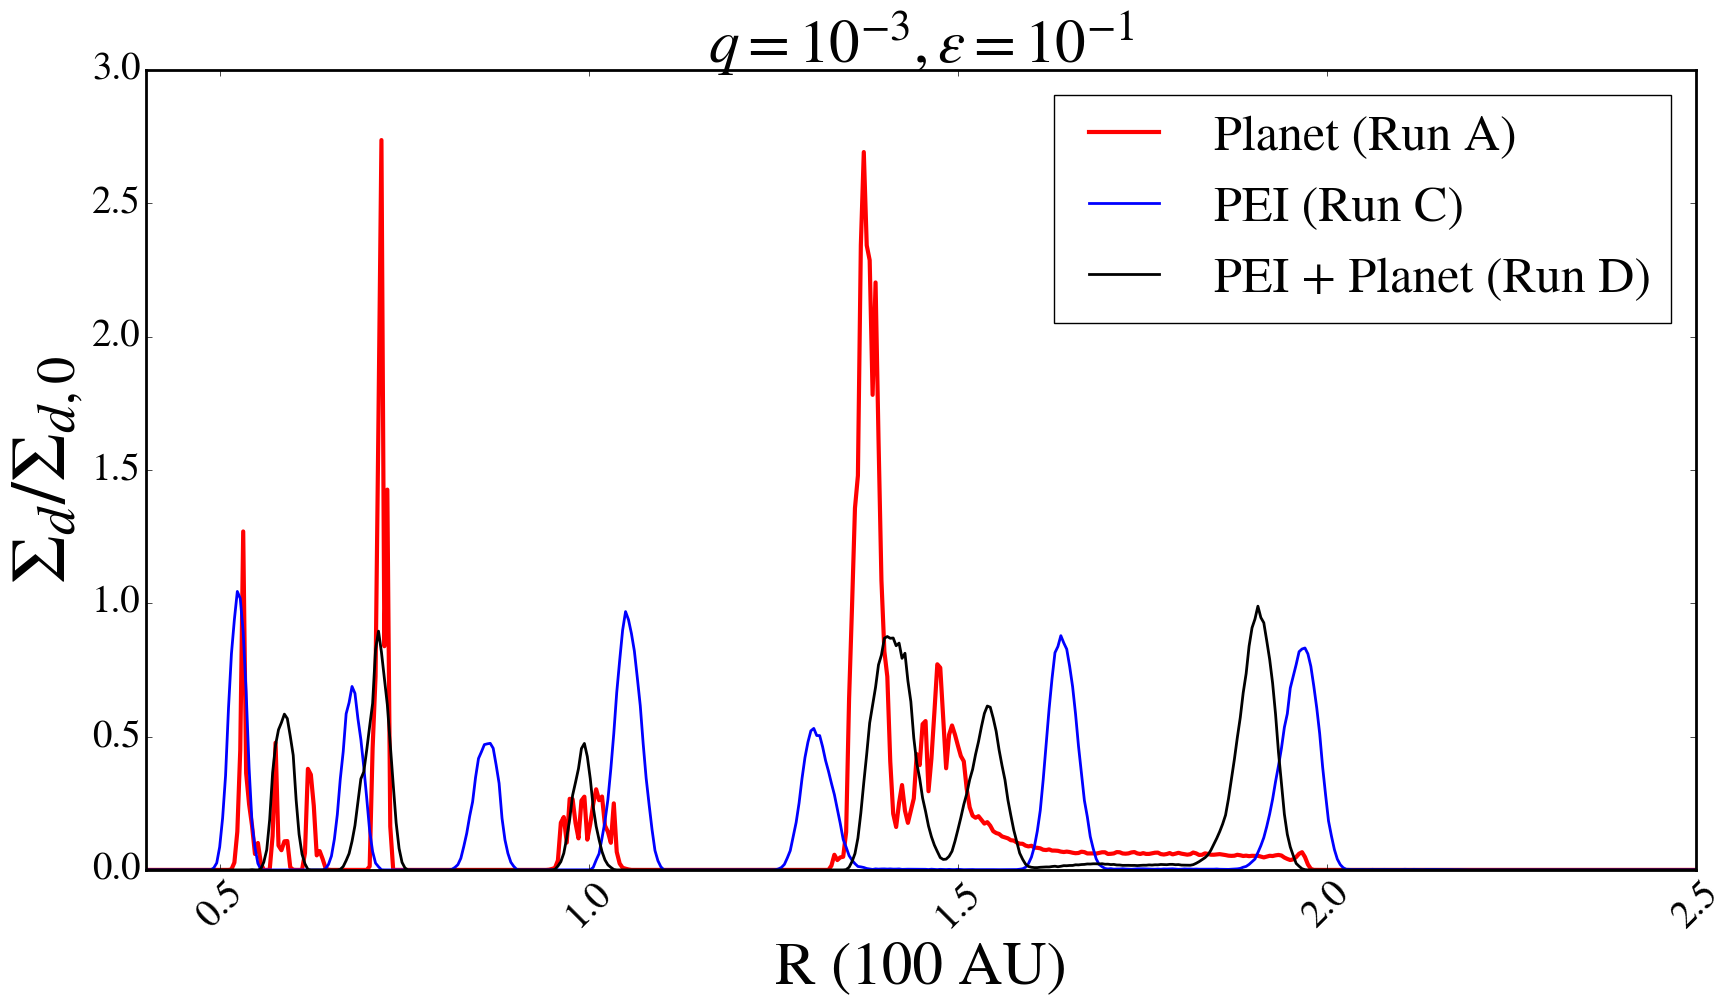
In 6, we plot the dust (top) and gas (bottom) for a disk with and an initial dust-to-gas ratio of . For each panel, the left columns are simulations containing an embedded planet and no photoelectric heating, the middle columns are simulations of a disk containing photoelectric heating but no embedded planet, and the right columns disks containing both an embedded planet and photoelectric heating. The top and bottom rows for each panel represent a Jupiter-mass and a Neptune-mass planet, respectively.
The top panels show the local dust density divided by the initial dust density, on a logarithmic scale. The cavities carved in runs A and B manifest differently, with run A having a gap noticeably larger than that of run B. Run A also has an overall lower dust density throughout the disk compared to run B. These well known results (Paardekooper & Mellema, 2004) are expected as a higher-mass planet clears its orbit.
Run C demonstrates the effects of photoelectric heating on a disk. The structures created are similar to those of Lyra & Kuchner (2013), with rings and incomplete arcs.
Runs D and E correspond to a disk subject to photoelectric heating and containing a planet. Run E, which represents the Neptune analog, is nearly identical to the control run C, containing the same structures as in the pure instability case. We conclude that the addition of a Neptune-mass planet does not noticeably alter the shape or number of structures from the pure instability case. Run D, which contains a Jupiter-mass perturber, shows larger arcs and a discernable cavity. This is another novel result. When photoelectric heating is included, the photoelectric instability obscures structures induced by planets unless the planet’s mass is sufficiently large to carve a noticeable gap. The shape of the structures caused by photoelectric instability are also changed in the Jupiter case compared to the Neptune, likely due to the stronger eccentricity stirring at mean-motion resonances with higher planet mass (Murray & Dermott, 1999; Zhu et al., 2014).
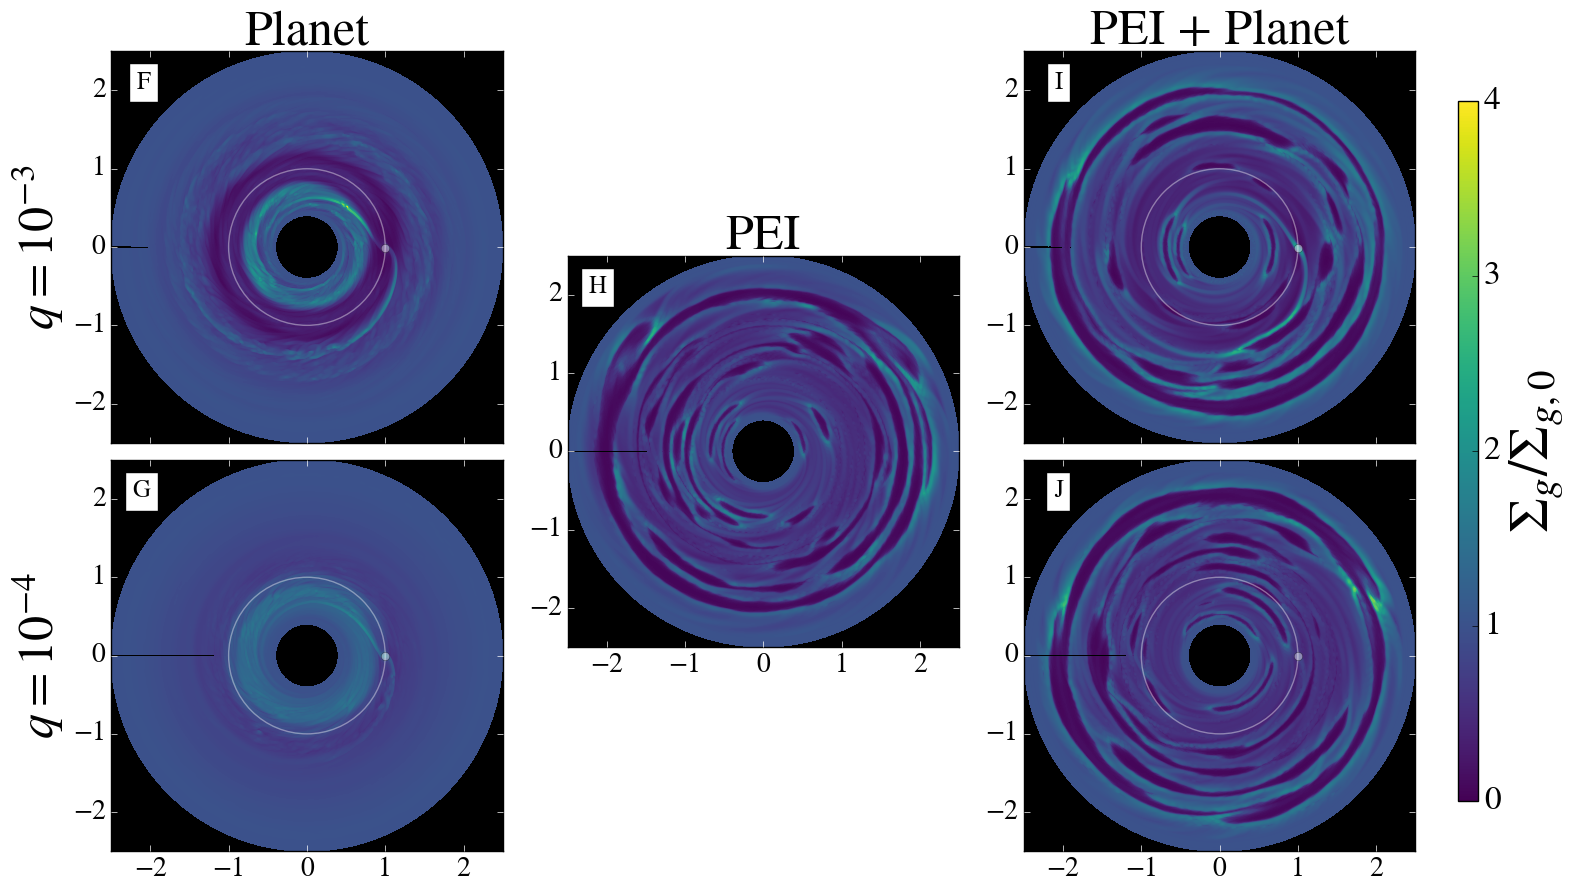
The bottom panel shows the same plots but for the gas (gas density divided by the initial gas density), on a linear scale. The most pronounced feature is the anticorrelation between the dust and the gas, such that a large concentration of dust coincides with gas depletion. Reiterating for the gas case, we see that a Jupiter-mass perturber carves a larger gap as well as a more prominent spiral. The spiral launched by the Neptune-mass planet is almost lost in the midst of the structure generated by the photoelectric instability.
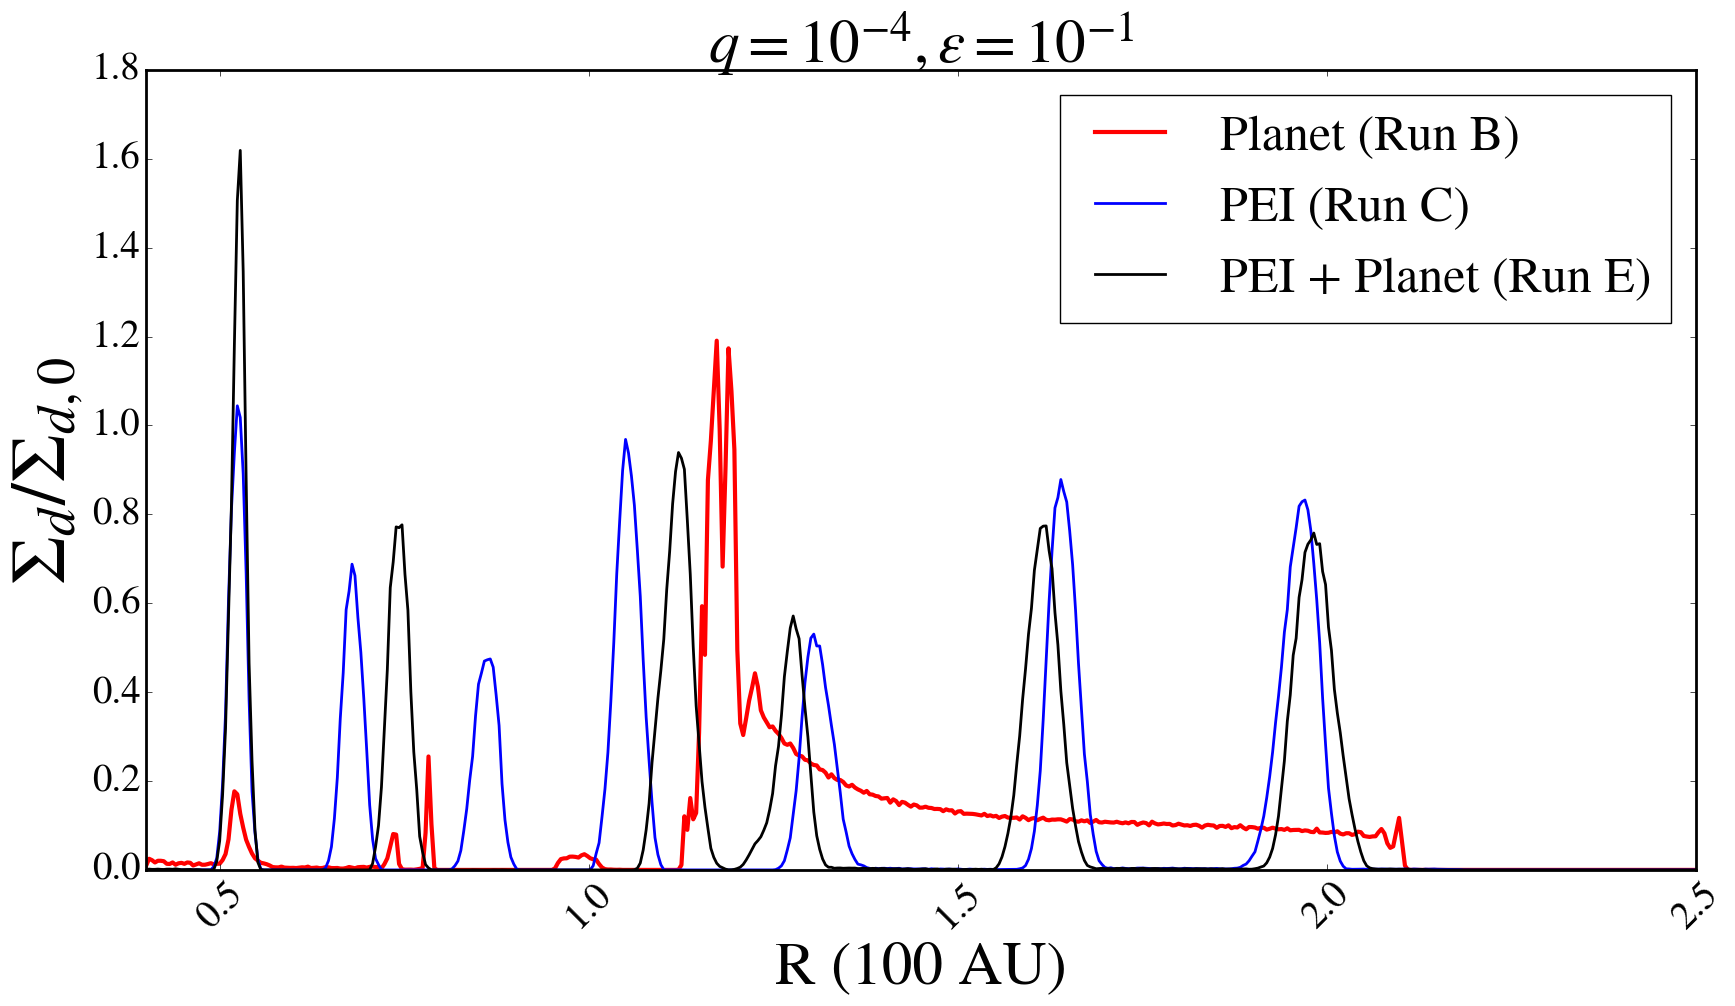
In Figure 6, we plot an averaged linear dust density as a function of radius from the star. The left panel coincides with a Jupiter-mass and the right to a Neptune-mass planet. On the left panel the combined case in solid black, creates larger concentrations of dust than the pure instability case in solid blue. Additionally, the more massive planet (left) carves a considerable gap at the location of the planet (100 AU). The width of the gap is on the order of 50 AU. For the Neptune-case the blue and black lines coincide at various locations throughout the disk. This echoes our conclusion that a planet must carve a substantial gap in the dust for the patterns created by the planet to be differentiated from those associated with photoelectric heating. The shapes shown here in the dust can be used in tandem with actual observations in order to narrow down the possibility of an embedded planet in a disk where the gas is subject to photoelectric heating.
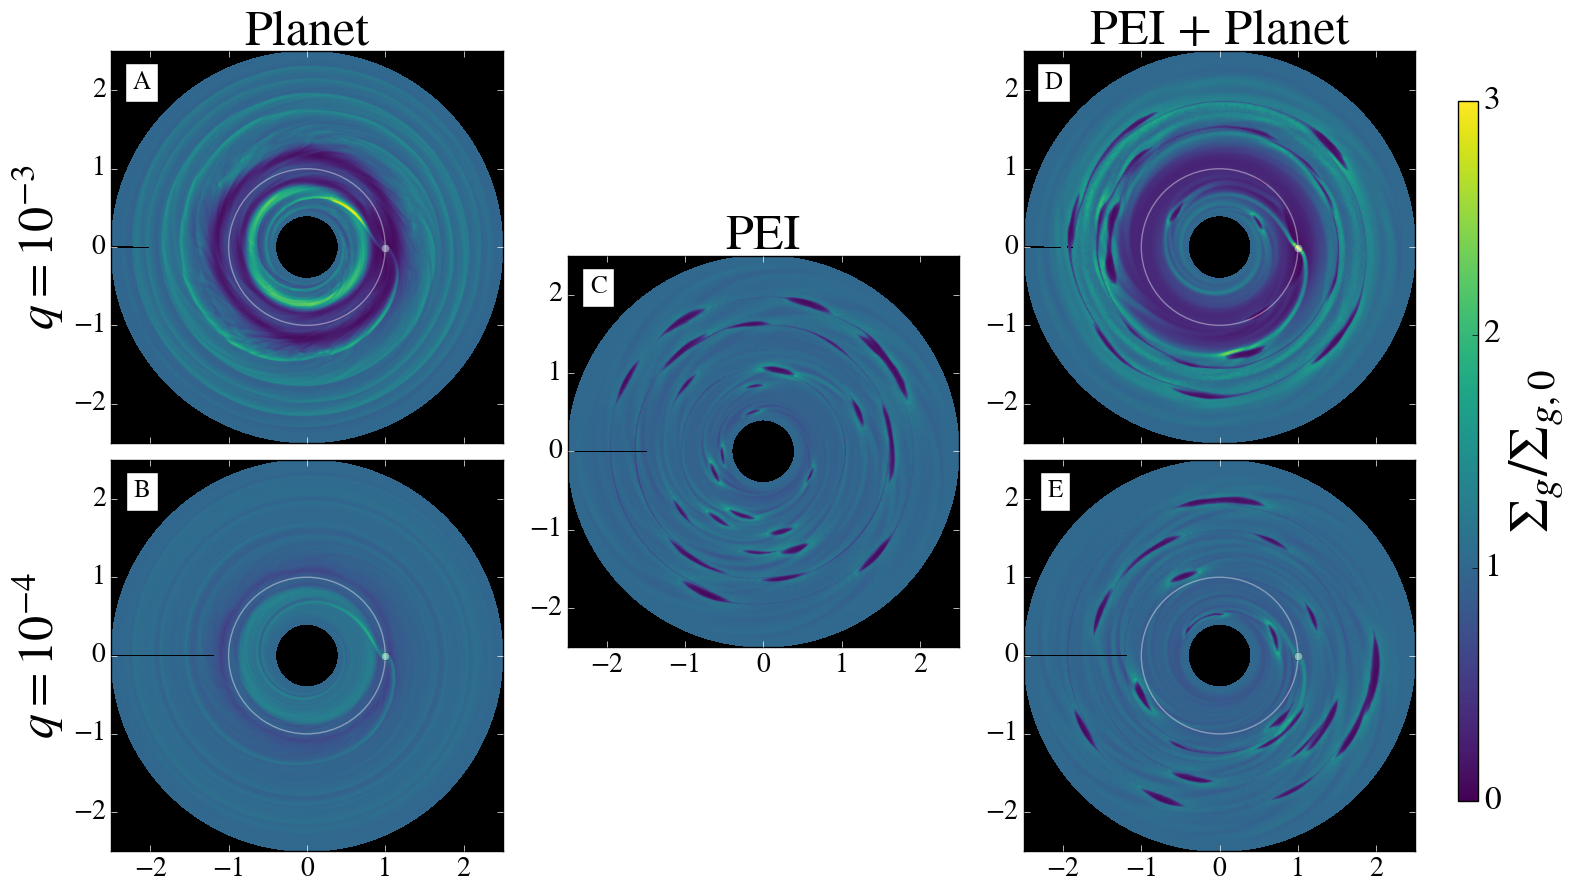
3.3. Disk with and
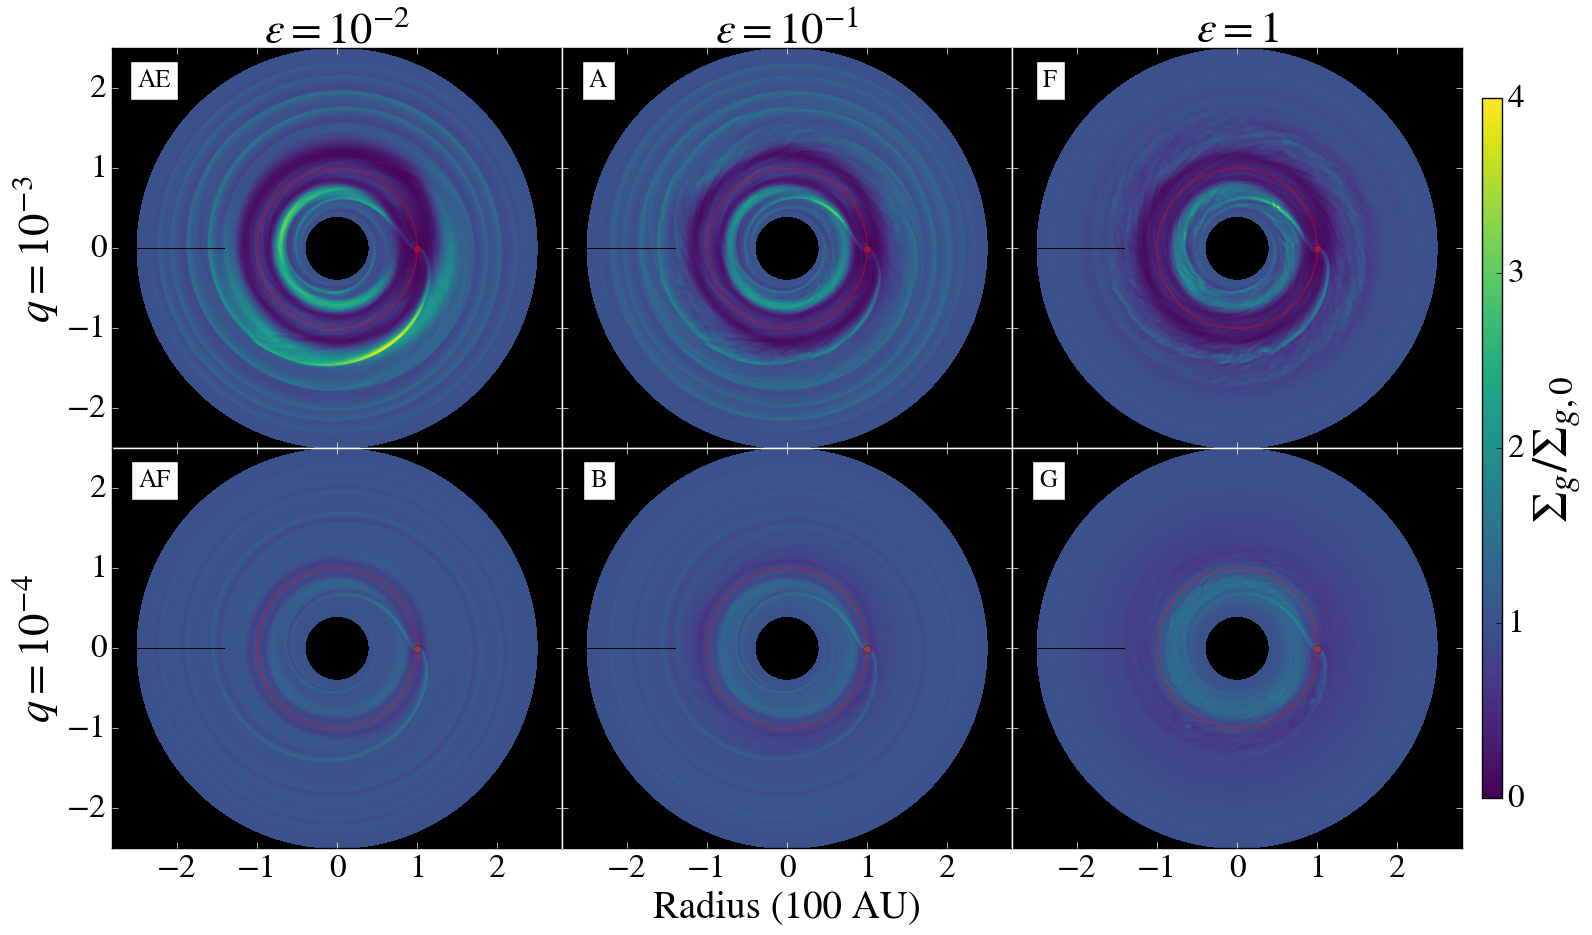
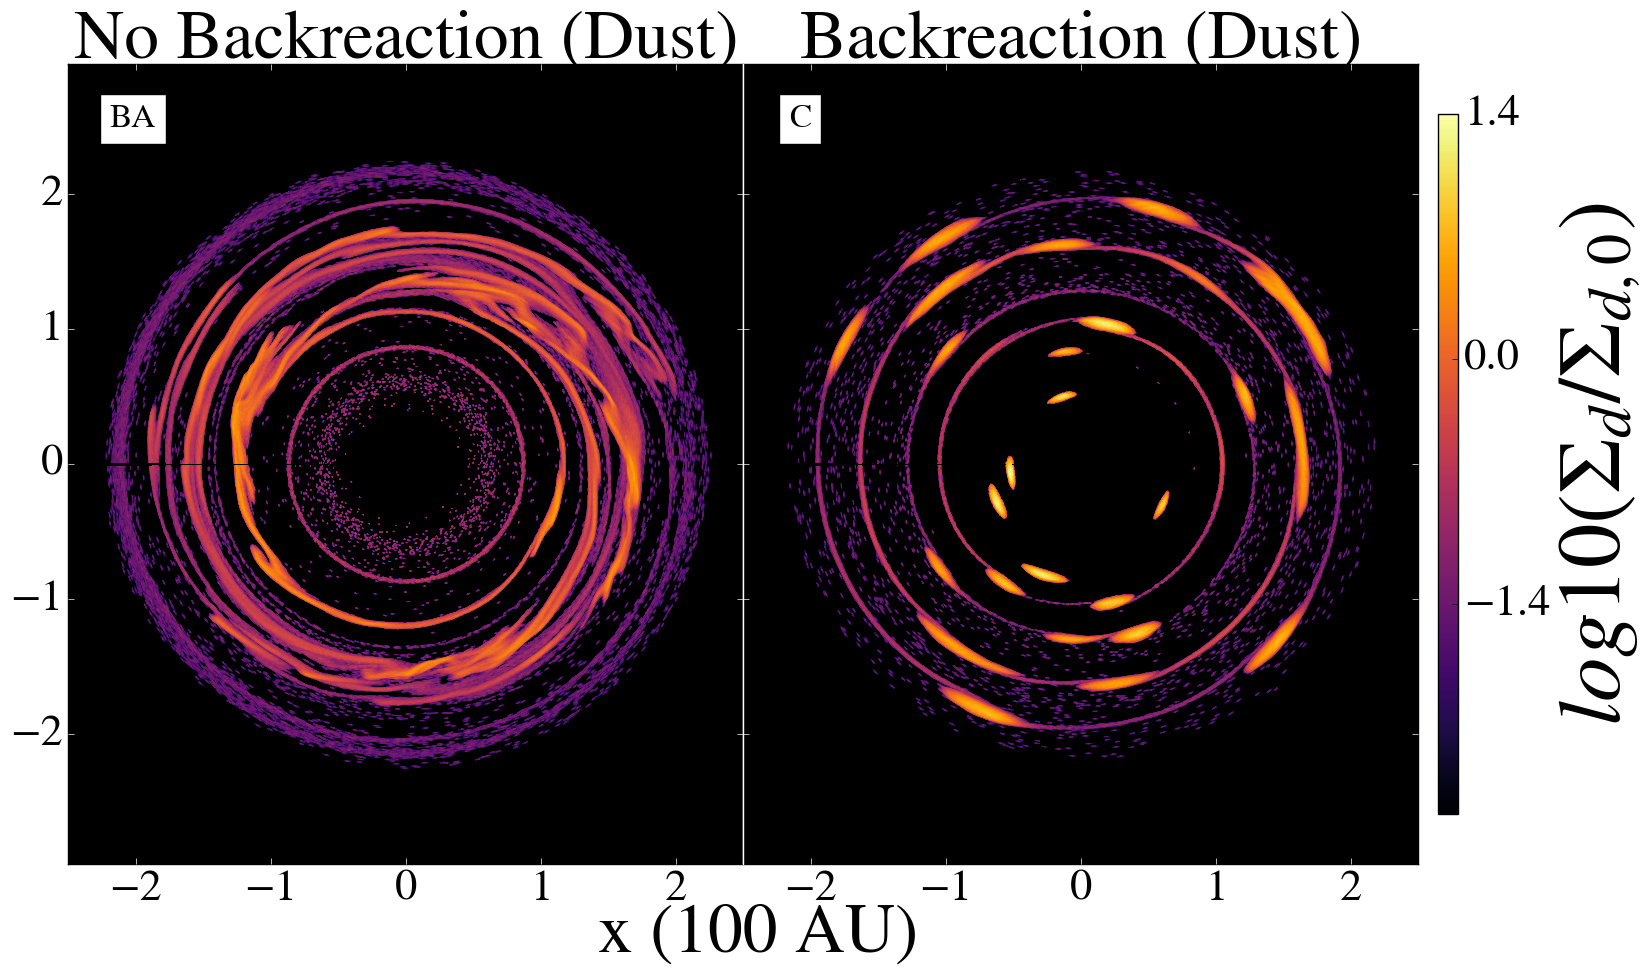
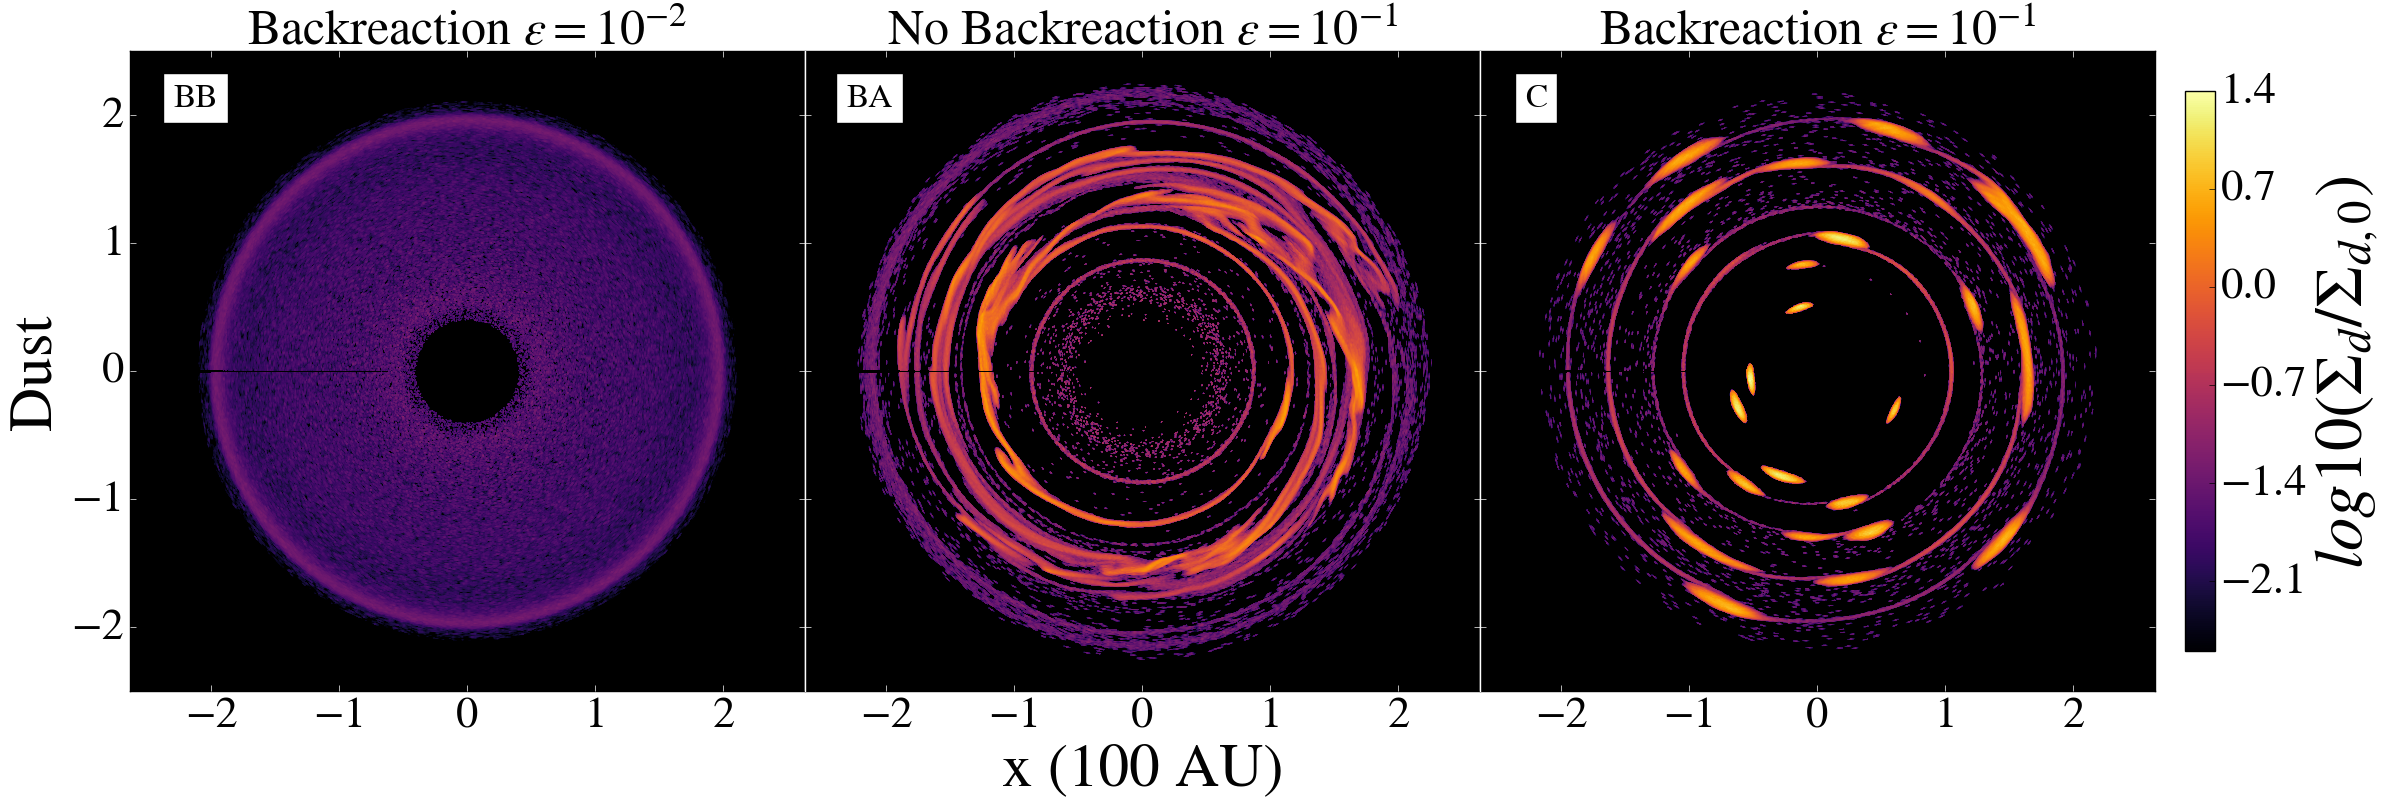
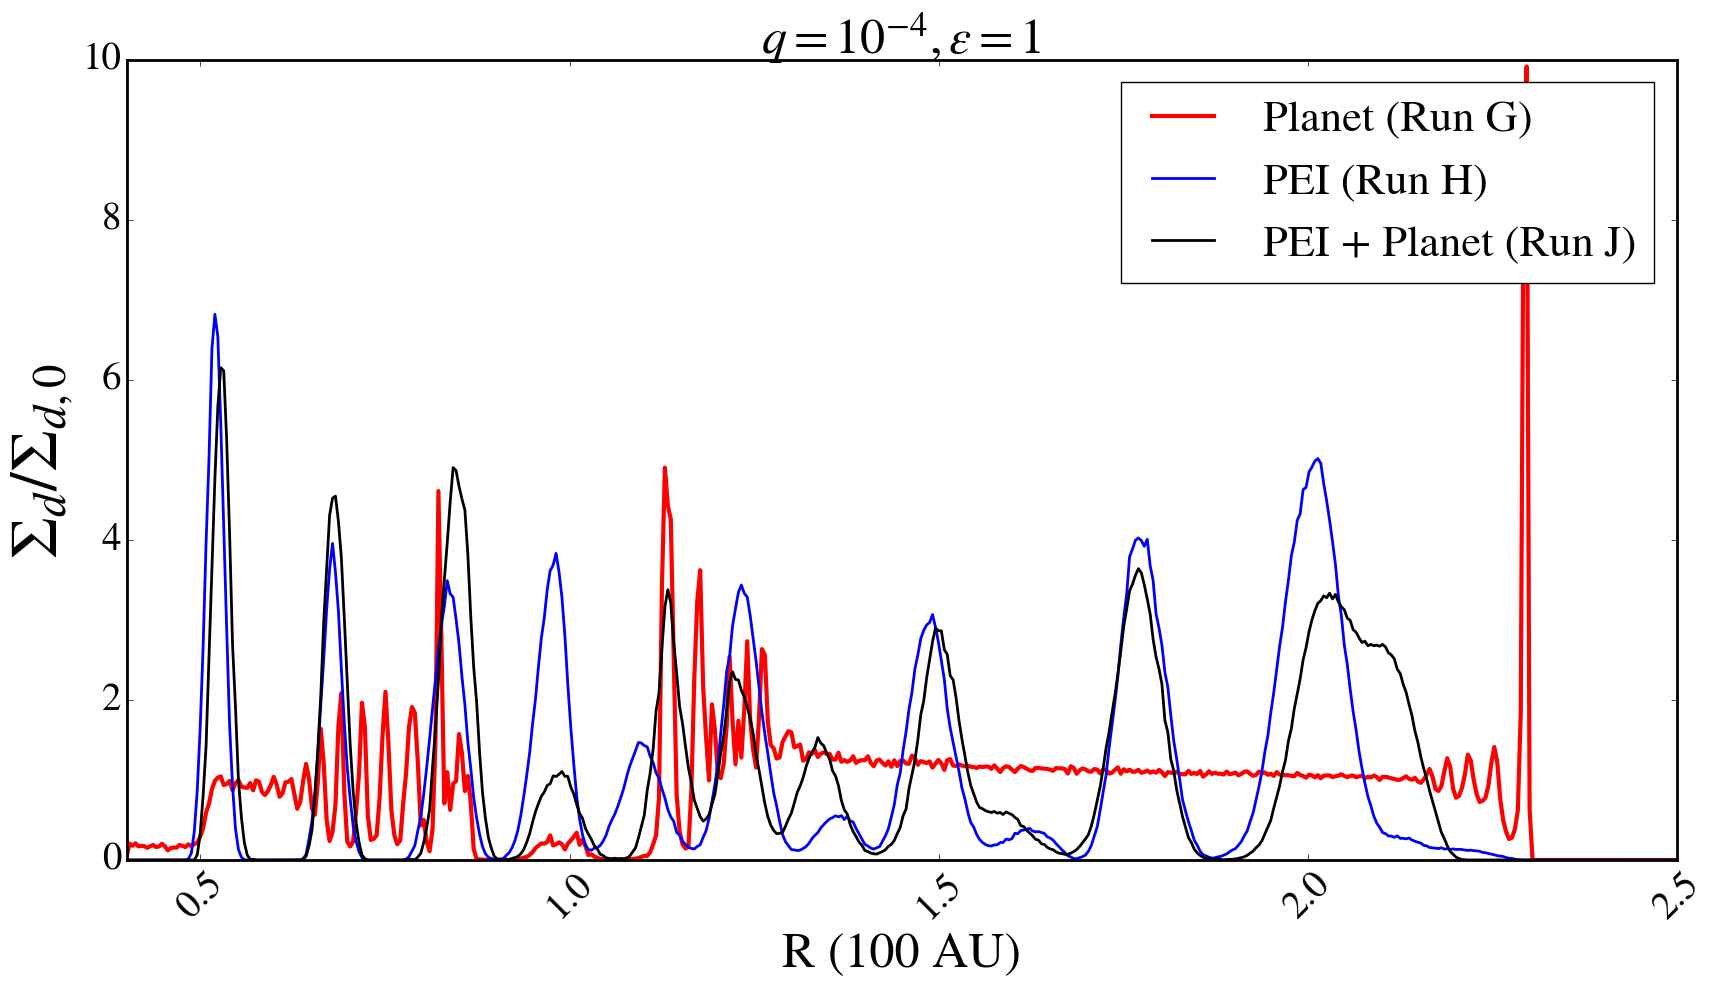
In 8, we plot the dust and gas for a disk with a value of and dust-to-gas ratio of 1. For the dust, runs F and G show a gap due to the perturber’s influence, as expected.
The increase of to unity enhances the effect of the dust as it is easier now for dust concentrations to affect or dominate the gas motions. The extent of the dust distribution is larger for the case than for because the dust dominated over the gas and stopped drifting. The lack of drift is clear from the inner disk, where we amount of dust in the is substantial compared to the depleted inner disk in the case. Run H, which corresponds to the photoelectric instability case, shows various arcs, rings, and gaps. This is identical to the fiducial run of Lyra & Kuchner (2013) (Figure 3 of that paper). Comparing to the PEI case in 6, we see that the structures are significantly different, with mostly small-scale arcs in the case, and no complete rings. This is similar to the backreaction-free models of Lyra & Kuchner (2013), who found that backreaction was needed to stabilize and maintain complete rings. In that paper we examined only for the 2D runs, finding that in a run without the backreaction (Suppl. Fig 6 of that paper), the disk broke into several clumps. We explained it in terms of the tendency of the gas to counter-rotate in and around regions of high pressure, which is turn is disrupted by the backreaction. For the case, the backreaction is weaker than in the case, so the ability of the PEI to structure the dust into rings is diminished. Run C, however, is more self-organized than the no-backreaction run in Lyra & Kuchner (2013), that appears strongly turbulent. The differences between these runs is not just the presence of backreaction, but also the lower amount of dust, that leads to less heating.
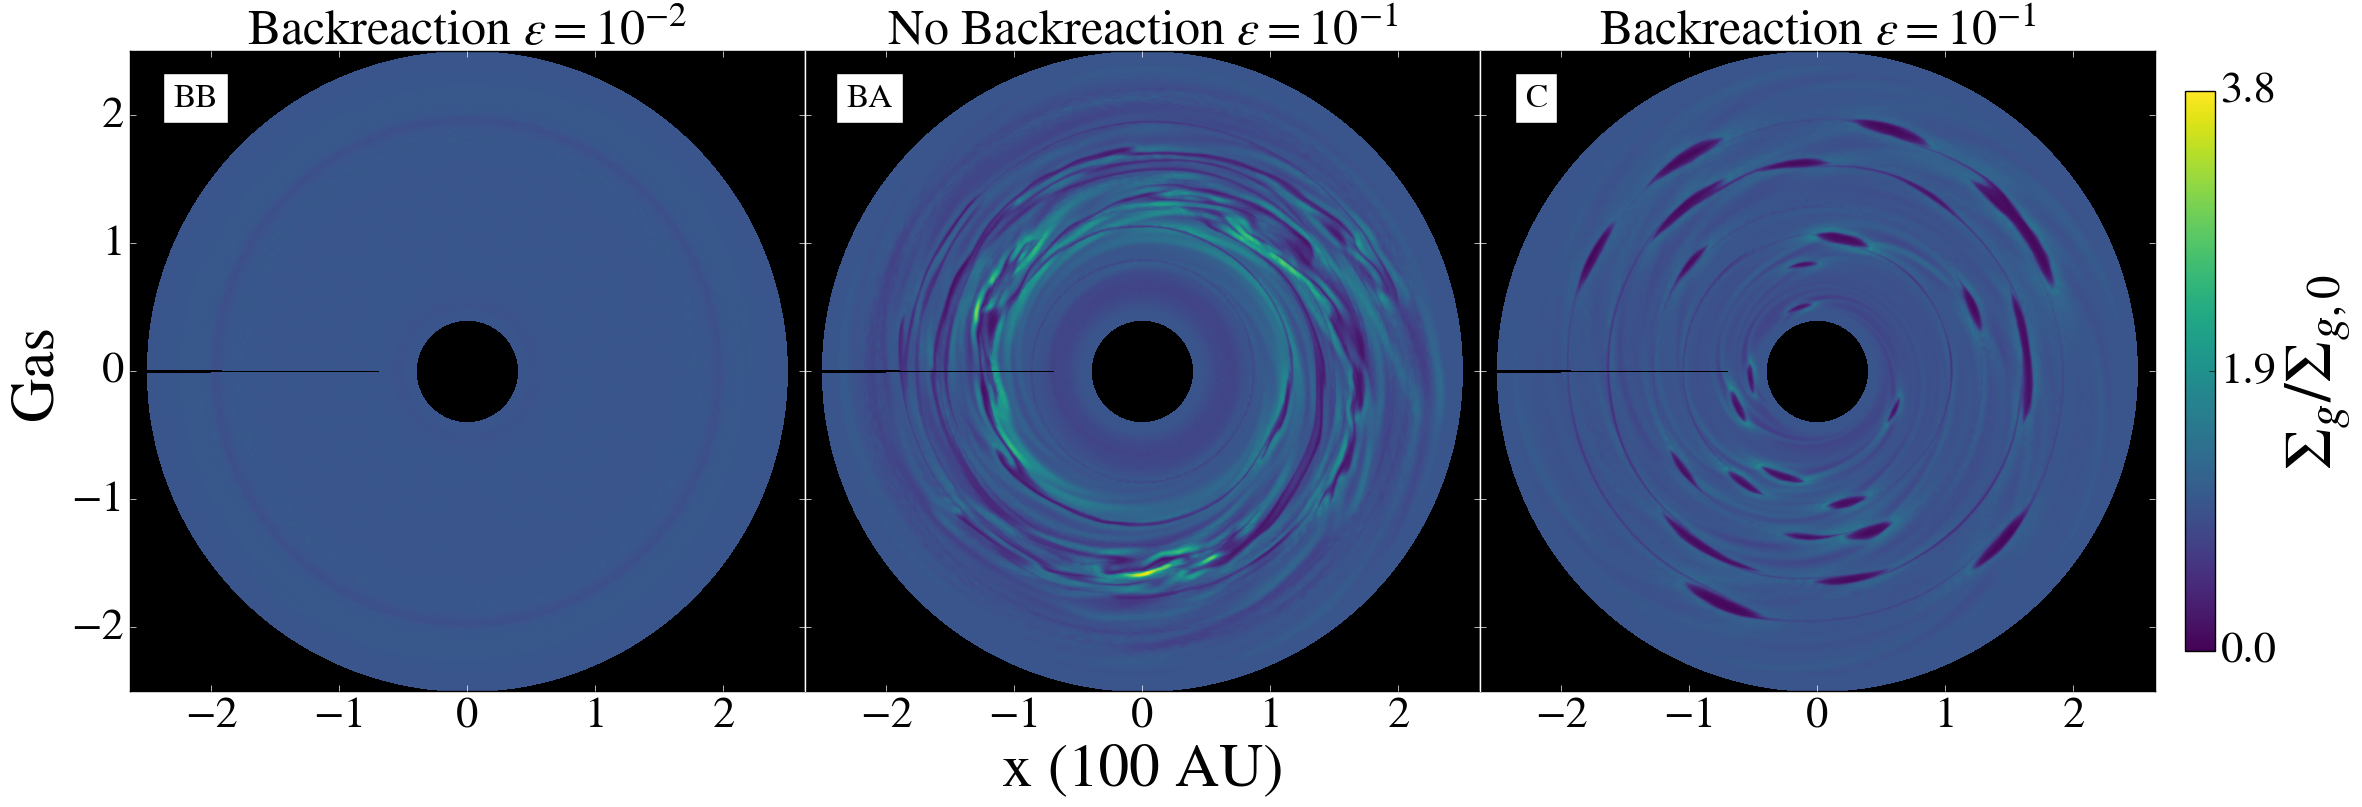
In 9, we check the effect of the dust backreaction for a simulation of . The upper panels show the gas while the lower panels show the dust; the left panels are runs without backreaction, the right panels runs with backreaction. We see that the backreaction indeed confines the dust into shapely and organized structures. The run without backreaction shows spiral features and accumulation of power in high azimuthal wavenumbers, albeit at a lesser degree than in the run in Lyra & Kuchner (2013). We expect that for the backreaction will be less important and thus the structures will be more turbulent. The conclusion is that well-organized PEI structures should be expected only in disks with high dust-to-gas ratio, higher than primordial.
Runs I and J show a disk with PEI and a planet, of and , respectively. The more massive perturber clears out a noticeable gap in the dust. Comparing run J to run H we see no noticeable differences. This echoes the conclusion that only planets that carve substantial gaps can be disentangled from the effect of PEI. For the gas in 8, we see similar results to 6. Runs I & J, which include a planet and PEI, show one important difference. The Lindblad spiral of the Neptune analog, which had already become weaker in run E (), has all but disappeared in run J (), washed out by the stronger effect of the PEI. The Jupiter-mass planet in run I is still visible in the gap showing a gap and the Lindblad spiral.
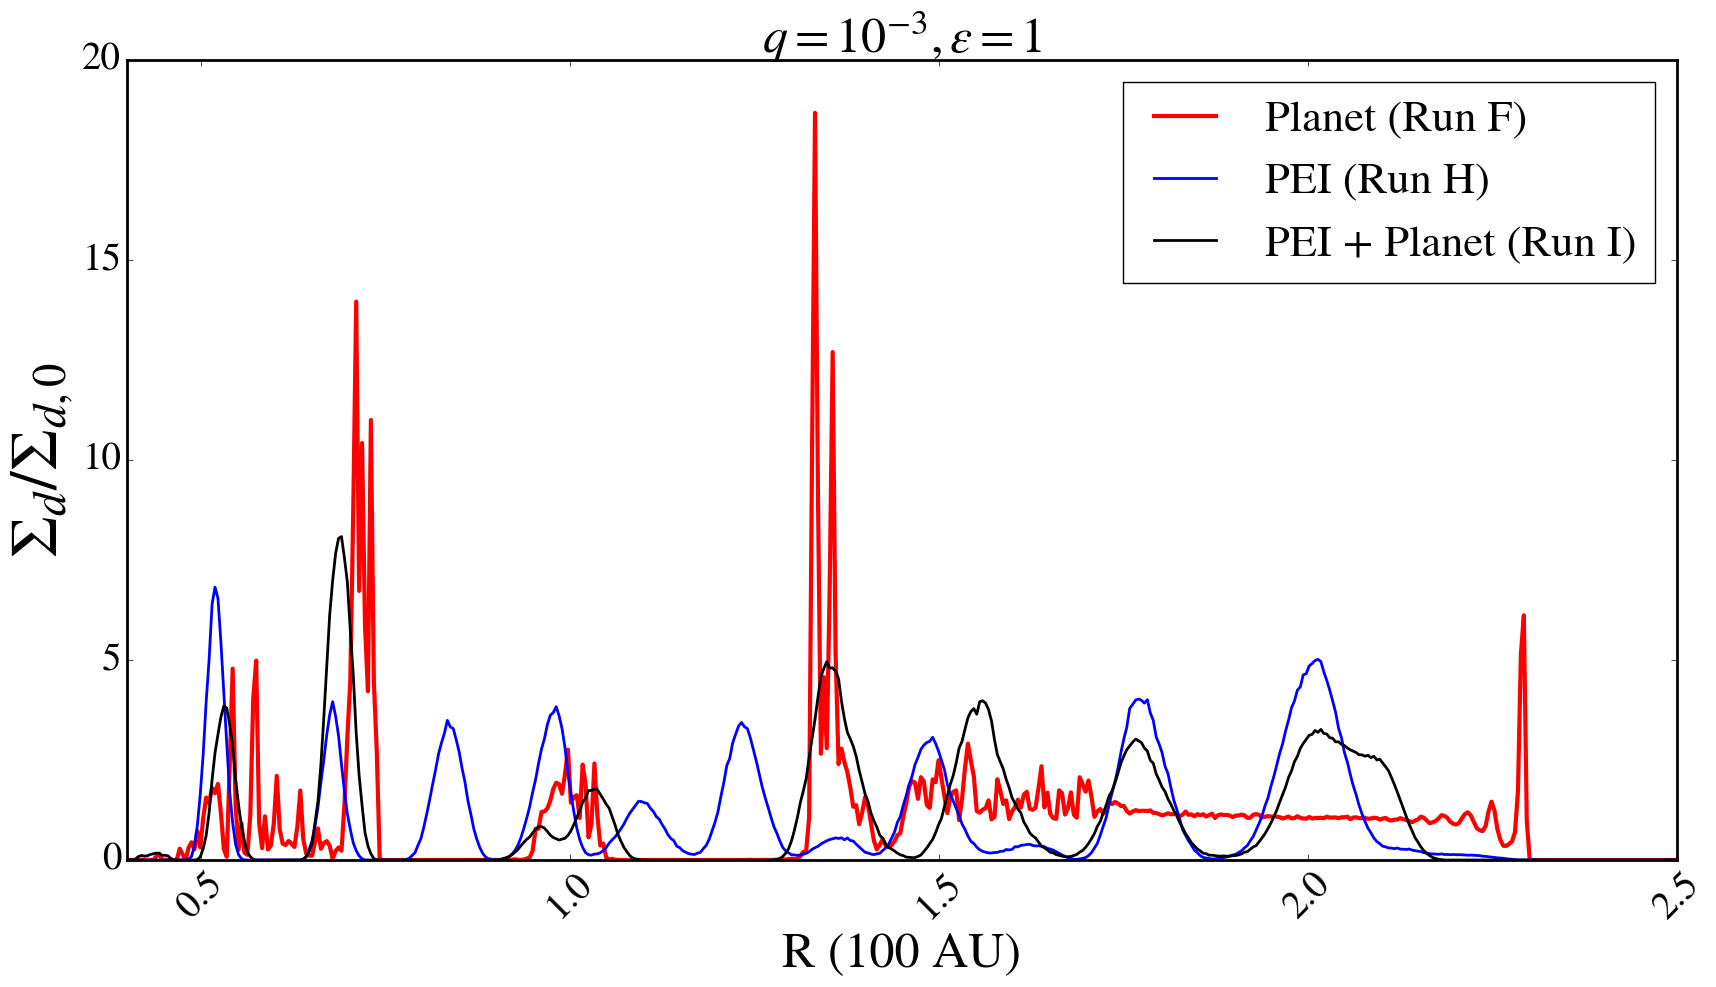
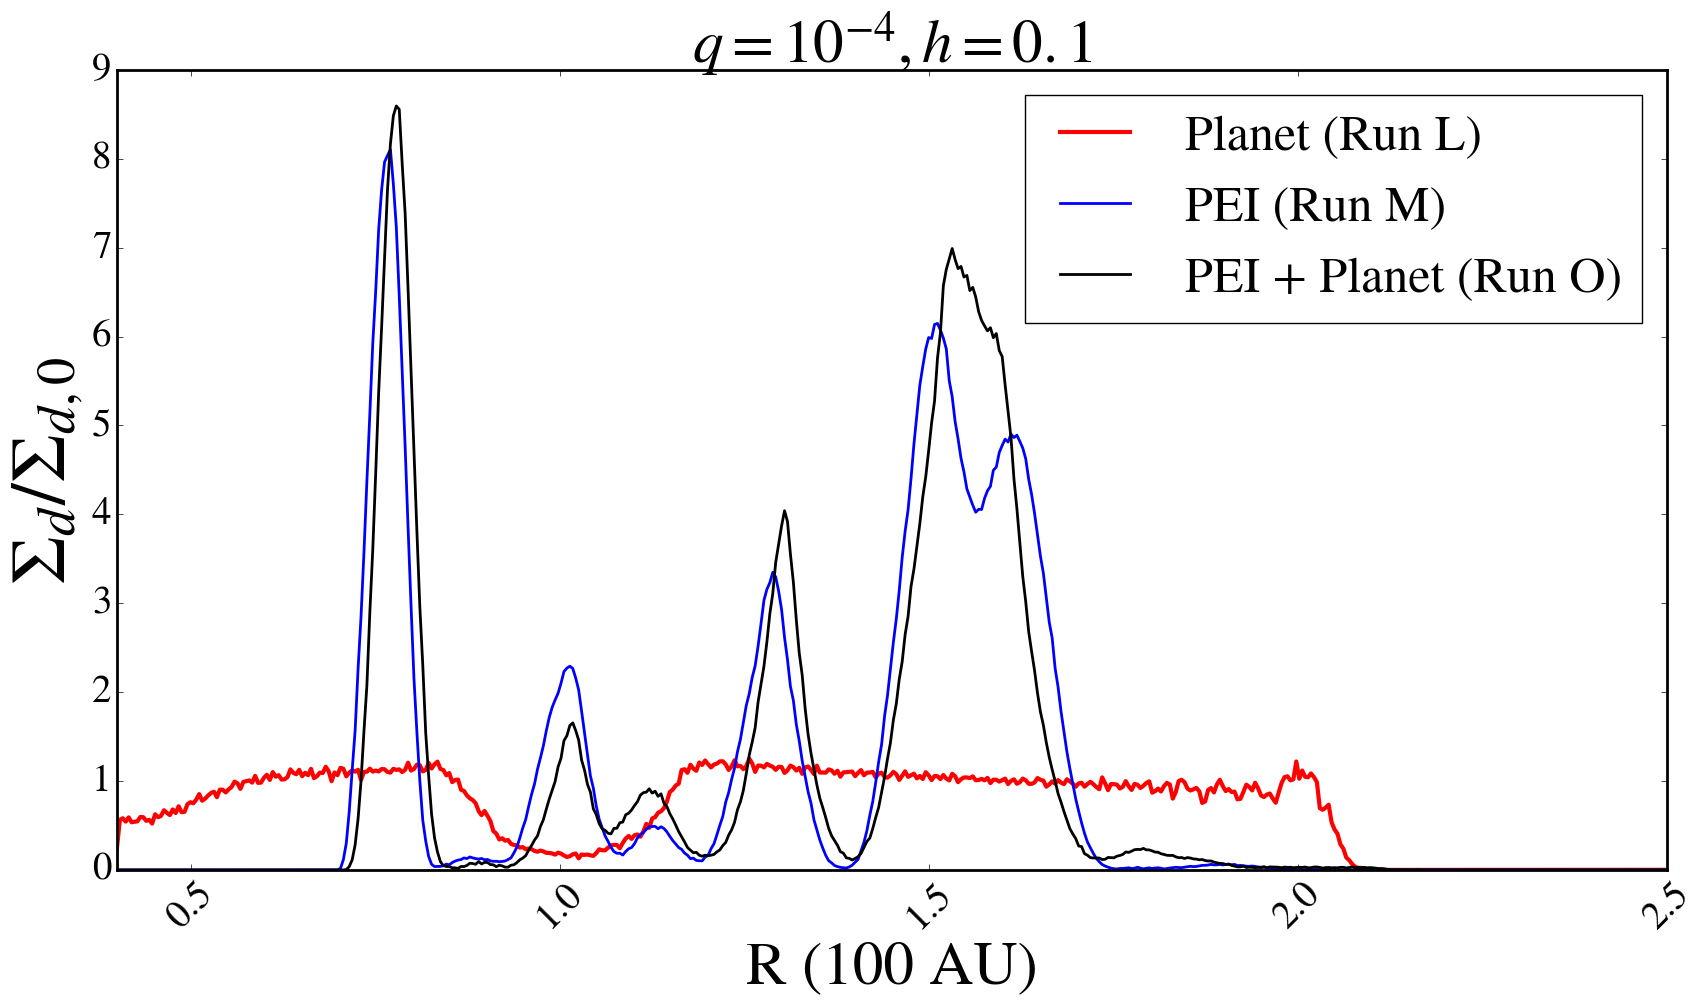
11 is the same as 7, but now the dust-to-gas ratio is equal to unity. For the Jupiter mass planet the dust averages are shown on the left hand side. The dashed red line and the solid black line both contain a planet, and show a depletion of the dust around the location of the planet at . The solid blue line is for a simulation with only PEI, and dust densities are unchanged where . The Neptune case is plotted on the right. Again, the red dashed line and solid black line are for simulations with a planet. The pure instability case, in the solid blue line, coincides almost identically to the case including a planet and PEI, except for the peak near the planet, inside the gap. In this simulation, a case may be made that with sufficient accuracy an observation would be able to distinguish between a PEI (blue line) and a planet+PEI (black line) case, judging by the lower dust peak at in the planet+PEI simulation, so we do not categorically state that the case is hopeless for these lower mass planets, only that significant effort from the observational side would be required to detect such subtle a difference. Our results help on the effort to remove the signatures from hydrodynamical effects in order to unambiguously detect planets in disks, and may be applicable to disks such as HD 141569A and 49 Ceti, where the structures seen qualitatively match those produces by PEI.
3.4. Dependence on thermal mass
Because our results depends on the ability of the planet to carve a gap, the parameter that controls the observability is not the mass of the planet, but the thermal mass. The thermal mass is that for which the Hill radius of the planet equals the scale height of the disk. That yields a mass ratio
| (22) |
For , a Jupiter-mass planet is equivalent to , and the planet to .
Increasing the aspect ratio by a factor 2 (to ) increases the thermal mass by a factor 8. The Jupiter-mass planet should become equivalent to , roughly equivalent to the planet in the case.
We have found the condition that disentangles the carving of a gap from the structures created from the photoelectric instability. We take the radius of the dust gap and the frequency of the photoelectric instability to be and , respectively. In order for the two processes to be differentiated, we must have that . In this regime, the gap is large enough that peaks caused by the instability are within the gap, as is seen in 13 for the Jupiter case. Comparing this to the Neptune case in the same figure , showing no concrete difference between the PEI and combined case.
In the next subsections, we explore the role of temperature.
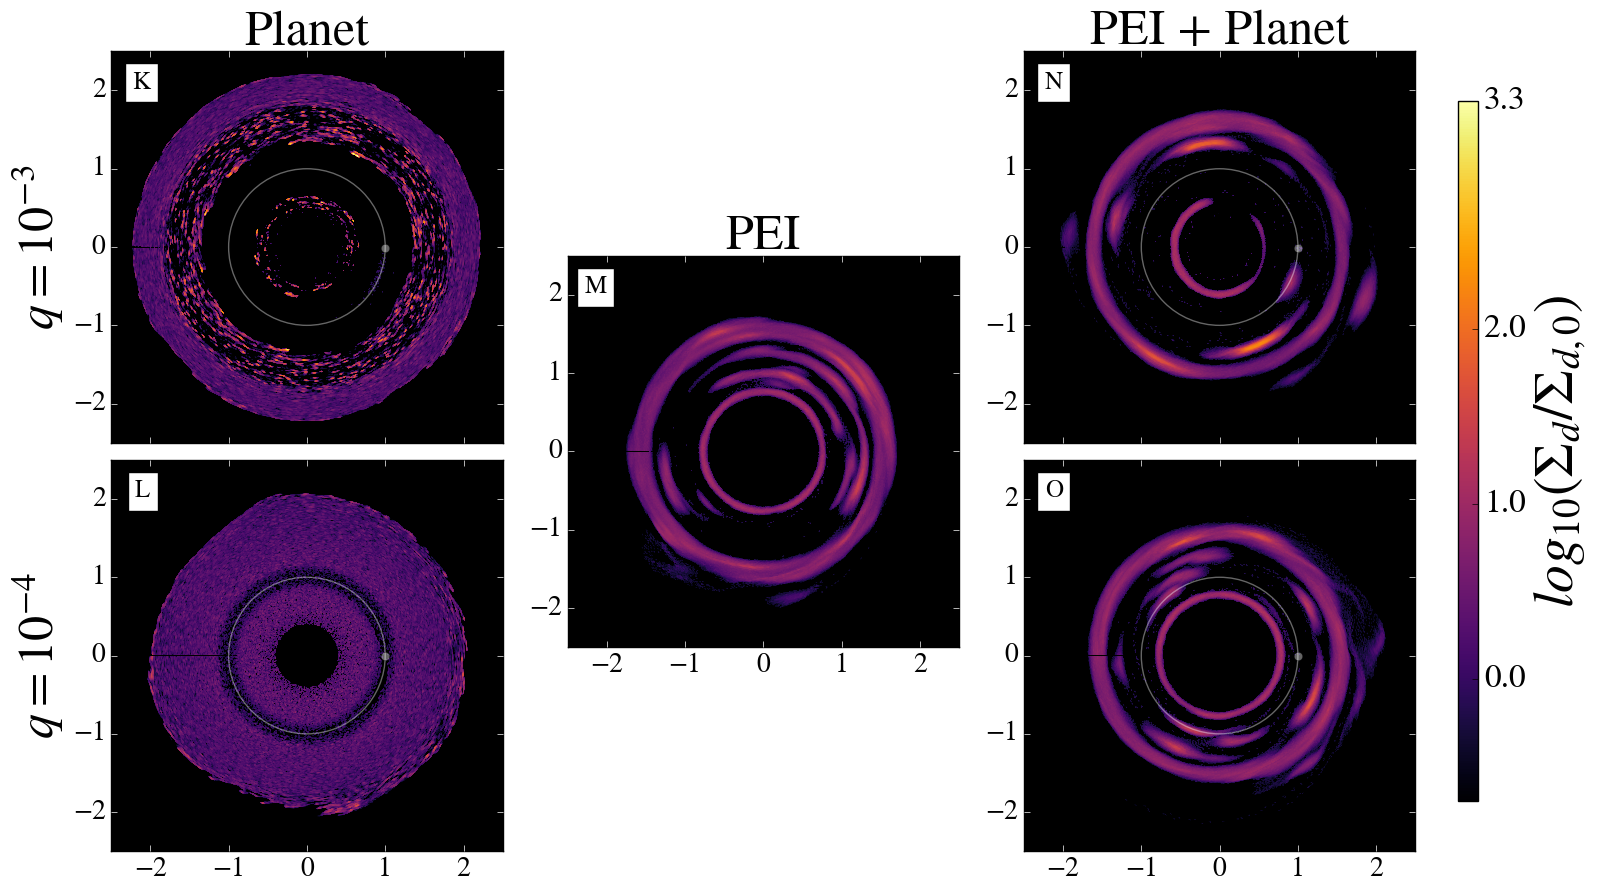
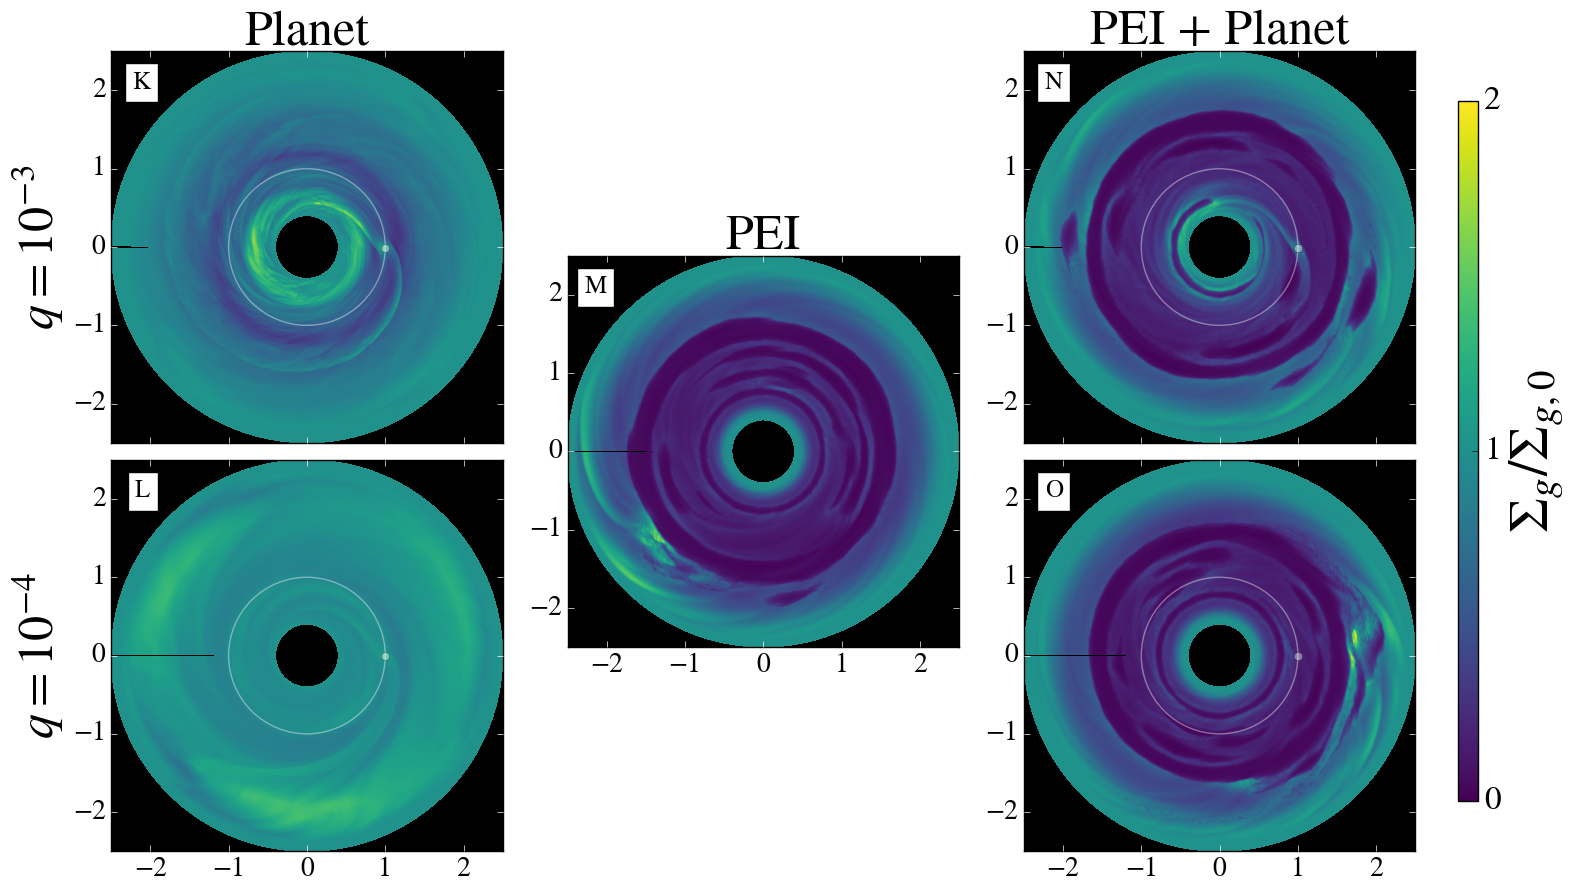
3.4.1 Disk with and
12 shows the dust and gas for a disk of aspect ratio . The top panel plots the dust and the bottom panels the gas, as in the previous cases. The Jupiter mass planet has thermal mass , and the Neptune mass planet . We see that indeed the Neptune analog does not carve a gap in the gas, staying deeply embedded. The Jupiter-mass planet carves a shallower gap, as expected from its thermal mass now being lower than 1.
The dust panel of run L shows departure from axisymmetry and an enhanced dust drift compared to the Jupiter case for elsewise the same parameters (run K). Examining the gas plots below, we notice three prominent structures in run L, at . These structures resemble vortices, but if so, it is curious that they are not trapping dust. This should only happen if the vortices are triggered after the dust has drifted inwards, so that there is no dust to be captured. Indeed, the outer boundary of the dust distribution, seen in the dust panel of run L, is inwards of the radial location of the vortices as seen in the gas panel of the same run.
It is suspicious that this phenomenon occurs near the boundary. Yet run K does not show the vortices, which rules out boundary conditions as culprit. Instead, we conjecture that what we are seeing is Rossby Wave Instability triggered by the dust drift in a high dust-to-gas ratio. As the dust drifts inwards, the dust front constitutes a sharp discontinuity. At high dust-to-gas ratio, the backreaction of the drag force has significant dynamical relevance, so the gas has a different rotational velocity immediately inwards and immediately outward of the dust front. This difference eventually becomes sufficient to trigger the RWI. This is a novel effect, RWI triggered at a dust front. While in this case the dust front is artificial (it would not exist if there was a supply of dust from the outer disk), there are physical situations where a sharp dust discontinuity exists, as in, e.g., the birth ring model. In disks with a birth ring and significant gas, we thus predict that RWI should be triggered in the gas. If the vortices disturb the population of grains in the same way, the birth ring would turn eccentric, as the dust front in run L.
The Jupiter mass planet does not show the same phenomenon because of the reduced dust drift, so the front is still located at the boundary region of the run, where the quantities are driven back to the initial conditions. For the run, we conjecture that the same process would be present, but the dust has not drifted far enough inwards yet for the dust front to be resolved out of the boundary region. The dust drift is proportional to the sub-Keplerian reduction parameter , which is proportional to . Increasing h by a factor 2 increasing the drifting time by a factor 4, making the effect noticeable. Also, the resolution was probably too low to resolve the narrow band of the instability. Increasing to 0.1 doubled the width of the transition, allowing the modes to be resolved.
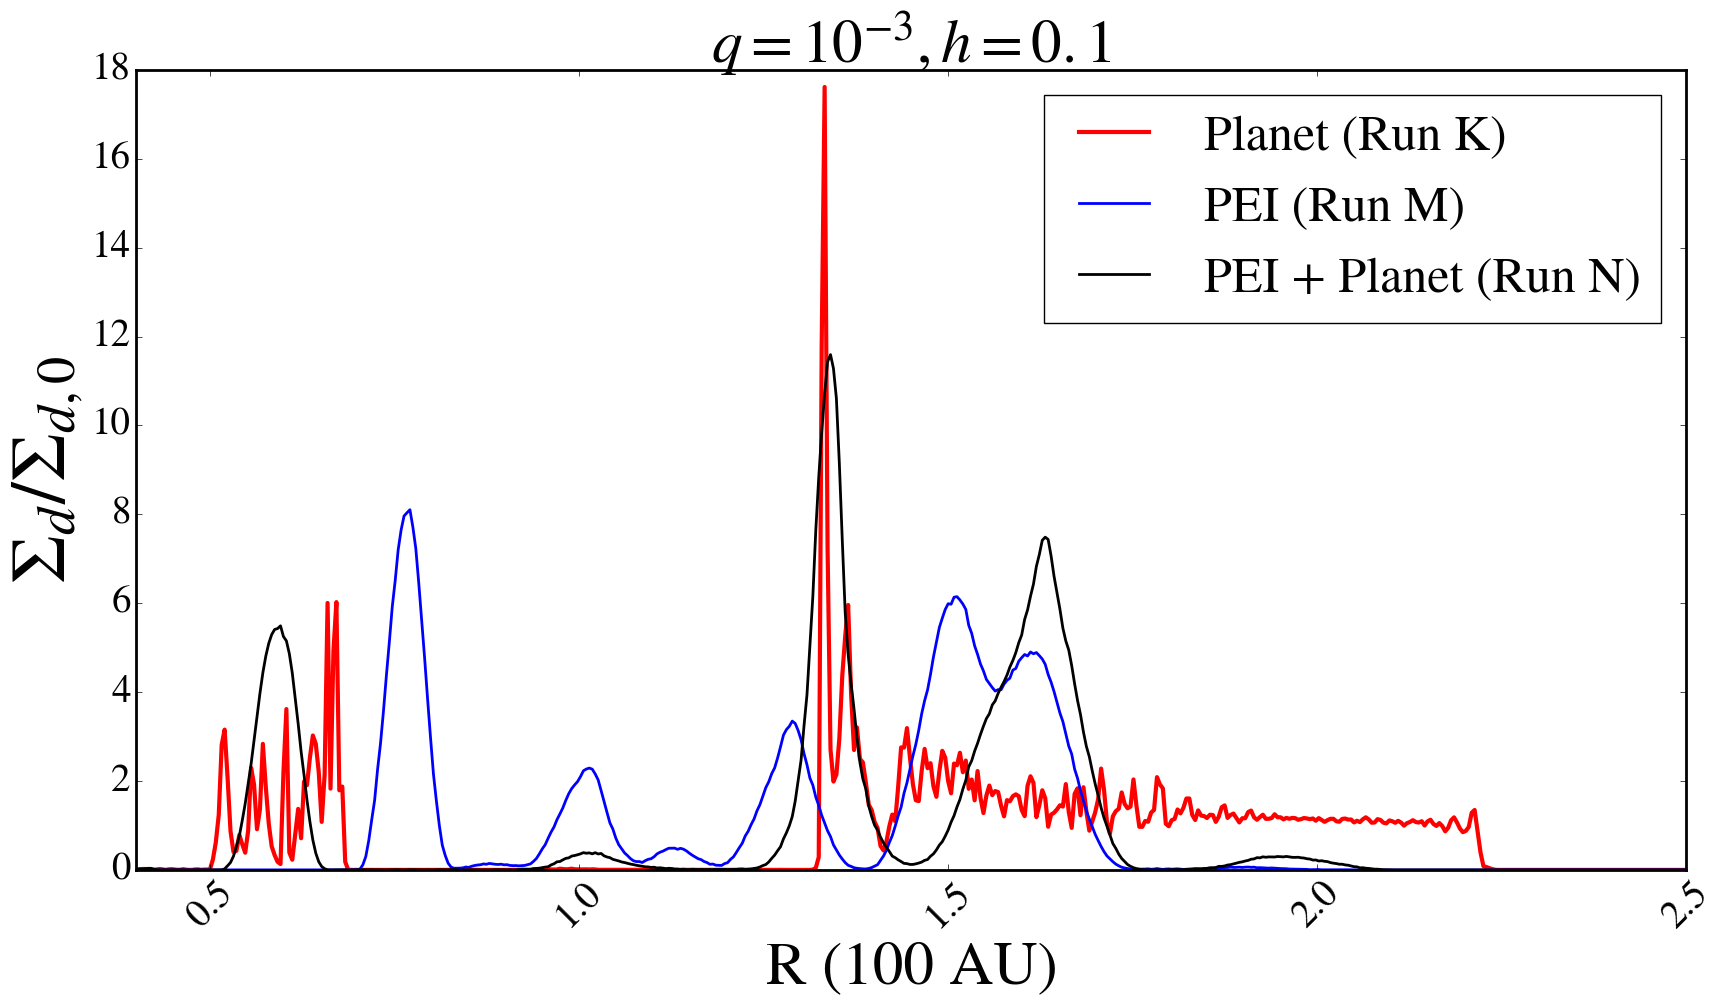
In run M, which is a simulation with PEI and no planet, we see less arcs and more rings than in the case, the structures are thicker also with the increased value of . The gas disk is empty in the center, owing to an increased heating, according to Eq. (10). The gas expands due to the higher temperature, thinning out. At the boundaries it retains the high initial density value because of our boundary condition that drives the quantities back to their initial values.
The combined case of a planet and PEI, shown in runs N and O, shows rings and arcs as well. Run N shows a larger gap, with a lack of dust in the immediate area, apart from two concentrations at 12 and 5 o’clock. Run O, for a lower mass planet shows various arcs and a non-discernable gap in the dust.
3.4.2 Disk with and
Finally, we consider a disk with a scale height of , which is on the hotter side for primordial disks, but fairly typical for the scale heights of debris disks with gas, including Pic. We plot in 14, on the top panel, the dust structures, and in the lower panel the gas structures. For the Jupiter case (upper left) we see a gap carved in the dust. However, for the Neptune case we only see a small ring inward of the planet and nothing outwards. Clearly the dust drift is more intense for the Neptune case. The reason for this is twofold. Firstly, as seen in the gas plots (lower panel), the Jupiter-mass planet, though having a thermal mass of 0.04, carves a very shallow gap. The Neptune mass planet has thermal mass 0.004 and is unable to open a gap. The high density outside the Jupiter-mass planet traps the drifting grains. In the Neptune-mass planet case, they stream past the planet orbit and are trapped at the density maximum inwards of it.
It is curious that although there is not a gas gap, the grains are able to stream past the planet, bypassing the dust filtering that planets usually do. This seems to happen because the drifting time is faster than a planetary orbit. We can compare the time it takes a grain to drift past the corotational region of planet to the orbital period of the planet
| (23) |
If , the drifting is slow and the planet is able to scatter the particle. If on the other hand the planet is too slow and the grain can drift past it. Considering the drift velocity of a grain Youdin (2010)
| (24) |
where is the Keplerian velocity and
| (25) |
is the sub-Keplerian parameter. The time it takes to drift is where is the half-width of the corotational region, given by Paardekooper & Papaloizou (2009)
| (26) |
and the planet’s location. Solving for ,
| (27) | |||||
| (28) |
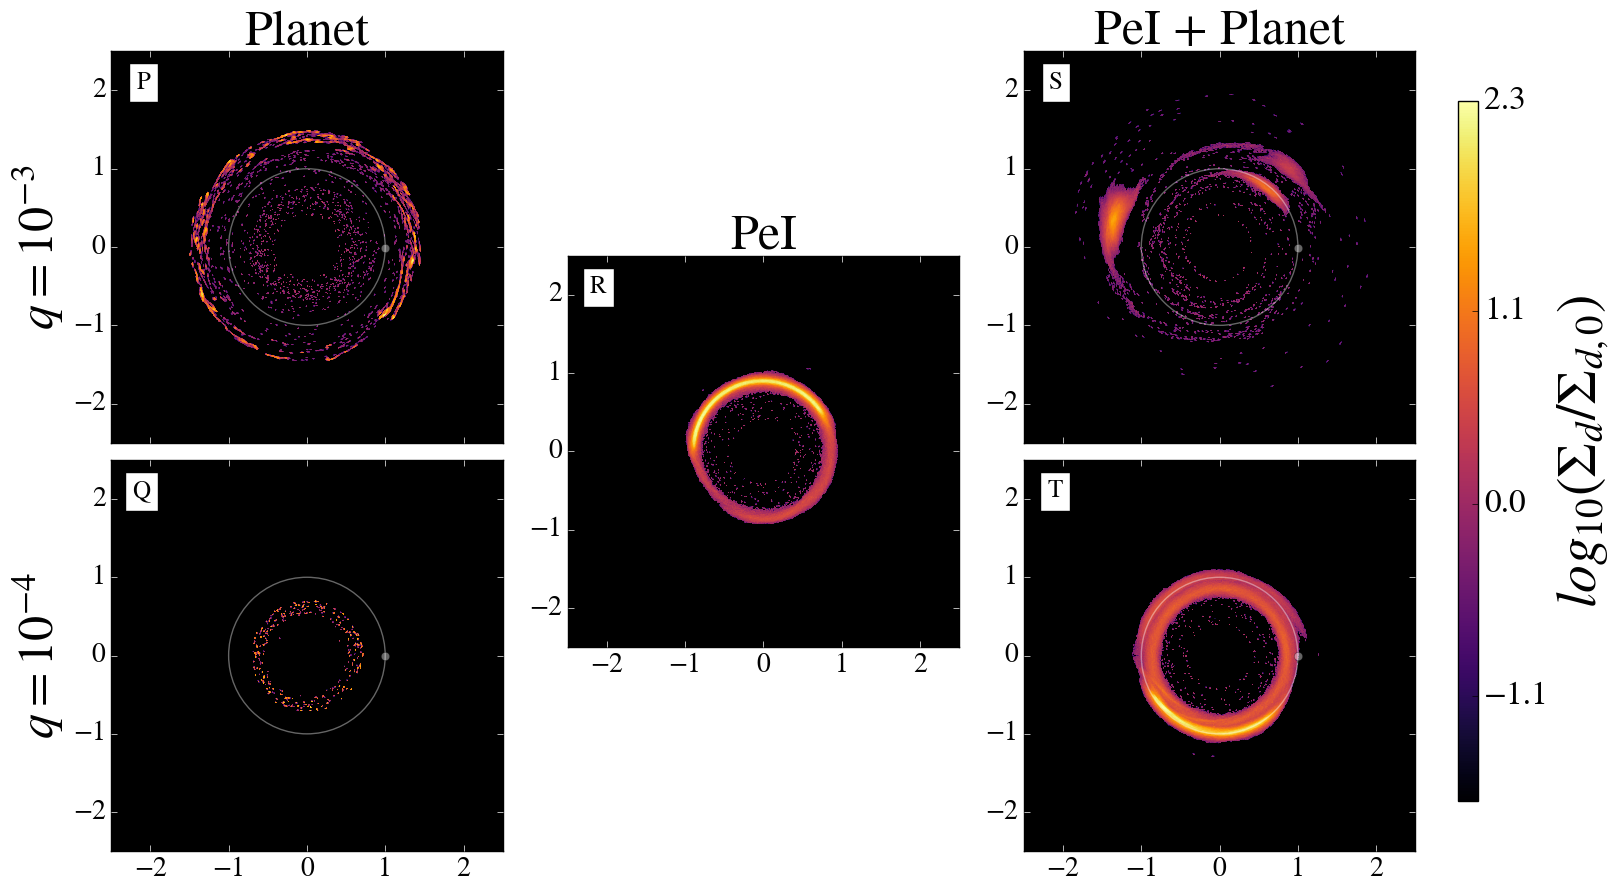
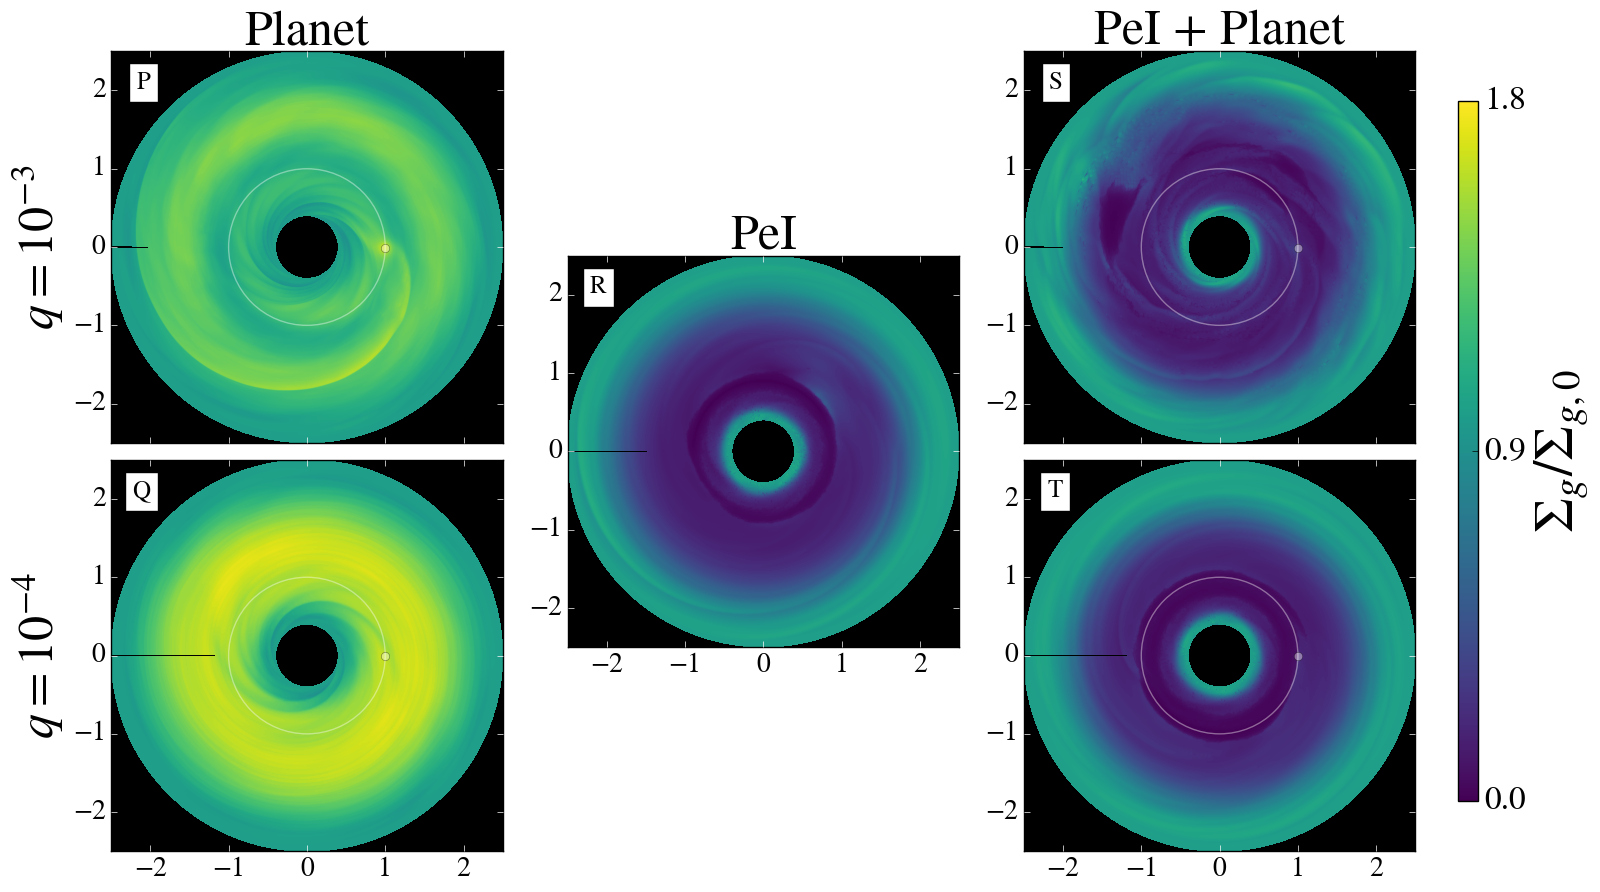
where with and . For , , and considering , we get . For the Jupiter-mass planet, . Thus, it is reasonable to expect that in the Neptune-mass case the grains can drift past the corotational region in this hot disk but that the Jupiter-mass planet, with a larger corotational region, will be able to scatter the grains and carve a deep dust gap 555 Built-in in this estimate is our assumption that the Stokes number is constant. In fact, if a planet carves a deep gas gap, the Stokes number should go to infinity (as there is not gas, there is no drag). As such, this analysis applies only to partially depleted gaps (low and intermediate-mass planets).. In the simulation with photoelectric instability (run R), we see a much denser ring of dust in the center of the domain. The combined case of instability plus planet (runs S and T) are shown in the plots in the right hand side. For the massive planet (run S) the main differences are that the grains, instead of being scattered roughly uniformly as in run P, now concentrates in arcs. In addition, an arc coinciding with the location of the Lagrange point L5 is prominent. The lower mass planet (run T) seems indistinguishable from the pure instability case (run R).
The behavior of the gas (lower plots) resembles the situation with . The gas density is much lowered throughout most of the disk due to the enhanced photoelectric heating, being driven back to the initial value at the boundaries. A spiral is barely discernible for Jupiter-mass planet. No clear distinction is present for the lower mass planet.
4. Caveats
The presented models are admittedly simplified. In this section, we state what we consider the main limitations of our calculations to be.
The most stringent limitation of the models is the 2D approximation. The twodimensionality imposes that the vertical direction is degenerate, so we do not resolve the vertical scale height. As a result the backreaction of the drag force is largely underestimated. In 3D, the midplane grain layer would be far denser due to sedimentation.
Another caveat is that we kept the Stokes number constant. In reality, the Stokes number in the Epstein regime should depend on density and temperature, according to Eq. (11). The effect of a self-consistent Stokes number in the PEI has not been explored, but it is not expected to be significant – as dust concentrates they increase the gas temperature, which also decreases the density through gas expansion. The former decreases , the latter increases , so both combined mitigate the effect on .
5. Conclusions
In this paper we have considered for the first time disk-planet interaction in the presence of photoelectric instability. We also study for the first time planet–disk interaction for disks of dust-to-gas ratio around unity, where gas and dust have similar inertia and none dominate over the other.
We find that the gaps carved in disks with dust and gas deviate from the gas-only case when the local dust-to-gas ratio approaches unity. The gap walls, because they are dust traps, are the places where the deviation occurs. At global dust-to-gas ratio , the effect starts to become noticeable as a slightly reduction in the height of the gap wall. For and , the gap wall is significantly depressed as the local dust enhancement goes well above unity. This result does not depend on photoelectric instability and thus applies to optically thick (primordial and gas-rich transition) disks as well.
Our simulations show that when photoelectric instability is included, the features produced by low-mass planets are not conspicuous enough to be distinguishable from the features produced by the instability alone. The signature of gap carving and a conspicuous spiral are the tell-tale signatures of planets, as is usual for conventional transition disks. The most clear sign of a planet is a radial clearing in the PEI-induced structures, wider than the typical separation between them. That is, we can distinguish a planet amid of photoelectric instability structures if the planet carves a dust gap larger than the wavelength of the photoelectric instability. Quantitatively, we can state that the criterion to distinguish a planet in a disk with photoelectric instability is , where is the radial width of the dust gap and the wavelength of the instability. The quantity is the simpler one to quantify. The boundary of the dust gap is located at the edge of the gas gap, that functions as a dust trap. As for , linear instability analysis predicts growth even for (Lyra & Kuchner, 2013). Regularizing with viscosity produces the most unstable wavelength of the order of the scale of viscous dissipation, which is very small in primordial and transitional disks, but of
order AU inlate transition and debris disks. Yet, a 3D run in (Lyra & Kuchner, 2013) shows ring spacing of for a simulation with grid resolution , i.e., , and thus far from the viscous range. A specific prediction for is still lacking in the literature, a situation that is compounded by the fact that the PEI also exists in the nonlinear regime.
Our simulations also show that the PEI leads to well-defined sharp structures only for high dust-to-gas ratios, because of the pivotal role of the drag force backreaction in confining the dust. Simulations without backreaction, or with too little dust, , easily break into spiral structures and turbulence. We conclude that well-organized PEI structures should be expected only in disks with dust-to-gas ratio higher than primordial.
Finally, incomplete arcs are not produced in the simulations with planets alone: they require the photoelectric instability. However, we did not consider situations with self-gravity, which is thought to be a component in a possible mechanism to maintain incomplete arcs in the ring system of Neptune (Namouni & Porco, 2002; Tsui, 2018), albeit unlikely in the case of debris disks, of very low mass, to produce a noticeable effect.
The models of Richert et al. (2018) show that radiation pressure can have a significant effect on the global dust distributions of optically thin disks. The models we present in Section 3 are most straightforwardly applicable to optically thin disks around low-mass stars (spectral types K and M) and white dwarfs, whose low luminosities imply a minimal amount of radiation pressure even on small, well-coupled () grains. On the other hand, for more luminous stars, the greater radiation pressure will likely cause the disk morphologies to deviate substantially from the models presented in this paper. Nonetheless, our models and those of Richert et al. (2018) demonstrate that radiation pressure, massive planets, and the photoelectric instability can all play an important role in shaping optically thin disks, suggesting that future models should more extensively explore the combination of these and other effects. In particular, the MRI is another potentially important process in such systems (Kral & Latter, 2016) whose interplay with these other processes remains poorly explored.
References
- Andrews et al. (2011) Andrews, S. M., Wilner, D. J., Espaillat, C., Hughes, A. M., Dullemond, C. P., McClure, M. K., Qi, C., & Brown, J. M. 2011, ApJ, 732, 42
- Benisty et al. (2015) Benisty, M., Juhasz, A., Boccaletti, A., Avenhaus, H., Milli, J., Thalmann, C., Dominik, C., Pinilla, P., Buenzli, E., Pohl, A., Beuzit, J.-L., Birnstiel, T., de Boer, J., Bonnefoy, M., Chauvin, G., Christiaens, V., Garufi, A., Grady, C., Henning, T., Huelamo, N., Isella, A., Langlois, M., Ménard, F., Mouillet, D., Olofsson, J., Pantin, E., Pinte, C., & Pueyo, L. 2015, A&A, 578, L6
- Besla & Wu (2007) Besla, G., & Wu, Y. 2007, ApJ, 655, 528
- Chen & Jura (2003) Chen, C. H., & Jura, M. 2003, ApJ, 591, 267
- Chiang et al. (2009) Chiang, E., Kite, E., Kalas, P., Graham, J. R., & Clampin, M. 2009, ApJ, 693, 734
- Currie et al. (2016) Currie, T., Grady, C. A., Cloutier, R., Konishi, M., Stassun, K., Debes, J., van der Marel, N., Muto, T., Jayawardhana, R., & Ratzka, T. 2016, ApJ, 819, L26
- Currie & Kenyon (2009) Currie, T., & Kenyon, S. J. 2009, AJ, 138, 703
- Currie et al. (2014) Currie, T., Muto, T., Kudo, T., Honda, M., Brandt, T. D., Grady, C., Fukagawa, M., Burrows, A., Janson, M., Kuzuhara, M., McElwain, M. W., Follette, K., Hashimoto, J., Henning, T., Kandori, R., Kusakabe, N., Kwon, J., Mede, K., Morino, J.-i., Nishikawa, J., Pyo, T.-S., Serabyn, G., Suenaga, T., Takahashi, Y., Wisniewski, J., & Tamura, M. 2014, ApJ, 796, L30
- Czechowski & Mann (2007) Czechowski, A., & Mann, I. 2007, ApJ, 660, 1541
- de Val-Borro et al. (2007) de Val-Borro, M., Artymowicz, P., D’Angelo, G., & Peplinski, A. 2007, A&A, 471, 1043
- de Val-Borro et al. (2006) de Val-Borro, M., Edgar, R. G., Artymowicz, P., Ciecielag, P., Cresswell, P., D’Angelo, G., Delgado-Donate, E. J., Dirksen, G., Fromang, S., Gawryszczak, A., Klahr, H., Kley, W., Lyra, W., Masset, F., Mellema, G., Nelson, R. P., Paardekooper, S.-J., Peplinski, A., Pierens, A., Plewa, T., Rice, K., Schäfer, C., & Speith, R. 2006, MNRAS, 370, 529
- Dipierro & Laibe (2017) Dipierro, G., & Laibe, G. 2017, MNRAS, 469, 1932
- Dong & Dawson (2016) Dong, R., & Dawson, R. 2016, ApJ, 825, 77
- Dong & Fung (2017) Dong, R., & Fung, J. 2017, ApJ, 835, 146
- Dong et al. (2016) Dong, R., Fung, J., & Chiang, E. 2016, ApJ, 826, 75
- Dong et al. (2015) Dong, R., Hall, C., Rice, K., & Chiang, E. 2015, ApJ, 812, L32
- Dong et al. (2017) Dong, R., van der Marel, N., Hashimoto, J., Chiang, E., Akiyama, E., Liu, H. B., Muto, T., Knapp, G. R., Tsukagoshi, T., Brown, J., Bruderer, S., Koyamatsu, S., Kudo, T., Ohashi, N., Rich, E., Satoshi, M., Takami, M., Wisniewski, J., Yang, Y., Zhu, Z., & Tamura, M. 2017, ApJ, 836, 201
- France et al. (2007) France, K., Roberge, A., Lupu, R. E., Redfield, S., & Feldman, P. D. 2007, ApJ, 668, 1174
- Grady et al. (2013) Grady, C. A., Muto, T., Hashimoto, J., Fukagawa, M., Currie, T., Biller, B., Thalmann, C., Sitko, M. L., Russell, R., Wisniewski, J., Dong, R., Kwon, J., Sai, S., Hornbeck, J., Schneider, G., Hines, D., Moro Martín, A., Feldt, M., Henning, T., Pott, J.-U., Bonnefoy, M., Bouwman, J., Lacour, S., Mueller, A., Juhász, A., Crida, A., Chauvin, G., Andrews, S., Wilner, D., Kraus, A., Dahm, S., Robitaille, T., Jang-Condell, H., Abe, L., Akiyama, E., Brandner, W., Brandt, T., Carson, J., Egner, S., Follette, K. B., Goto, M., Guyon, O., Hayano, Y., Hayashi, M., Hayashi, S., Hodapp, K., Ishii, M., Iye, M., Janson, M., Kandori, R., Knapp, G., Kudo, T., Kusakabe, N., Kuzuhara, M., Mayama, S., McElwain, M., Matsuo, T., Miyama, S., Morino, J.-I., Nishimura, T., Pyo, T.-S., Serabyn, G., Suto, H., Suzuki, R., Takami, M., Takato, N., Terada, H., Tomono, D., Turner, E., Watanabe, M., Yamada, T., Takami, H., Usuda, T., & Tamura, M. 2013, ApJ, 762, 48
- Grigorieva et al. (2007) Grigorieva, A., Thébault, P., Artymowicz, P., & Brandeker, A. 2007, A&A, 475, 755
- Hales et al. (2017) Hales, A. S., Barlow, M. J., Crawford, I. A., & Casassus, S. 2017, MNRAS, 466, 3582
- Hord et al. (2017) Hord, B., Lyra, W., Flock, M., Turner, N. J., & Mac Low, M.-M. 2017, ApJ, 849, 164
- Hornbeck et al. (2016) Hornbeck, J. B., Swearingen, J. R., Grady, C. A., Williger, G. M., Brown, A., Sitko, M. L., Wisniewski, J. P., Perrin, M. D., Lauroesch, J. T., Schneider, G., Apai, D., Brittain, S., Brown, J. M., Champney, E. H., Hamaguchi, K., Henning, T., Lynch, D. K., Petre, R., Russell, R. W., Walter, F. M., & Woodgate, B. 2016, ApJ, 829, 65
- Johansen et al. (2007) Johansen, A., Oishi, J. S., Mac Low, M.-M., Klahr, H., Henning, T., & Youdin, A. 2007, Nature, 448, 1022
- Jonkheid et al. (2004) Jonkheid, B., Faas, F. G. A., van Zadelhoff, G.-J., & van Dishoeck, E. F. 2004, A&A, 428, 511
- Kamp & van Zadelhoff (2004) Kamp, I., & van Zadelhoff, G.-J. 2004, in IAU Symposium, Vol. 202, Planetary Systems in the Universe, ed. A. Penny, 344
- Keppler et al. (2018) Keppler, M., Benisty, M., Müller, A., Henning, T., van Boekel, R., Cantalloube, F., Ginski, C., van Holstein, R. G., Maire, A.-L., Pohl, A., Samland, M., Avenhaus, H., Baudino, J.-L., Boccaletti, A., de Boer, J., Bonnefoy, M., Chauvin, G., Desidera, S., Langlois, M., Lazzoni, C., Marleau, G.-D., Mordasini, C., Pawellek, N., Stolker, T., Vigan, A., Zurlo, A., Birnstiel, T., Brandner, W., Feldt, M., Flock, M., Girard, J., Gratton, R., Hagelberg, J., Isella, A., Janson, M., Juhasz, A., Kemmer, J., Kral, Q., Lagrange, A.-M., Launhardt, R., Matter, A., Ménard, F., Milli, J., Mollière, P., Olofsson, J., Pérez, L., Pinilla, P., Pinte, C., Quanz, S. P., Schmidt, T., Udry, S., Wahhaj, Z., Williams, J. P., Buenzli, E., Cudel, M., Dominik, C., Galicher, R., Kasper, M., Lannier, J., Mesa, D., Mouillet, D., Peretti, S., Perrot, C., Salter, G., Sissa, E., Wildi, F., Abe, L., Antichi, J., Augereau, J.-C., Baruffolo, A., Baudoz, P., Bazzon, A., Beuzit, J.-L., Blanchard, P., Brems, S. S., Buey, T., De Caprio, V., Carbillet, M., Carle, M., Cascone, E., Cheetham, A., Claudi, R., Costille, A., Delboulbé, A., Dohlen, K., Fantinel, D., Feautrier, P., Fusco, T., Giro, E., Gluck, L., Gry, C., Hubin, N., Hugot, E., Jaquet, M., Le Mignant, D., Llored, M., Madec, F., Magnard, Y., Martinez, P., Maurel, D., Meyer, M., Möller-Nilsson, O., Moulin, T., Mugnier, L., Origné, A., Pavlov, A., Perret, D., Petit, C., Pragt, J., Puget, P., Rabou, P., Ramos, J., Rigal, F., Rochat, S., Roelfsema, R., Rousset, G., Roux, A., Salasnich, B., Sauvage, J.-F., Sevin, A., Soenke, C., Stadler, E., Suarez, M., Turatto, M., & Weber, L. 2018, A&A, 617, A44
- Klahr & Lin (2005) Klahr, H., & Lin, D. N. C. 2005, ApJ, 632, 1113
- Kley & Nelson (2012) Kley, W., & Nelson, R. P. 2012, ARA&A, 50, 211
- Konishi et al. (2016) Konishi, M., Grady, C. A., Schneider, G., Shibai, H., McElwain, M. W., Nesvold, E. R., Kuchner, M. J., Carson, J., Debes, J. H., Gaspar, A., Henning, T. K., Hines, D. C., Hinz, P. M., Jang-Condell, H., Moro-Martín, A., Perrin, M., Rodigas, T. J., Serabyn, E., Silverstone, M. D., Stark, C. C., Tamura, M., Weinberger, A. J., & Wisniewski, J. P. 2016, ApJ, 818, L23
- Kral & Latter (2016) Kral, Q., & Latter, H. 2016, MNRAS, 461, 1614
- Kuchner & Holman (2003) Kuchner, M. J., & Holman, M. J. 2003, ApJ, 588, 1110
- Lieman-Sifry et al. (2016) Lieman-Sifry, J., Hughes, A. M., Carpenter, J. M., Gorti, U., Hales, A., & Flaherty, K. M. 2016, ApJ, 828, 25
- Lovelace et al. (1999) Lovelace, R., Li, H., Colgate, S., & Nelson, A. 1999, ApJ, 513, 805
- Lyra & Kuchner (2013) Lyra, W., & Kuchner, M. 2013, Nature, 499, 184
- Lyra & Lin (2013) Lyra, W., & Lin, M.-K. 2013, ApJ, 775, 17
- Lyra et al. (2017) Lyra, W., McNally, C. P., Heinemann, T., & Masset, F. 2017, ArXiv e-prints
- Marino et al. (2016) Marino, S., Matrà, L., Stark, C., Wyatt, M. C., Casassus, S., Kennedy, G., Rodriguez, D., Zuckerman, B., Perez, S., Dent, W. R. F., Kuchner, M., Hughes, A. M., Schneider, G., Steele, A., Roberge, A., Donaldson, J., & Nesvold, E. 2016, MNRAS, 460, 2933
- Marino et al. (2017) Marino, S., Wyatt, M. C., Panić, O., Matrà, L., Kennedy, G. M., Bonsor, A., Kral, Q., Dent, W. R. F., Duchene, G., Wilner, D., Lisse, C. M., Lestrade, J.-F., & Matthews, B. 2017, MNRAS, 465, 2595
- Masset (2000) Masset, F. 2000, A&AS, 141, 165
- McNally et al. (2012) McNally, C. P., Maron, J. L., & Mac Low, M.-M. 2012, ApJS, 200, 7
- Moór et al. (2011) Moór, A., Ábrahám, P., Juhász, A., Kiss, C., Pascucci, I., Kóspál, Á., Apai, D., Henning, T., Csengeri, T., & Grady, C. 2011, ApJ, 740, L7
- Moór et al. (2015) Moór, A., Henning, T., Juhász, A., Ábrahám, P., Balog, Z., Kóspál, Á., Pascucci, I., Szabó, G. M., Vavrek, R., Curé, M., Csengeri, T., Grady, C., Güsten, R., & Kiss, C. 2015, ApJ, 814, 42
- Müller et al. (2018) Müller, A., Keppler, M., Henning, T., Samland, M., Chauvin, G., Beust, H., Maire, A.-L., Molaverdikhani, K., van Boekel, R., Benisty, M., Boccaletti, A., Bonnefoy, M., Cantalloube, F., Charnay, B., Baudino, J.-L., Gennaro, M., Long, Z. C., Cheetham, A., Desidera, S., Feldt, M., Fusco, T., Girard, J., Gratton, R., Hagelberg, J., Janson, M., Lagrange, A.-M., Langlois, M., Lazzoni, C., Ligi, R., Ménard, F., Mesa, D., Meyer, M., Mollière, P., Mordasini, C., Moulin, T., Pavlov, A., Pawellek, N., Quanz, S. P., Ramos, J., Rouan, D., Sissa, E., Stadler, E., Vigan, A., Wahhaj, Z., Weber, L., & Zurlo, A. 2018, A&A, 617, L2
- Murray & Dermott (1999) Murray, C. D., & Dermott, S. F. 1999, Solar system dynamics
- Muto et al. (2012) Muto, T., Grady, C. A., Hashimoto, J., Fukagawa, M., Hornbeck, J. B., Sitko, M., Russell, R., Werren, C., Curé, M., Currie, T., Ohashi, N., Okamoto, Y., Momose, M., Honda, M., Inutsuka, S., Takeuchi, T., Dong, R., Abe, L., Brandner, W., Brandt, T., Carson, J., Egner, S., Feldt, M., Fukue, T., Goto, M., Guyon, O., Hayano, Y., Hayashi, M., Hayashi, S., Henning, T., Hodapp, K. W., Ishii, M., Iye, M., Janson, M., Kandori, R., Knapp, G. R., Kudo, T., Kusakabe, N., Kuzuhara, M., Matsuo, T., Mayama, S., McElwain, M. W., Miyama, S., Morino, J.-I., Moro-Martin, A., Nishimura, T., Pyo, T.-S., Serabyn, E., Suto, H., Suzuki, R., Takami, M., Takato, N., Terada, H., Thalmann, C., Tomono, D., Turner, E. L., Watanabe, M., Wisniewski, J. P., Yamada, T., Takami, H., Usuda, T., & Tamura, M. 2012, ApJ, 748, L22
- Namouni & Porco (2002) Namouni, F., & Porco, C. 2002, Nature, 417, 45
- Paardekooper & Mellema (2004) Paardekooper, S.-J., & Mellema, G. 2004, A&A, 425, L9
- Paardekooper & Papaloizou (2009) Paardekooper, S.-J., & Papaloizou, J. C. B. 2009, MNRAS, 394, 2297
- Redfield (2007) Redfield, S. 2007, ApJ, 656, L97
- Richert et al. (2018) Richert, A. J. W., Lyra, W., & Kuchner, M. J. 2018, ApJ, 856, 41
- Riviere-Marichalar et al. (2014) Riviere-Marichalar, P., Barrado, D., Montesinos, B., Duchêne, G., Bouy, H., Pinte, C., Menard, F., Donaldson, J., Eiroa, C., Krivov, A. V., Kamp, I., Mendigutía, I., Dent, W. R. F., & Lillo-Box, J. 2014, A&A, 565, A68
- Roberge & Weinberger (2008) Roberge, A., & Weinberger, A. J. 2008, ApJ, 676, 509
- Thi et al. (2001) Thi, W. F., Blake, G. A., van Dishoeck, E. F., van Zadelhoff, G. J., Horn, J. M. M., Becklin, E. E., Mannings, V., Sargent, A. I., van den Ancker, M. E., & Natta, A. 2001, Nature, 409, 60
- Tsui (2018) Tsui, K. H. 2018, arXiv e-prints
- Welsh & Montgomery (2013) Welsh, B. Y., & Montgomery, S. 2013, PASP, 125, 759
- Whipple (1972) Whipple, F. L. 1972, in From Plasma to Planet, ed. A. Elvius, 211
- Youdin (2010) Youdin, A. N. 2010, in EAS Publications Series, Vol. 41, EAS Publications Series, ed. T. Montmerle, D. Ehrenreich, & A.-M. Lagrange, 187–207
- Youdin & Goodman (2005) Youdin, A. N., & Goodman, J. 2005, ApJ, 620, 459
- Zagorovsky et al. (2010) Zagorovsky, K., Brandeker, A., & Wu, Y. 2010, ApJ, 720, 923
- Zhu et al. (2014) Zhu, Z., Stone, J. M., Rafikov, R. R., & Bai, X.-n. 2014, ApJ, 785, 122