B-mode Targets
Abstract
The CMB-S4 Science Book Abazajian et al. (2016), Simons Observatory report Aguirre et al. (2019), Astro2020 Science White Paper on gravitational waves Shandera et al. (2019), and PICO report Hanany et al. (2019) contain an extensive discussion of many ongoing and planned efforts in the search for gravitational waves produced by inflation. Here we give a short executive summary of the results obtained in our papers Kallosh et al. (2019); Kallosh and Linde (2019a, b), which specify the simplest available inflationary models providing physically motivated targets for these searches. Our conclusions are specific for the range, where we present the B-mode benchmarks of the U-duality symmetric class of -attractors, and for , where we present B-mode targets, for which the future precision measurements of will be decisive. We show that a combination of the simplest -attractors and KKLTI models of D-brane inflation covers most of the area favored by Planck 2018.
I Introduction
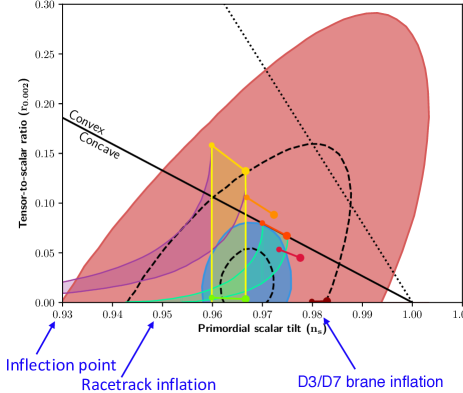
The goals of future CMB missions can be illustrated by Fig. 2.2 in the PICO report Hanany et al. (2019), reproduced here:
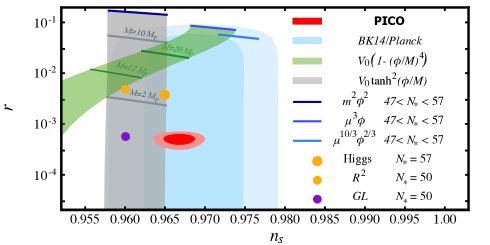
PICO plans to detect primordial gravitational waves if . It is equally important that the constraints on can be significantly improved, to achieve Aguirre et al. (2019); Hanany et al. (2019).
In this paper we will discuss the simplest inflationary models which describe all presently available data, and identify some ‘future-safe’ models, which have a fighting chance to describe all data on spectral index and tensor to scalar ratio to be obtained in the next one or two decades. There are some very interesting targets in the range , such as the string theory related axion monodromy models Silverstein and Westphal (2008); McAllister et al. (2010, 2014). If we discover inflationary B-modes in this range, it will be fantastic, but what if we go through the range without finding the signal? Do we have any other legitimate targets for the future missions discussed in Abazajian et al. (2016); Shandera et al. (2019); Hanany et al. (2019)?
The results of our investigation of these issues is contained in Linde (2017) and in our papers Kallosh et al. (2019); Kallosh and Linde (2019a, b). Our analysis was focused on the models favored by the recent Planck 2018 results, shown in Fig. 8 and Table 5 of Akrami et al. (2018), and by BICEP2/Keck 2014 results shown by Fig. 5 in Ade et al. (2018). These models include -attractors Kallosh et al. (2013); Carrasco et al. (2015); Kallosh et al. (2017a), providing a significant generalization of the Starobinsky model Starobinsky (1980) and the Higgs inflation model Salopek et al. (1989); Bezrukov and Shaposhnikov (2008). We also discuss hilltop inflation Linde (1982); Boubekeur and Lyth (2005), and D-brane inflation Dvali et al. (2001); Burgess et al. (2001); Garcia-Bellido et al. (2002); Kachru et al. (2003); Martin et al. (2014). Predictions of the simplest -attractor models are shown by the vertical yellow stripe in Fig. 8 of Akrami et al. (2018) and by the grey band in Fig. 2.2 from PICO, which is our Fig. 1. Predictions of the simplest hilltop models with the potential are shown by the green area in these figures.
Since our papers Kallosh et al. (2019); Kallosh and Linde (2019a, b) are large and rather technical, targeted for the hep-th audience, we decided to give here a short executive summary of our main conclusions.
We have found in Kallosh and Linde (2019a) that for , which is the only regime where the hilltop models could be data-compatible, their predictions are directly related to the unboundedness of their potential from below, which leads to collapse of the universe soon after the end of inflation. Improved versions of these models typically have very different model-dependent predictions, unrelated to inflation at the hilltop, with significantly higher values of . Therefore we removed the green area corresponding to the hilltop model from Figs. 2, 3 and 4 illustrating our results to be presented below.
The simplest D-brane inflation models with are also unbounded from below; they are called BI models in the ‘Encyclopædia Inflationaris’ Martin et al. (2014). We eliminated them from our figures since they are not physically consistent. But at small , their predictions nearly coincide with the ones of the improved D-brane inflation models , which were called KKLTI in Martin et al. (2014). We will describe these models below.
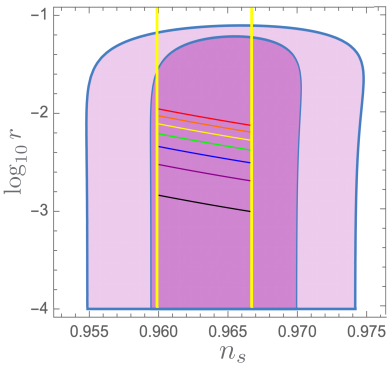
The predictions of the simplest -attractors and KKLTI models are well inside the region for and in the Planck 2018 data. Following the way of evaluation of inflationary models used in the Planck 2018 data release, in Figs. 2 and 3 we make a comparison using the CMB data only. The dark (light) pink areas in the these figures correspond to and favored by CMB-related data at the 1 (2) level. Inclusion of the BAO leads to very similar results, see Fig. 4 and Kallosh et al. (2019); Kallosh and Linde (2019a, b).
II U-duality benchmarks for
In Fig. 2 we present several discrete benchmarks for -attractor models, in units . The and predictions of these models in the small limit depend only on their geometric kinetic terms. The benchmark models have kinetic terms originating from maximal supersymmetry (M-theory, string theory, maximal supergravity), spontaneously broken to the minimal supergravity. The 7-disk model Ferrara and Kallosh (2016); Kallosh et al. (2017b) allows 7 discrete values . The characteristic scale of the inflationary potential for -attractors is Linde (2017). The last maximal supersymmetry benchmark has , which at corresponds to .
At we would probe string theory fibre inflation Cicoli et al. (2009); Kallosh et al. (2017c), at we would probe the Starobinsky model Starobinsky (1980), the Higgs inflationary model Salopek et al. (1989); Bezrukov and Shaposhnikov (2008), as well as the conformal inflation model Kallosh and Linde (2013). Finally, at we would probe the case of the maximal superconformal symmetry, as explained in Kallosh and Linde (2019b).
There is yet another target, at , , which corresponds to the GL model Goncharov and Linde (1984); Linde (2015) shown by a purple dot in the PICO Fig. 1. This is a supergravity inflationary model involving just a single superfield, providing the first example of chaotic inflation with a plateau potential. There are some mathematical reasons for the specific value of in this model, but we believe that the targets at are better motivated from the point of view of fundamental physics.
Independently of these specific targets, there is a certain aspect of all -attractors that deserves particular attention. The value of , which can be found by measurement of , is directly related to the curvature of the moduli space Ferrara et al. (2013); Kallosh and Linde (2015): , where is the characteristic scale of inflation for -attractors Abazajian et al. (2016); Linde (2017). Thus, investigation of the gravitational waves produced during inflation may go beyond investigation of our space-time: It may help us to study geometry of the internal space of scalar fields responsible for inflation.
III Attractor stripes at
KKLTI potentials described in Kachru et al. (2003); Martin et al. (2014) are . They have a minimum at and a plateau at large . Recently these models were re-examined in Kallosh et al. (2019); Kallosh and Linde (2019a). The main results are shown in Figs. 3 and 4.
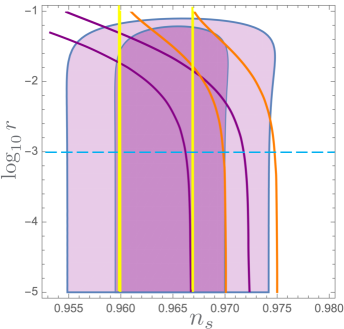
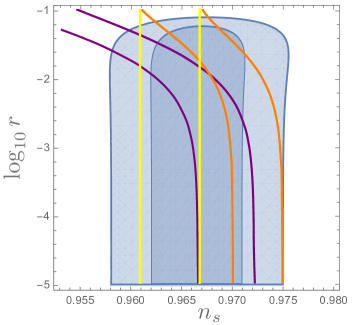
These figures show that a combination of the simplest -attractor model with the two simplest KKLTI models almost completely covers the area in the () space favored by Planck 2018. At , -attractors predict , KKLTI models with predict , and KKLTI models with predict . This addresses the concerns expressed in Shandera et al. (2019) that it could be difficult to find inflationary models with and with . As one can see, such models are already known. They are prominently represented in the Planck 2015 and Planck 2018 data releases Akrami et al. (2018); Ade et al. (2016).
We are unaware of any important discrete targets for , with the possible exception of the GL model. In some string theory models one may have as small as Kachru et al. (2003); Martin et al. (2014). However, the expected significant improvement of the constraints on by 2 or 3 times relative to Planck 2018 Aguirre et al. (2019); Hanany et al. (2019) would allow to discriminate between different models shown in Fig. 3. At present, the yellow, the purple and the orange attractor stripes fit the data, but a more precise knowledge of may help us to distinguish these models, and learn more about the post-inflationary evolution in these models, including reheating, which affects the required values of N, and, consequently, . Therefore at , where the predictions of -attractors and KKLTI models do not depend on , we have interesting targets for .
We have had a very similar experience during the last decade. The improvement of the precision of determination of during the 8 years between the release of WMAP data in 2010 Komatsu et al. (2011) to Planck 2018 Akrami et al. (2018) shown in Fig. 5 from Akrami et al. (2019) was the main reason for elimination of many inflationary models predicting extremely low .
IV Conclusions
This paper gives a brief summary of the results obtained in our papers Kallosh et al. (2019); Kallosh and Linde (2019a, b), which may have some implications for planning of the future B-mode searches.
In particular, we found that the predictions of the simplest hilltop inflation models shown by the green area in Fig. 1 do not constitute legitimate targets for B-mode searches, because these predictions are directly related to the physical inconsistency of these models Kallosh and Linde (2019a).
There is a popular but not universally applicable way to parametrize inflationary models by the assumption that they should satisfy the relation , where is a phenomenological parameter. This parametrization works well for -attractors, but, as one can infer from Figs. 3, 4, it applies to the KKLTI models only for , at the lower boundary of the range of to be studied by CMB-S4.
On the other hand, we have found that -attractors, in combination with the KKLTI models, almost completely cover the dark region in the space favored by Planck 2018, all the way down to , as shown in Figs. 3, 4. Therefore, in addition to (and independently of) being the candidates for the role of a consistent inflationary theory compatible with the available observational data, these models can provide a simple physically motivated parametrization of the future CMB results for the range of and favored by Planck 2018.
Investigation of these models provides a list of specific B-mode targets for the future B-mode searches. Seven different targets in the range are shown in Fig. 2, corresponding to discrete benchmarks representing a set of U-duality invariant -attractor inflationary models. An important aspect of the search of the gravitational waves in this context is that the knowledge of allows to find the curvature of the internal space of scalar fields responsible for inflation.
We are grateful to Z. Ahmed, F. Finelli, R. Flauger, M. Hazumi, S. Kachru, L. Knox, Chao-Lin Kuo, J. Martin, L. Page, D. Roest, L. Senatore, E. Silverstein, V. Venin, R. Wechsler and Y. Yamada for the stimulating discussions. This work is supported by SITP and by the US National Science Foundation grant PHY-1720397 and by the Simons Foundation Origins of the Universe program.
References
- Abazajian et al. (2016) K. N. Abazajian et al. (CMB-S4), (2016), arXiv:1610.02743 [astro-ph.CO] .
- Aguirre et al. (2019) J. Aguirre et al. (Simons Observatory), JCAP 1902, 056 (2019), arXiv:1808.07445 [astro-ph.CO] .
- Shandera et al. (2019) S. Shandera et al., (2019), arXiv:1903.04700 [astro-ph.CO] .
- Hanany et al. (2019) S. Hanany et al. (NASA PICO), (2019), arXiv:1902.10541 [astro-ph.IM] .
- Kallosh et al. (2019) R. Kallosh, A. Linde, and Y. Yamada, JHEP 01, 008 (2019), arXiv:1811.01023 [hep-th] .
- Kallosh and Linde (2019a) R. Kallosh and A. Linde, (2019a), arXiv:1906.02156 [hep-th] .
- Kallosh and Linde (2019b) R. Kallosh and A. Linde, “Update on b-mode targets,” (2019b), in preparation.
- Silverstein and Westphal (2008) E. Silverstein and A. Westphal, Phys. Rev. D78, 106003 (2008), arXiv:0803.3085 [hep-th] .
- McAllister et al. (2010) L. McAllister, E. Silverstein, and A. Westphal, Phys. Rev. D82, 046003 (2010), arXiv:0808.0706 [hep-th] .
- McAllister et al. (2014) L. McAllister, E. Silverstein, A. Westphal, and T. Wrase, JHEP 09, 123 (2014), arXiv:1405.3652 [hep-th] .
- Linde (2017) A. Linde, JCAP 1702, 006 (2017), arXiv:1612.00020 [astro-ph.CO] .
- Akrami et al. (2018) Y. Akrami et al. (Planck), (2018), arXiv:1807.06211 [astro-ph.CO] .
- Ade et al. (2018) P. A. R. Ade et al. (BICEP2, Keck Array), Phys. Rev. Lett. 121, 221301 (2018), arXiv:1810.05216 [astro-ph.CO] .
- Kallosh et al. (2013) R. Kallosh, A. Linde, and D. Roest, JHEP 11, 198 (2013), arXiv:1311.0472 [hep-th] .
- Carrasco et al. (2015) J. J. M. Carrasco, R. Kallosh, A. Linde, and D. Roest, Phys. Rev. D92, 041301 (2015), arXiv:1504.05557 [hep-th] .
- Kallosh et al. (2017a) R. Kallosh, A. Linde, D. Roest, and Y. Yamada, JHEP 07, 057 (2017a), arXiv:1705.09247 [hep-th] .
- Starobinsky (1980) A. A. Starobinsky, Phys. Lett. 91B, 99 (1980).
- Salopek et al. (1989) D. S. Salopek, J. R. Bond, and J. M. Bardeen, Phys. Rev. D40, 1753 (1989).
- Bezrukov and Shaposhnikov (2008) F. L. Bezrukov and M. Shaposhnikov, Phys. Lett. B659, 703 (2008), arXiv:0710.3755 [hep-th] .
- Linde (1982) A. D. Linde, Second Seminar on Quantum Gravity Moscow, USSR, October 13-15, 1981, Phys. Lett. B108, 389 (1982).
- Boubekeur and Lyth (2005) L. Boubekeur and D. H. Lyth, JCAP 0507, 010 (2005), arXiv:hep-ph/0502047 [hep-ph] .
- Dvali et al. (2001) G. R. Dvali, Q. Shafi, and S. Solganik, in 4th European Meeting From the Planck Scale to the Electroweak Scale (Planck 2001) La Londe les Maures, Toulon, France, May 11-16, 2001 (2001) arXiv:hep-th/0105203 [hep-th] .
- Burgess et al. (2001) C. P. Burgess, M. Majumdar, D. Nolte, F. Quevedo, G. Rajesh, and R.-J. Zhang, JHEP 07, 047 (2001), arXiv:hep-th/0105204 [hep-th] .
- Garcia-Bellido et al. (2002) J. Garcia-Bellido, R. Rabadan, and F. Zamora, JHEP 01, 036 (2002), arXiv:hep-th/0112147 [hep-th] .
- Kachru et al. (2003) S. Kachru, R. Kallosh, A. D. Linde, J. M. Maldacena, L. P. McAllister, and S. P. Trivedi, JCAP 0310, 013 (2003), arXiv:hep-th/0308055 [hep-th] .
- Martin et al. (2014) J. Martin, C. Ringeval, and V. Vennin, Phys. Dark Univ. 5-6, 75 (2014), arXiv:1303.3787 [astro-ph.CO] .
- Ferrara and Kallosh (2016) S. Ferrara and R. Kallosh, (2016), arXiv:1610.04163 [hep-th] .
- Kallosh et al. (2017b) R. Kallosh, A. Linde, T. Wrase, and Y. Yamada, JHEP 04, 144 (2017b), arXiv:1704.04829 [hep-th] .
- Cicoli et al. (2009) M. Cicoli, C. P. Burgess, and F. Quevedo, JCAP 0903, 013 (2009), arXiv:0808.0691 [hep-th] .
- Kallosh et al. (2017c) R. Kallosh, A. Linde, D. Roest, A. Westphal, and Y. Yamada, (2017c), arXiv:1707.05830 [hep-th] .
- Kallosh and Linde (2013) R. Kallosh and A. Linde, JCAP 1307, 002 (2013), arXiv:1306.5220 [hep-th] .
- Goncharov and Linde (1984) A. S. Goncharov and A. D. Linde, Sov. Phys. JETP 59, 930 (1984), [Zh. Eksp. Teor. Fiz.86,1594(1984)].
- Linde (2015) A. Linde, JCAP 1502, 030 (2015), arXiv:1412.7111 [hep-th] .
- Ferrara et al. (2013) S. Ferrara, R. Kallosh, A. Linde, and M. Porrati, Phys. Rev. D88, 085038 (2013), arXiv:1307.7696 [hep-th] .
- Kallosh and Linde (2015) R. Kallosh and A. Linde, Comptes Rendus Physique 16, 914 (2015), arXiv:1503.06785 [hep-th] .
- Ade et al. (2016) P. A. R. Ade et al. (Planck), Astron. Astrophys. 594, A20 (2016), arXiv:1502.02114 [astro-ph.CO] .
- Komatsu et al. (2011) E. Komatsu et al. (WMAP), Astrophys. J. Suppl. 192, 18 (2011), arXiv:1001.4538 [astro-ph.CO] .
- Akrami et al. (2019) Y. Akrami, R. Kallosh, A. Linde, and V. Vardanyan, Fortsch. Phys. 67, 1800075 (2019), arXiv:1808.09440 [hep-th] .