Spiral instabilities: Mechanism for recurrence
Abstract
We argue that self-excited instabilities are the cause of spiral patterns in simulations of unperturbed stellar discs. In previous papers, we have found that spiral patterns were caused by a few concurrent waves, which we claimed were modes. The superposition of a few steadily rotating waves inevitably causes the appearance of the disc to change continuously, and creates the kind of shearing spiral patterns that have been widely reported. Although we have found that individual modes last for relatively few rotations, spiral activity persists because fresh instabilities appear, which we suspected were excited by the changes to the disc caused by previous disturbances. Here we confirm our suspicion by demonstrating that scattering at either of the Lindblad resonances seeds a new groove-type instability. With this logical gap closed, our understanding of the behaviour in the simulations is almost complete. We believe that our robust mechanism is a major cause of spiral patterns in the old stellar discs of galaxies, including the Milky Way where we have previously reported evidence for resonance scattering in the recently released Gaia data.
keywords:
galaxies: spiral — galaxies: evolution — galaxies: structure — galaxies: kinematics and dynamics — instabilities1 Introduction
Theorists have long dreamed that the spiral patterns gracing most disc galaxies, and simulations thereof, reflect the normal modes of the disc. That is, they are mildly non-linear manifestations of self-excited, linear instabilities of the stellar disc that are uniformly rotating and exponentially growing density waves. Long ago, this grand program was set back by two early discoveries from normal mode analyses of apparently reasonable models of featureless discs: models where the rotation curve rose gently from the centre were dominated by bar-forming instabilities (Hohl, 1971; Kalnajs, 1978), while models having a dense (bulge-like) centre had no modes whatsoever (Toomre, 1981).
Here we begin by reviewing why we think spiral modes are in fact the most promising mechansim, despite this early setback, and add to our case by demonstrating how spiral modes recur.
1.1 Modes in galactic discs
A normal mode of any system is a self-sustaining, sinusoidal disturbance of fixed frequency and constant shape, save for a possible uniform rotation; the frequency would be complex if the mode were to grow or decay. In the case of galaxy discs, the perturbed surface density of a mode is the real part of
| (1) |
where is the angular periodicity, , is the angular rate of rotation, usually called the pattern speed, and is the growth rate. The complex function , which is independent of time, describes the radial variation of amplitude and phase of the mode.
Stability analysis of a system supposes small amplitude perturbations about the equilibrium state and is linearized when any terms that involve products of small amplitude terms are discarded – see Kalnajs (1971) for a careful formulation. The equilibrium is linearly unstable if any of the resulting normal modes have a positive growth rate, since its amplitude will exponentiate out of the noise until the neglected 2nd and higher order terms become no longer negligible.111The word instability is sometimes used to imply a purely imaginary frequency, and a mode with a complex frequency is then described as an overstability. Here we adopt the more usual convention of simply describing all frequencies with as instabilities.
Normal modes can be standing wave oscillations of the system that exist between two reflecting barriers, as in organ pipes and guitar strings, which are generally described as cavity modes in galaxy discs. The prime example in galaxies is the bar-forming mode, for which reflections take place at the centre and at corotation (Toomre, 1981; Binney & Tremaine, 2008). An instability of this type is possible only if the disturbance has no inner Lindblad resonance (hereafter ILR), since linear theory (Mark, 1974) predicts that any disturbance that encounters an ILR will be absorbed, and therefore damped. An ILR must be present for any reasonable pattern speed when the centre is dense, and therefore no small-amplitude cavity mode is possible in a featureless disc of this kind. But has a maximum value in mass models having quasi-harmonic cores, and bar-forming instabilities avoid resonance damping by having pattern speeds that exceed this maximum. Here is the angular frequency of circular motion at radius in the disc mid-plane, and is the usual frequency of small-amplitude radial oscillations about a circular orbit (Binney & Tremaine, 2008). The dominant mode of several bar-unstable models has been identified in simulations, with excellent quantitative agreement of both the frequency and mode shape (Sellwood & Athanassoula, 1986; Earn & Sellwood, 1995). Other types of cavity mode have been proposed by Mark (1977) and by Sellwood & Carlberg (2014) and are described below.
Galactic discs can also support another class of mode. The best known examples are edge modes (Toomre, 1981; Papaloizou & Lin, 1989) and groove modes (Sellwood & Lin, 1989; Sellwood & Kahn, 1991). They are not standing waves, however, and maintain a fixed shape and frequency by other means. In the case of the edge mode, a small non-axisymmetric distortion of the disc where the density decreases steeply, moves high density material out to places where the equilibrium density was lower, and conversely at other azimuthal phases. On their own, such co-orbiting distortions would be neutrally stable and therefore of no interest. But as Julian & Toomre (1966) taught, a cool surrounding disc responds vigorously to a co-orbiting mass excess, creating a trailing wake that extends radially far into the shear flow on either side of the perturbing mass; this behaviour is a consequence of swing amplification (Goldreich & Lynden-Bell, 1965; Julian & Toomre, 1966; Toomre, 1981; Binney, 2019). The distorted edge therefore excites a strong supporting response from the interior disc that is not balanced by the exterior response because the equilibrium density drops rapidly with radius at the edge. The attraction of the interior wake on the original density excess increases its angular momentum, causing it to grow exponentially as it rotates. The necessary conditions for instability were summarized by Toomre (1989).
A groove in a disc is effectively two closely spaced edges, which however give rise to a single mode because the distortions on each edge are gravitationally coupled. Note that it is a steep gradient in the angular momentum density that matters for both edge and groove modes; epicyclic blurring can mask the steepness in the actual surface density profile. As for edge modes, it is the supporting response of the surrounding disc that causes the groove mode to have a substantial radial extent and to grow rapidly (Sellwood & Kahn, 1991), and these authors were able to obtain good quantitative agreement between their analytic predictions and simulations.
Note that swing amplication, famously illustrated in the dust-to-ashes figure of Toomre (1981), is not a mode both because the shape changes with time and the amplitude variation is not a simple exponential. Also the wake response to an imposed co-orbiting mass clump (Julian & Toomre, 1966) is not a mode because, to first order, it would disperse if the clump were removed, and it therefore is not self-sustaining. Both are simply responses of the disc to externally imposed disturbances. However, they are both very helpful concepts when trying to understand the mechanisms of self-sustaining modes.
1.2 Noise, resonances, and heating
The collisionless fluid of stars invoked in these analytical treatments is an idealization that assumes the stars to be infinitely finely divided so that phase space is smooth. The numbers of stars in galaxy discs is large enough that this assumption holds quite well (see Sellwood, 2014a, for caveats), but galaxies contain mass clumps such as star clusters and giant molecular clouds, and the number of particles employed in a simulation is generally several orders of magnitude fewer than the number of stars. Thus shot noise in both real galaxies and in simulations gives rise to significant inhomogeneities in the disc.
The spectrum of shot noise in a shearing distribution of randomly distributed gravitating masses inevitably contains leading wave components that will be strongly amplified as the shear carries them from leading to trailing. This behaviour has two important consequences. The first consequence of swing-amplified shot noise is that each heavy particle develops a wake (Julian & Toomre, 1966; Binney, 2019). The two point correlation function of the particles becomes greater along the direction of the wake and lower in other directions, and the particle distribution is said to be polarized. Since the distribution of particles is no longer perfectly random, the amplitude of all components of the noise spectrum is enhanced, causing subsequent noise-induced fluctuations to be stronger, although linear theory predicts this cycle should asymptote in a few epicycle periods to a mean steady excess over the level expected from uncorrelated noise (Julian & Toomre, 1966; Toomre & Kalnajs, 1991).
Second, the collective amplified response of any one component of the noise orbiting at the angular frequency , creates a coherent trailing wave in the disc that propagates away from corotation (Toomre, 1969, 1981) until it reaches a Lindblad resonance where it is absorbed (Mark, 1974). For near circular orbits the Lindblad resonances occur where the Doppler shifted frequency at which the stars encounter the wave is equal to the epicyclic frequency of their small radial excursions, i.e., the radii at which
| (2) |
with at Lindblad resonances. The negative sign is for the ILR, where stars overtake the wave, and the positive is for the OLR where the wave overtakes the stars, at the local epicycle frequency in both cases. Wave-particle interactions at the resonance cause localized irreversible changes to the energy and angular momenta of stars. Jacobi’s invariant (Binney & Tremaine, 2008) implies that changes are related as . On average and to second order, particles lose at the ILR and gain at the OLR (Lynden-Bell & Kalnajs, 1972; Carlberg & Sellwood, 1985), and this outward transfer of allows the wave to extract free energy from the galactic potential enabling the scattered particles to acquire additional random energy at both resonances. The resulting depopulation of stars on near circular orbits over the narrow region of each resonance creates a “scratch” in the disc that may alter its stability properties.
It is important to realize that linear theory neglects this second order effect by assumption, i.e. it does not allow for changes to the equilibrium state. In fact, Sellwood (2012) found that the amplitudes of successive episodes of uncorrelated swing amplified noise rose slowly, but continuously, because the consequent scratches to the disc from each episode caused partial reflections of subsequent disturbances that allowed further amplification (Sellwood & Carlberg, 2014; Fouvry & Pichon, 2015). This process continued until the the partial reflections became strong enough that the disc was able to support an unstable mode (Sellwood, 2012; De Rijcke et al., 2019), and coherent growth to large amplitude began. We discuss this behaviour further in §1.4.
Here we have used the word “scratch” to describe quite mild changes to the distribution function (hereafter DF) that can cause partial reflections of a wave propagating radially within the disc. But scattering at a Lindblad resonance could also carve a similar feature that seeds a groove mode instead, and we will show below that this appears to be the more usual behaviour.
Note that the Lindblad resonances are closer to corotation, where ( in eq. 2), when is large than for waves of lower , implying that more free energy can be extracted from the potential, causing more rapid heating when the disc supports larger-scale waves. The value of that is amplified most strongly (Julian & Toomre, 1966; Toomre, 1981) is
| (3) |
with in a flat rotation curve. Thus the preferred varies inversely with the disc surface density (Sellwood & Carlberg, 1984; Athanassoula et al., 1987). Whatever the origin of disturbances, a sub-maximal disc will prefer higher , and therefore heat more slowly than would heavier discs.
Since spiral activity heats collisionless particles, or stars, an uncooled disc must become less able to support collective disturbances over time, as is well known. Sellwood & Carlberg (1984) established that dynamical cooling by gas and star formation is needed to counter secular heating and to maintain spiral activity, a result that has been confirmed in many more recent simulations (e.g. Roškar et al., 2008; Agertz et al., 2011; Aumer et al., 2016). It nicely accounts for the observation (e.g. Oort, 1962) that almost all spiral patterns are seen in galaxies that contain gas and are forming stars.
1.3 The spiral challenge
As already noted, a galaxy model having a dense centre and no sharp features, such as an edge or a groove, should not support any normal modes at all. Since spirals are ubiquitous in disc galaxies containing a modest gas fraction, and also develop spontaneously in simulations of isolated discs, some mechanism is needed to excite them. Currently, there are at least four proposed mechanisms:
-
i
Following Mark (1977), Bertin & Lin (1996) suggest that spirals result from a cavity type mode in a low-mass disc that is dynamically cool over most of the disc, but which also possess an inner “ barrier” to shield the ILR. These authors imagine that most galaxies support a single, long-lived, mildly-unstable mode that persists for many tens of galactic rotations and becomes “quasi-steady” due to dissipative shocks in the gas, but allow that superposition of a second mode may be needed in some cases. As given by eq. (3), strong swing-amplification for sets a preference for multi-arm instabilities over 2-arm modes in low mass discs. By considering only bi-symmetric disturbances in low-mass discs, Bertin et al. (1989) exploited the mild amplification when in order to obtain slowly-growing spiral modes in their global stability analysis of many galaxy models.
Simulations by Sellwood (2011) of one of the cases presented by Bertin et al. (1989) confirmed that a single, slowly-growing mode was present when disturbance forces were restricted to . Not surprisingly, however, he also found much more vigorous instabilities appeared when higher sectoral harmonics contributed to disturbance forces, and the contrived basic state of the disc that was designed to support the mode was rapidly changed by these more vigorous instabilities. This evidence alone should have ruled out the theory, although Shu (2016) ignored it as he continued to advocate for their picture.
-
ii
Toomre (1990) and Toomre & Kalnajs (1991) abandoned the idea of spirals as normal modes, and advocated instead that a collection of massive clumps in the disc, each of which becomes dressed with its own wake, would create a “kaleidoscope” of shearing spiral patterns. Their simulations of this process were all confined to a single shearing patch with a modest number of particles. D’Onghia et al. (2013) conducted global simulations of a low-mass disc, embedded in a rigid halo, employing star particles to which they added a sprinkling of heavy particles that induced evolving multi-arm spiral patterns in the stars. In a separate experiment they also tried a single perturber of mass M⊙, which they removed again after it had completed one orbit; the simulation continued to manifest spiral activity in response to the non-axisymmetric density distribution created by the original imposed mass, which they described as non-linear behaviour.
These authors suggest that “ragged” spiral activity in galaxies results from such responses to co-orbiting giant molecular clouds, massive star clusters, etc., and to the lingering disc responses should any disperse. Although we do not doubt their numerical results, we remain unconvinced of their importance for spiral activity in galaxies. First, the M⊙ particle that D’Onghia et al. (2013) employed produced only a modest, and not very extensive wake in their low-mass disc. Spirals in real galaxies generally have greater amplitude and radial extent than this, suggesting that yet more massive clumps would be needed. Second, a collection of randomly placed heavy particles does not seem likely to produce a net response that is predominantly 2- or 3-armed, as are observed in the overwhelming majority of galaxies (Davis et al., 2012; Hart et al., 2016; Yu et al., 2018). Third, clumps massive and numerous enough that their associated wakes produce large-amplitude and radially-extensive spiral patterns would scatter disc stars, and heat the disc rapidly so that the responses would fade quickly unless the disc were cooled aggressively, and the necessary cooling (Toomre, 1990) seems rather extreme. A fourth, and overriding, reason is that the idea is unnecessary, because discs readily support unstable spiral modes, as we discuss next.
-
iii
Sellwood & Carlberg (2014) demonstrated that spiral activity in simulations resulted from superposition of a number of coherent, uniformly rotating waves. They found that each wave grew and decayed, but was detectable over a period of some ten rotations at its corotation radius, and they presented substantial evidence that the waves were in fact modes. The vigorous modes in their new picture differ substantially from those invoked by Bertin & Lin (1996) because they work best where swing-amplication is strongest, do not last for nearly as long, and fresh instabilities develop to maintain spiral activity.
Note that the spiral appearance changes still more rapidly than do the modes in their simulations. This is because the superposition of several modes, each having a different pattern speed and perhaps also angular periodicity, as well as time varying amplitude, causes the pattern of visible spiral arms to change radically in less than one orbit.222An animation showing the time evolution of the net density when two notional patterns are superposed is at
http://www.physics.rutgers.edu/sellwood/spirals.htmlSellwood & Carlberg (2014) also postulated a new cavity mode that relied upon partial reflection of travelling waves off an impedance variation created by a previous perturbation within the disc. They suggested that ILR scattering by a past wave would have “scratched” an originally smooth distribution function (see §1.2) to create a deficiency of stars on near circular orbits at some radius. A subsequent ingoing trailing wave encountering the scratch before reaching its own ILR, would find that the scratch in the otherwise smooth disc represents an abrupt change of impedance, and is therefore partially reflected into a outgoing leading wave. A second reflection of the wave by swing amplification at corotation creates a cavity that will support standing waves having frequencies allowed by the usual phase closure condition. They dubbed this new type of cavity mode a “mirror mode.” As for the bar mode that also includes swing amplification from leading to trailing, a reasonable reflected fraction at the partial mirror will cause a mirror mode to grow rapidly, and the instability must run its course within a modest number of pattern rotations. Nevertheless, spiral activity can be maintained because other modes develop in rapid succession. We present evidence in §1.4 below that the first real instability in the tests of the Mestel discs reported in Sellwood (2012) was almost certainly of this type. Some mirror modes may also have been present in the simulations of Sellwood & Carlberg (2014), but we here (§3) argue for a more probable recurrence cycle.
-
iv
Grand et al. (2012a, b), Baba et al. (2013), Roca-Fàbrega et al. (2013), and others present simulations of mostly sub-maximal discs and report that spiral patterns are shearing structures, in which the density maxima wind as would material arms, or nearly so. Grand et al. (2012a, b), Kawata et al. (2014), and other authors have described spiral arm streaming motions that are consistent with expectations set out by Kalnajs (1973); however, such a flow pattern is required for any self-consistent spiral, irrespective of its nature or origin. Baba et al. (2013) and Michikoshi & Kokubo (2018) find that spirals in their simulations behave as predicted by swing amplification theory (Toomre, 1981). Grand et al. (2013) reported a correlation between the mean pitch angle of spiral arms in their simulations and the shear rate in the disc, which they also suggested was consistent with swing amplification theory. Baba (2015) reported similar shearing and evolving spirals in the outer discs of barred simulations. Kumamoto & Noguchi (2016) excited regular spiral patterns that were particle wakes in the disc forced by a few heavy particles equally spaced around rings, finding additional swing amplification as the wakes lined up. The earlier part of this body of work was summarized in the review by Dobbs & Baba (2014), and all these authors propose that shearing patterns are the fundamental character of spiral arms. We discuss these findings in §1.4.
The Gaia satellite has revealed the local phase space structure of the Milky Way in unprecedented detail (Gaia collaboration: Katz et al., 2018). Sellwood et al. (2019) used these data to try to discriminate among the different theories just described. They calculated the changes to a smooth distribution function that would be caused by a single episode of each of the last three spiral models and compared the predictions with the Gaia data. They concluded that the features in action space seemed more consistent with the transient spiral mode model (Sellwood & Carlberg, 2014) than with either of the other two. Note that Monari et al. (2018) found evidence in the same data for scattering by the Milky Way bar, but some features remained that they could not attribute to the bar. However, Hunt et al. (2018) concluded that other features in the same data were consistent with shearing spiral arms.
Sellwood et al. (2019) also argued that the long-lived spiral mode model advocated by Bertin & Lin (1996) would not cause any pronounced changes, because the ILR, where the largest changes generally occur, is shielded by the barrier, no net change is expected at corotation, and the OLR would probably lie too far outside the solar circle to affect the local distribution. Thus if their delicate mechanism for spiral generation were indeed to operate in the Milky Way, it would contribute little to the observd extensive sub-structure in phase space and would implausibly have to survive in the mild disequilibrium state of the disc revealed in the Gaia data.
1.4 Modes or shearing patterns?
The shearing spiral behaviour that is apparent in almost all simulations of cool, isolated discs possesses many aspects of swing-amplification and wakes, as the above cited papers have reported. We have also reported such behaviour: e.g., Fig. 3 of Sellwood & Carlberg (1984) indicated the time evolution of a single 3-arm spiral disturbance that apparently sheared and amplified to an open trailing pattern before decaying as it continued to wind and, in simulations of much improved numerical quality, Sellwood & Carlberg (2014, their Fig. 3) illustrated constantly changing patterns, which is qualitatively similar to the behaviour that all authors report.
However, we have also found (e.g. Sellwood, 1989, 2011; Sellwood & Carlberg, 2014, and later in this paper) that the constantly changing appearance of spiral patterns results from the superposition of a modest number of longer lived waves (see also Quillen et al., 2011). Even though a mode (eq. 1) has a fixed pattern speed at all radii and a constant shape function, , shearing patterns are the inevitable consequence of superposed modes. All that is required to produce the appearance of a shearing transient spiral (see footnote 2) from two or more superposed patterns of fixed shape is that the modes closer to the centre have higher pattern speed, which is always true.
The proposition that the shearing patterns are the fundamental behaviour is not a satisfactory explanation for the origin of the spirals, because it is unable to answer a key question: how can the spiral amplitudes in simulations be largely independent of the number of particles? No recent paper that argues for this interpretation addresses this issue, yet there is substantial evidence to support it: Sellwood (2011), Sellwood (2012), and Sellwood & Carlberg (2014) all reported similar final amplitudes in experiments in which the number of particles ranged over orders of magnitude. As is increased, the amplitude of shot noise fluctuations must decrease as , and some kind of growth mechanism is required to produce final amplitudes that are independent of . Swing-amplification and/or wakes do not lead to indefinite growth, and therefore cannot account for final amplitudes that are independent of , at least in linear theory. We would agree with an argument that non-linear scattering (§1.2) is important, but that plays into our case for unstable modes (Sellwood & Carlberg, 2014, and this paper).
It is likely that most models adopted in simulations are unstable, because they allow some feedback through the centre and/or possess outer edges sharp enough to excite normal modes. Mildly unstable modes will be seeded at low amplitude when is large and may not cause visible changes for several rotations. Both Sellwood (2011) and Sellwood & Carlberg (2014) present cases in which the first visible features took longer and longer to appear as the number of particles was increased.333Pronouncements of stability after a short period of evolution in large- models (e.g. D’Onghia et al., 2013) are unlikely to hold in longer integrations. Once the first instability has appeared, we find that activity takes off, as the particle distribution becomes more and more structured by the previous evolution; the new results presented in §3 below show in more detail how a recurrent cycle of modes can occur.
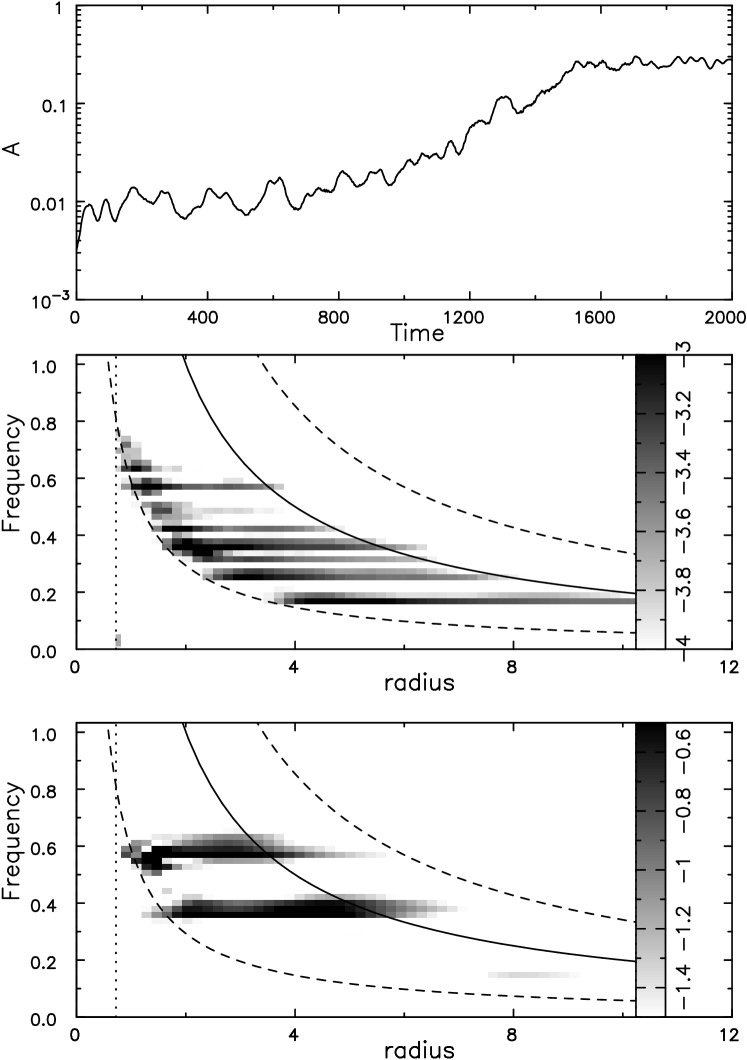
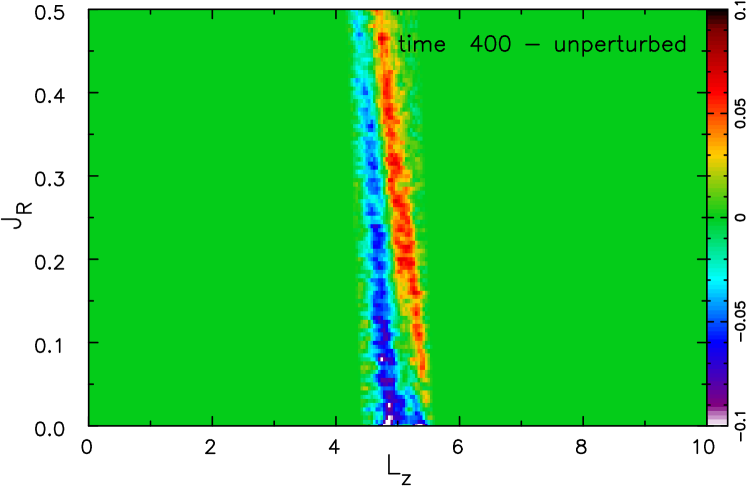
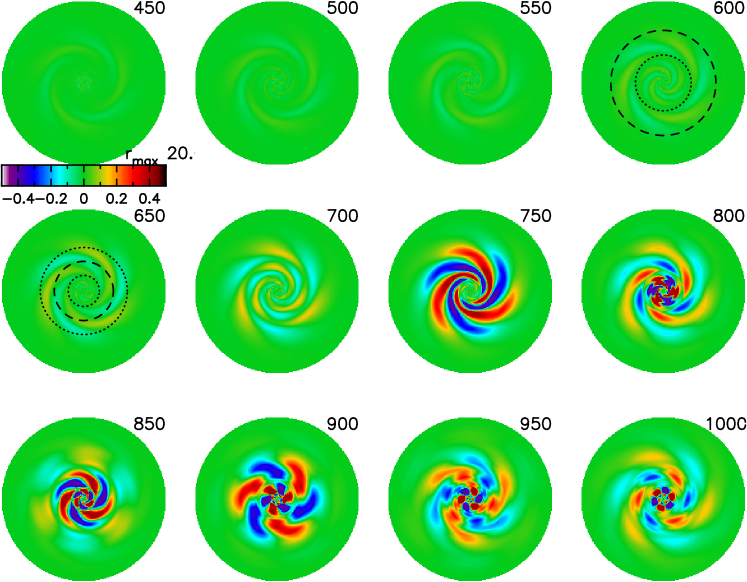
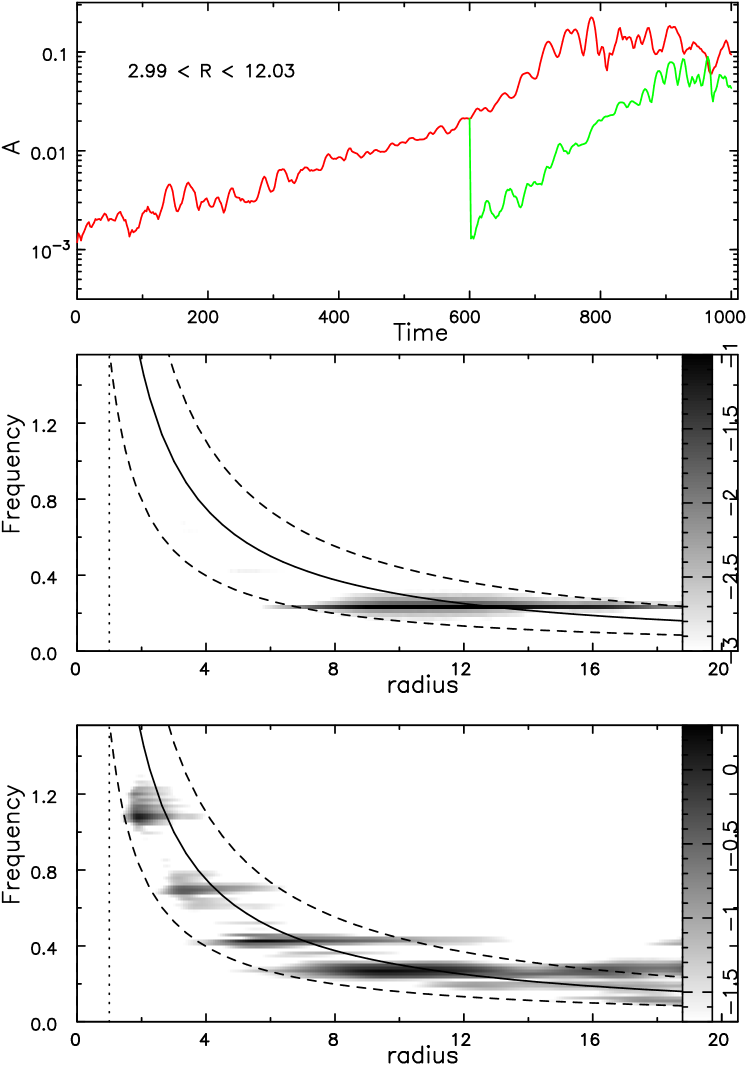
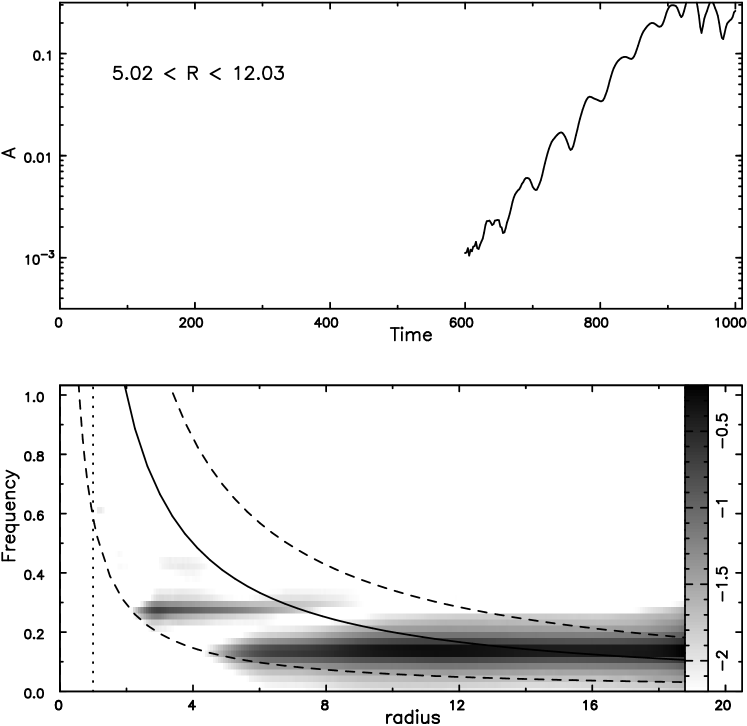
However, it is not neccessary to start from a disc that possesses one or more global instabilities. Toomre (1981) claimed that the half-mass Mestel disc is linearly stable, and this case was studied in simulations by Sellwood (2012). Fig. 1 illustrates the evolution of the simulation from his paper; details of the model and the numerical method are given in §2 below. The top panel reproduces the cyan curve from Fig. 2 of Sellwood (2012), which reported at each instant the greatest value of the ratio within the radius range , where is the amplitude of the bi-symmetric disturbance density. After an initial surge by a factor of a few as each particle created its own wake (§1.2), these features manifested slow secular growth. During this phase, the amplitudes of successive swing-amplified episodes increased slowly because each created mild scratches in the previously smooth disc that enabled partial reflections. The partial mirrors so created at first reflected small fractions of the incident waves, but as the disturbance amplitudes rose with each episode, the new scratches became more reflective. No coherent modes were detectable during this secular growth phase, and the power spectrum, such as shown in the middle panel, was characterized by multiple uncorrelated frequencies arising from whichever noise features were strongest at the time; the corotation radius of each event determines the frequency of the wave that propagates to its ILR where it is absorbed. These findings were consistent with Toomre’s linear theory prediction of global stability, since the secular growth was caused by the non-linear scattering terms that his analysis neglected. The largest amplitude disturbances reached an overdensity of % by , at which point the reflections became strong enough to cause true unstable modes in this originally stable disc. The amplitude in the top panel of Fig. 1 began to rise more rapidly and the power spectrum, in the bottom panel, that has a different amplitude scale shows much stronger and more coherent waves, which are modes.

Fouvry & Pichon (2015) and Fouvry et al. (2015) successfully developed a quasi-linear theoretical description of this behaviour. De Rijcke et al. (2019) conducted a global mode analysis of this model at , and estimated the frequency of the dominant instability to be in excellent agreement with Sellwood’s own estimate (his paper has factor 10 typo in the growth rate). Although both analyses were of the model denoted 50c, in which the particles coordinates had been scrambled at , the faster wave in the bottom panel of Fig. 1 confirms a mode of similar pattern speed when the evolution is uninterrupted. Fig. 2 shows the logarithmic spiral decomposition of the mode Sellwood (2012) fitted to the data from his model 50c. The leading/trailing bias reflects the trailing appearance of the mode, but the leading side has significant amplitude indicating that it was a mirror, or cavity, mode that operated by an inner reflection off the partial mirror to a leading wave, as Sellwood & Carlberg (2014) described.
Sridhar (2019) calculates the changes to the DF at the principal resonances caused by a transient disturbance, and attempts to show how they lead to further instabilities. However, the correspondence between the modes he calculates and the groove and mirror modes that we have reported is not immediately apparent from his analysis.
Thus we consider that every simulation of a cool, unperturbed disc must inevitably possess, or develop, unstable modes. The unbounded growth of instabilities, until second order terms become important, provides the only viable mechanism to give rise to large-amplitude spirals no matter how large a number of particles is employed. With a recurrence mechanism, such as that described here (§3), the simulations must support multiple unstable modes and their superposition naturally leads to the shearing transient activity that is almost universally reported. Note that externally perturbed models, such as those presented by D’Onghia et al. (2013) and Kumamoto & Noguchi (2016), may not manifest modes if the initial responses develop before any modes could grow to significant amplitude.
1.5 Objective of this paper
The complicated mechanism just described would be required to account for the origin of spirals only in models that do not possess any linear instabilities. The purpose of this paper is to show how a recurring cycle of instabilities can arise in models that do possess a single mild instability at the outset. We argue that such an instability cycle is the origin of spiral activity in all simulations, and hopefully in real galaxies also.
Sellwood & Carlberg (2014) also reported that coherent waves appear and decay at increasing radii and lower frequency over time. It is possible that the later instabilities are independent modes caused by uncorrelated noise fluctuations scratching the DF at larger radii. However, Sellwood & Carlberg (2014) preferred the idea that the decay of one mode created conditions to seed a new instability, although they did not provide a detailed mechanism for recurrence. Here we describe the recurrence mechanism in detail.
In fact, Sellwood & Lin (1989) presented a recurrence mechanism for self-gravitating spiral modes in low mass particle discs orbiting around a central mass. The mechanism they proposed was that scattering at the OLR created a groove in phase space that excited a new instability. We thought it unlikely that the same recurrence mechanism would work in heavy discs, for reasons that we give in §4, but we here demonstrate that this expectation was wrong.
2 Technique
Since the dynamical behaviour of fully self-consistent simulations can be very complicated, we find it fruitful to run simplified simulations that can capture the phenomena we wish to study without them being obscured by unrelated activity. Once understood, it will naturally be important to show that the behaviour persists under more general conditions.
Accordingly, we adopt the razor-thin Mestel disc used in the studies by Zang (1976) and Toomre (1981), which is characterized by a constant circular speed at all radii. Note that since and , increases indefinitely towards the centre except for , when it is negative at all radii. Thus an ILR will intervene to damp all disturbances having when , prohibiting possible cavity modes in a smooth disc, except for .
The axisymmetric surface density would self-consistently yield the appropriate central attraction for centrifugal balance. If the surface density is reduced to fraction (), with the removed mass added to a rigid halo to maintain centrifugal balance, then eq. (3) implies that the most vigorously amplified disturbances () will have . Since Zang (1976) had found that the full-mass disc was prone to cavity modes, Toomre (1981) preferred a model with in order to avoid lop-sided modes. Note that although swing-amplification will be near its most vigorous for disturbances for this choice of , bisymmetric cavity modes in a smooth disc are disallowed because an ILR would block the feedback loop.
Toomre employed the DF (Toomre, 1977; Binney & Tremaine, 2008)
| (4) |
where and the normalization constant is
| (5) |
[Sellwood (2012) erroneously omitted the factor .] Choosing yields a Gaussian distribution of velocities such that the disc has . Toomre further multiplied the DF by the double taper function
| (6) |
to create a central cut out centered at and an outer taper centered at , while maintaining the centripetal acceleration everywhere. Setting the taper indices and yielded an idealized, smooth disc model that Toomre claimed possessed no small amplitude unstable modes. We choose , and limit the radial extent of the disc by an energy cut-off that eliminates particles having sufficient energy to pass . Here we adopt units such that .
The evolution of one of the simulations of this model reported by Sellwood (2012) was illustrated in Fig. 1 above. The simulations in the present paper use the same code and disc model, have the same number of particles (see Table 1), but are integrated to only and so are unaffected by the later rapid growth phase.
| Grid size | 106 128 |
|---|---|
| Active sectoral harmonic | 2 or 3 |
| 8 grid units | |
| Softening length | |
| Number of particles | |
| Basic time-step | |
| Time step zones | 5 |
| Guard zones | 4 |
The particles in our simulations are constrained to move in a plane over a 2D polar mesh at which the accelerations are calculated, and interpolated to the position of each particle. In most cases, disturbance forces are restricted to a single sectoral harmonic, or . Since the gravitational field is a convolution of the mass density with a Green function that is most efficiently computed by Fourier transforms, it is easy to restrict the sectoral hamonics that contribute to the field when using a polar grid. A full description of our numerical procedures is given in the on-line manual (Sellwood, 2014b) and the code itself is available for download.
Table 1 gives the values of the numerical parameters for most simulations reported here, and we note when they are varied in a few cases. Sellwood (2012) reported, and we have reconfirmed in this study, that all our results are insensitive to reasonable changes to grid resoution, time step and zones, and number of particles. Changes to the softening length do affect the frequencies of the modes, but not the qualititative behaviour.
To set up each model we draw particles from the tapered DF (eqs. 4 and 6) as described in the appendix of Debattista & Sellwood (2000). However, in some experiments we modified the distribution of selected particles in order to introduce a single additional feature into the DF, as set out in §3.1.
We also restarted some simulations after “scrambling” a copy of the particle distribution. By this we mean that we changed for every particle, with being chosen at random from a distribution that is uniform in 0 to . Clearly scrambling resets the amplitudes of all non-axisymmetric disturbances back to the shot noise level of the initial disc, while preserving the radius and both velocity components (in polar coordinates), so that any features in the action distribution of the particles that had been introduced during prior evolution would be preserved. This is therefore not equivalent to a fresh start with a different random seed.
Note that the radial action, (Binney & Tremaine, 2008), has dimensions of angular momentum, is zero for a circular orbit, and increases with the eccentricity of the orbit. In an axisymmetric potential, the angular momentum, , is the other action for orbits confined to a plane.
3 Results
In this section we study the effect of introducing two distinct features into the otherwise unperturbed disc, both designed to excite an initial mode of a specific type, namely: a groove mode (Sellwood & Lin, 1989; Sellwood & Kahn, 1991) and an outer edge mode (Toomre, 1981; Papaloizou & Lin, 1989). In both cases, we follow its evolution and study the further modes that are excited. We show for each case that the second mode is a true instability of the modified disc by erasing all non-axisymmetric structure at the time the second mode began to grow, as just described, and demonstrating that the scrambled particle distribution possessed a very similar instability to that which developed in the continued original run. Furthermore we identify the scattering feature in action space that was responsible for the second instability, as reported below in §3.1.3.
3.1 Initial groove mode
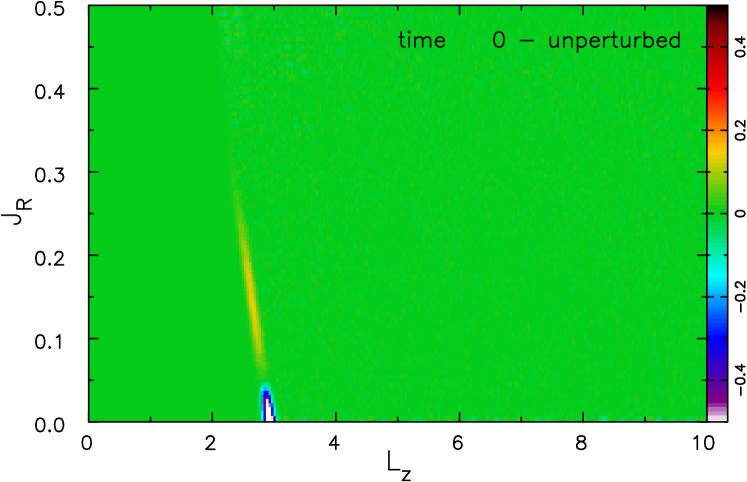
We create a deficiency of low- particles over a narrow inclined range in space by giving some particles a larger , as shown in Fig. 3. The slope of this feature, , approximately traces the locus of the ILR of a bisymmetric disturbance having a pattern speed , although the disturbance was, in fact, purely hypothetical. The ILR of a disturbance having this would lie at for circular orbits, for which .444Note that all the major resonances with any pattern speed and any angular periodicity in the self-similar Mestel disc lie on lines of slope in the space of these actions, for .
We describe this feature as a groove, since it is a deficiency at low over a narrow range in . Since orbits in this self-similar disc have typical epicyclic radii of about the guiding centre radius, this narrow groove in action space causes no noticeable change to the surface density profile.
| Line # | Model | Mode # | time range | |||||
|---|---|---|---|---|---|---|---|---|
| 1 | G | 2 | 1 | |||||
| 2 | G | 2 | 2 | |||||
| 3 | GR | 2 | 1 | |||||
| 4 | GR | 2 | 2 | |||||
| 5 | GSOLR | 2 | 1 | |||||
| 6 | GSCR | 2 | 1 | |||||
| 7 | E | 3 | 1 | |||||
| 8 | E | 3 | 2 | |||||
| 9 | ER | 3 | 1 | |||||
| 10 | ER2 | 2 | 1 | |||||
| 11 | ER2 | 2 | 2 | |||||
| 12 | GS3OLR | 3 | 1 |
Our, perhaps somewhat clumsy, procedure for shifting particles was motivated by our observations of resonance scattering in previous simulations. We calculated the frequency distance from the resonance for each particle, where and are respectively the angular frequencies of the guiding centre and radial oscillation for orbits of arbitrary eccentricity; note that these frequencies tend to the familiar quantities and as the eccentricity . We then select particles that have as candidates to be scattered. The relative frequency width, , of this feature is deliberately rather narrow. Of these, we further select only those particles whose energy of random motion , where the groove extends to the limiting random energy at , i.e. along the resonance locus. The probability that these selected particles are given larger random energy decreases from to zero as increases from zero to this maximum, where the fractional depth of the groove . The new where is the solution of , with being randomly drawn from a distribution uniform in 0–1, and finally .
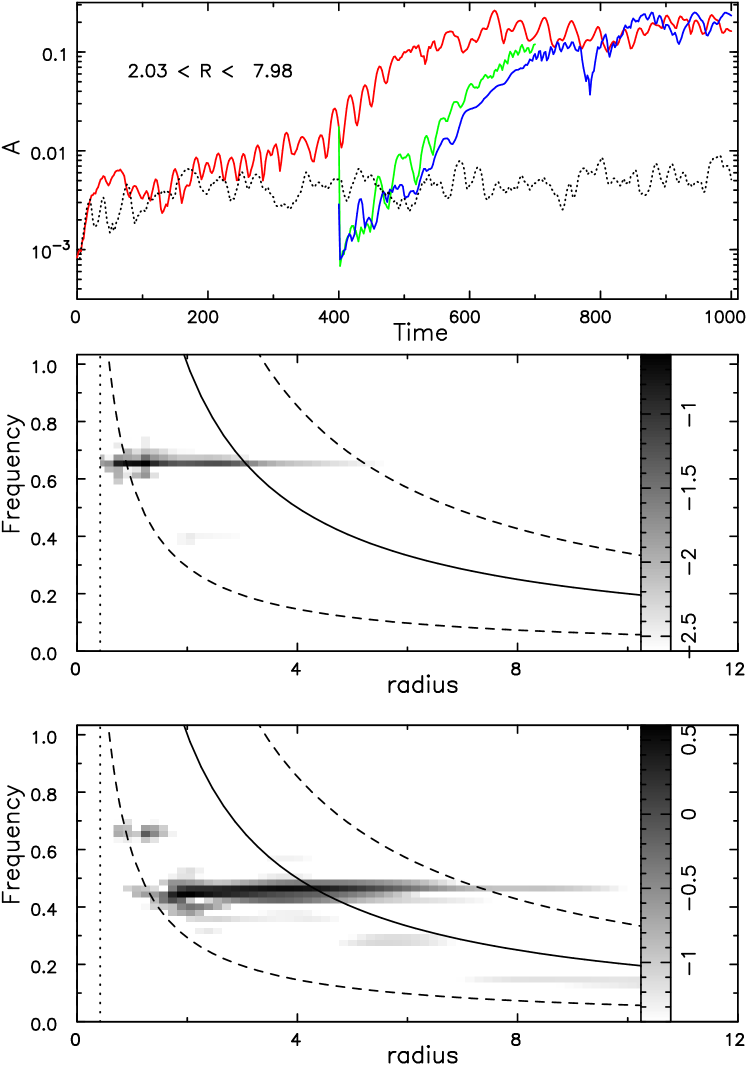
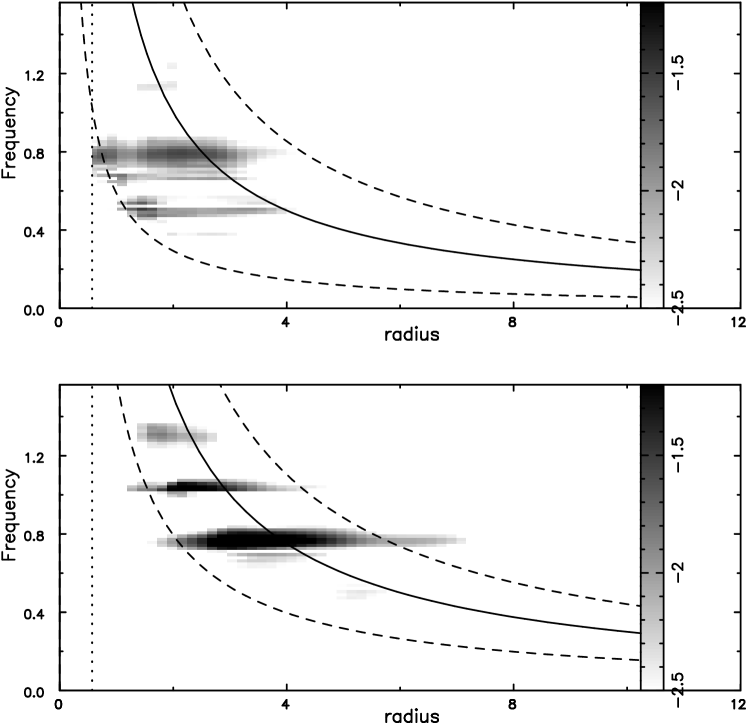
A simulation that employed this modified DF, model G, supported a groove instability at first. The red curve in the top panel of Fig. 4 presents the time evolution of the ratio averaged over the radius range . Since this is a different measure from that presented in Fig. 1, the dotted curve indicates this measure for the same model without the groove. The green and blue lines are explained below. Power spectra over two periods of growth are shown in the lower two panels. The middle panel is for the same time period as the middle panel in Fig. 1, although the grey scales differ, and the contrast in the appearance is quite striking.
3.1.1 First mode
The disturbance in model G grew slowly until , and the power spectrum over this time interval in the middle panel of Fig. 4 is dominated by a coherent disturbance of angular frequency that is mostly localized between the ILR and corotation. A couple of other frequencies that are probably due to swing-amplified noise are also faintly visible, and these uncorellated mild disturbances are responsible for the small, but rapid, amplitude fluctuations in the red line in the top panel.
We employed the mode-fitting procedure devised by Sellwood & Athanassoula (1986) to the data from model G over the time interval and give its estimated eigenfrequency in line 1 of Table 2. The shape of the fitted mode, with its principal resonances for circular orbits () marked by the circles, is shown in the upper panel of Fig 5, and the decomposition of the mode into logarithmic spirals is in the lower panel.
The mechanism for the groove instability was fully explained by Sellwood & Kahn (1991) and outlined above in §1.1. It is not a cavity-type mode, and the frequency is determined by the gradients in angular momentum density for orbits of small radial action. The density changes caused by non-axisymmetric disturbances at the groove “edges” excite a supporting response from the surrounding disc, making it a large-scale spiral mode. In principle, the circular angular frequency of the groove centre should be the pattern speed of the mode, but geometric factors in low- modes and finite growth rate cause the corotation radius to lie slightly farther out. The shape of the mode is determined by the shear rate and surface density profile of the disc, so that in the present self-similar disc, groove modes should have closely similar shapes and pitch angles and their spatial scale will vary with the corotation radius.

Evidence that this mode is a groove instability (Sellwood & Lin, 1989) is two-fold. First, corotation (line 1 of Table 2) lies close to, but just outside (Sellwood & Kahn, 1991), the groove centre at . Second, the leading component in the mode transform (bottom panel of Fig. 5) is much weaker than that in Fig. 2 because groove modes (§1.1) do not operate by a feedback cycle of combined leading and trailing waves.
Our choice of a very narrow frequency width for the groove ensured a low growth rate for the mode (Sellwood & Kahn, 1991). We found in other simulations, not described in detail here, that wider grooves excited a mode that grew more vigorously to higher amplitude. We preferred to study an instability that caused mild non-linear changes in order to make it easier to follow further activity that was a consequence of the initial mode.
3.1.2 Second mode
After the slow growth to , the disturbance amplitude in model G, shown by the red line in the top panel of Fig. 4, rose more rapidly over the time range . The power spectrum over this time range in the bottom panel revealed a new coherent wave having a frequency . As the mode had clearly saturated by the end of this period, we fitted a mode over the time interval , obtaining good fits with eigenfrequencies in the range given in line 2 of Table 2.
In order to verify that this second mode was a true linear instability of the modified disc, we made a copy of the particle distribution at and evolved the scrambled (see §2) particle distribution in a separate simulation, designated GR. The amplitude evolution in the simulation starting from this scrambled disc is shown by the green line in the top panel of Fig. 4. The very first value was measured from the particles before they were scrambled, after which the amplitude rose out of the shot noise steadily to when the run was stopped.
We found that the evolution of the scrambled disc, model GR, was again dominated by an exponentially growing disturbance of fixed pattern speed. The eigenfrequency fitted to the data from this run, given in line 3 of Table 2, is within the uncertainties the same as that in line 2 – the second mode found in model G. A second, milder instability was also present that had the fitted frequency given in line 4. At first we thought it could be the original groove mode, although the pattern speed is distinctly higher, but we identify its progeny at the end of §3.1.3.
3.1.3 Cause of the second mode
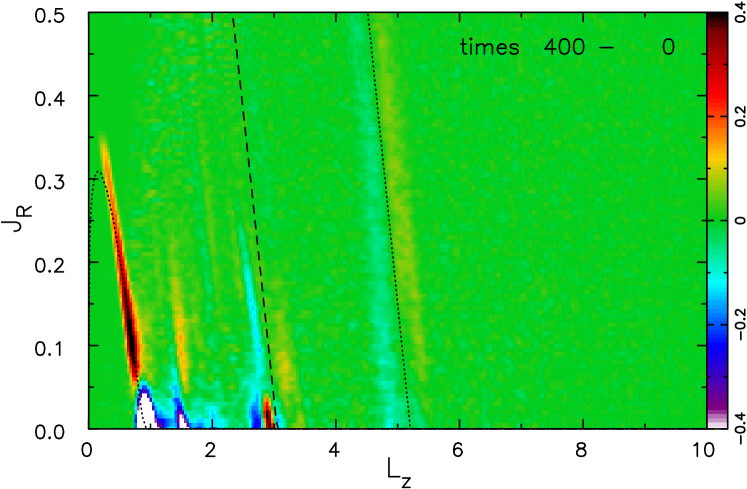
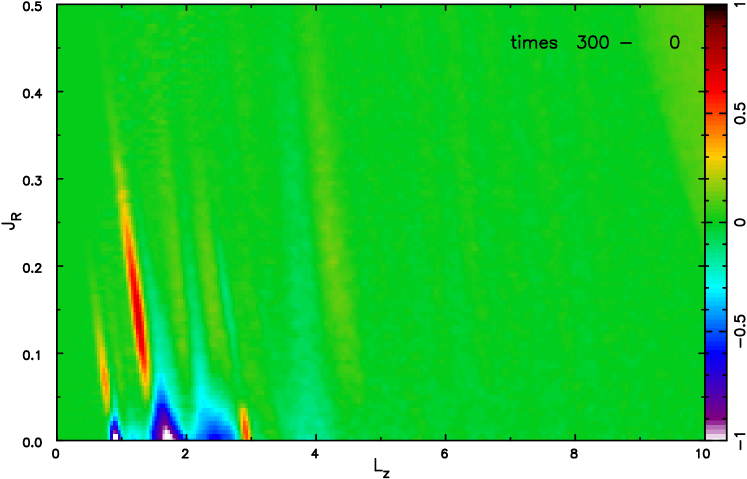
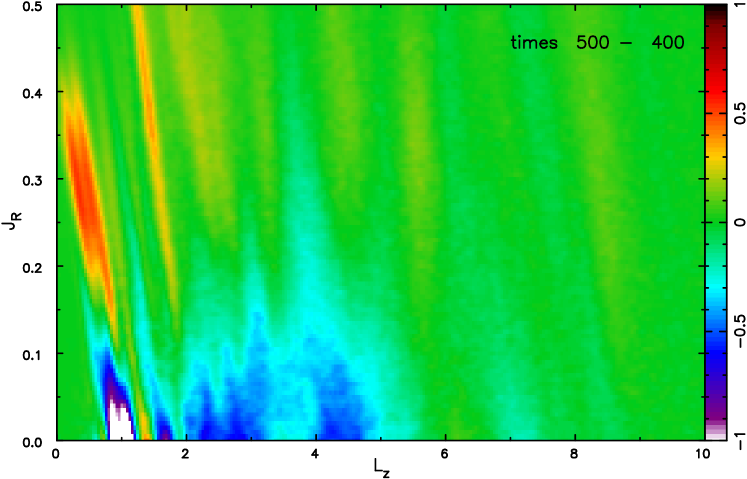
The second more vigorous mode, which was not present in the early evolution of the same model G (middle panel of Fig. 4), was caused by changes to the DF produced by the first mode. Fig. 7 reveals the changes to the density of particles in action space between times 0 and 400. The colour scale in this figure shows where the density of particles at is both greater and less than that at , and reveals several features. The dashed line marks the locus of the corotation resonance, and the dotted lines the Lindblad resonances, for the fitted frequency of the first mode in this simulation. These lines indicate that the most prominent feature is the result of ILR scattering and the faint pair of features at larger are associated with the OLR. A paired deficiency and excess have appeared near the location of the original groove at , reflecting the changes that must have been caused by the instability. As such changes occur near corotation, marked by the dashed line, they should not cause any significant change to (Sellwood & Binney, 2002), which is largely true. Since the groove instability is so mild, Fig. 7 also shows the effects of scattering by weak noise features that generally had lower frequencies than the excited mode.
Note the differences in the nature of the changes caused by scattering at the ILR from those at the OLR. In action space, the scattering vector at a resonance has slope (Sellwood & Binney, 2002), where is the angular multiplicity of the pattern and at respectively corotation and the inner and outer Lindblad resonances. Formally the slope is exact only as but we find it is an excellent approximation over the range of of interest here. As noted before (Sellwood, 2012; Sellwood & Carlberg, 2014; Sellwood et al., 2019), the scattering vector slope, , is almost perfectly aligned with the ILR locus for waves, implying that particles stay on resonance as they gain , allowing large changes to build up. Thus ILR scattering moves particles along the resonance locus, creating a deficiency of particles at low , and an excess for larger , just as we created artificially at the start of the first simulation (Fig. 3). On the other hand, scattering vectors at the OLR have positive slope , while the resonance locus again has slope . Thus we see particles are scattered across the resonance from a sloping deficiency to an almost parallel line where there is a slight excess. It is perhaps interesting that the lines are approximately parallel, indicating that the action changes are roughly independent of the initial . More importantly, is an intrinsically positive quantity, and therefore Lindblad resonance scattering always creates a deficiency at .
We suspected that one of the features in Fig. 7 was responsible for the new instability in model G. In order to determine which, we extracted all the particles in one of the features and spliced them into a pristine undisturbed particle distribution that we then evolved. In detail, we began the splicing procedure by creating a fresh set of particles from the doubly tapered Toomre-Zang DF described in §2 that lacked any additional features; recall that Toomre (1981) had predicted, and Sellwood (2012) had confirmed, that this model has no coherent, small amplitude instabilties. We then extracted all the particles from the evolved distribution at that lay within a trapezium in action space of width that was defined by , for some value of . We spliced the extracted particles into the undisturbed set by substituting the values of of these selected particles from the evolved set for the values in the undisturbed set of particles that lay within the same trapezium in action space.555Since the central attraction, , is an unchanging function throughout these experiments, we do not have to worry about possible changes to the axisymmetric potential. This process required attention to two points in order to obtain a near seamless splice. First, almost all the particles in the evolved model had changed their values during the evolution to , making it impossible to just replace particle from the pristine set with particle from the evolved set, even though they were both originally drawn from the same DF by the same algorithm. We therefore had to compute for every particle in both sets and rank order them to identify those in the desired range. Second, the large numbers of particles in the desired range of , typically some 4.5 million, was not precisely the same in the two sets, so that we had to skip the occasional particle, usually one in several hundred, in the larger set to ensure equal numbers that spanned the entire range. Fig. 7 shows the difference between the spliced and undisturbed sets for . It is clear that the OLR scattering feature from Fig. 7 has been satisfactorily isolated from all other features in action space at that time, without introducing sharp edges to the splice.
The time evolution of the disturbance density in a simulation started from the spliced distribution, model GSOLR, is indicated by the blue line in the top panel of Fig. 4. The mild non-axisymmetry of the spliced particles at , was erased by scrambling before the evolution commenced, and the disturbance density grew out of the noise, closely following the evolution from the simply scrambled disc, model GR, traced by the green line.666Other modes are excited after , and interference between disturbances rotating at different rates can cause large temporary decreases in the measured amplitude. The eigenfrequency fitted to the data from this spliced run is given in line 5 of Table 2 and is, again within the uncertainties, the same as those in lines 2 and 3, the second mode in model G and the mode in the scrambled disc, model GR. This evidence conclusively shows that the OLR scattering feature of the first mode in model G was responsible for creating the second instability.
Note that the corotation resonance for near circular orbits of the modes given in lines 2, 3, and 5 of Table 2, all lie near the OLR feature created by the first mode (Fig. 7) strongly suggesting that the second mode was also a groove instability. It seems likely that the deficit of particles near was the cause.
We were quite surprised to find it was the OLR scattering feature that was responsible for the second instability for the reasons set out in the discussion below (§4). Yet our experiment with the isolated weak scattering feature of the OLR leaves no doubt that it did indeed provoke a new instability that was more vigorous than the original mode.
The near coincidence of the OLR for the first mode (line 1 of Table 2) with CR for the second (lines 2, 3 and 5 of Table 2) suggests non-linear mode coupling. Resonance scattering to create the new groove is a non-linear effect, but we have strong evidence against the hypothesis of coupling at resonances between large amplitude waves that was first proposed by Tagger et al. (1987). A technical reason is that their theory requires the interaction of three waves, with the third wave having rotational symmetry that is the sum or difference of the two other waves, and our simulation in which disturbance forces were restricted to could not support disturbances having or 4. However, the more compelling argument is that scrambling the particles erased all non-axisymmetric features in the density distribution, which need to have significant amplitude for the mode coupling mechanism to work. Instead, our simulations provide clear evidence that the second mode is a true, linear instability of the modified disc at .
We tried other experiments for which we chose other splice centres, but do not illustrate the results. Choosing , model GSCR supported a mild groove mode with frequency given in line 6 of Table 2; the deficiency of the original DF had been shifted to lower by the evolution of the first groove mode, causing the slightly higher pattern speed than that reported in line 1. It is satisfying to note that this instability approximately matches that of the second mode in the scrambled model GR, reported in line 4 of the table. Simulations of particle distributions that resulted from splicing with or from appeared not to support any coherent instability. The strong ILR scattering feature from the first mode lies within the inner taper, and is therefore unable to excite a significant instability because the tapered surounding disc would provide only a weak supporting response of (Sellwood & Kahn, 1991).
3.2 Initial edge mode
All we needed to do to excite an edge mode was to increase the value of for the outer index taper (eq. 6). Setting created a vigorous instability that saturated at large amplitude, strongly distorting a large fraction of the disc. After some experimentation, we found that setting , model E, yielded an outer edge mode with a moderate growth rate that enabled us to understand the subsequent evolution. Note that for the sequence of runs reported in this section, in which the initial disturbances were in the outer disc where the grid becomes coarser, we used a 4 times finer grid (). We also restricted disturbance forces to , rather than , in order that the modes have smaller radial extent, but the other numerical parameters were unchanged.
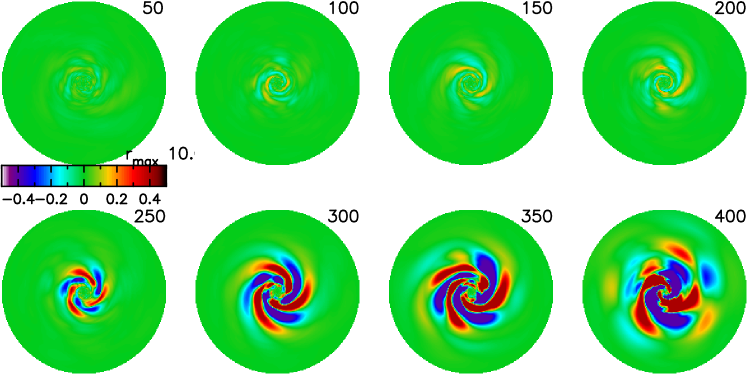
The evolution of the non-axisymmetric density of model E is shown in Fig. 8. A 3-arm spiral grows slowly in the outer disc until , after which additional patterns appear closer to the disc centre. The amplitude evolution of the disturbance density over the radius range and power spectra over two periods of growth are shown in Fig. 9.

3.2.1 First mode
The evolution of model E to , is dominated (middle panel of Fig. 9) by a single, exponentially growing disturbance of frequency , that extends from its ILR to OLR, with corotation perhaps near . The mode fitting software yielded an eigenfrequency given in line 7 of Table 2 and the fitted mode and its logarithmic spiral transform are presented in Fig. 10.
It has the hallmarks of an edge mode. As expected (Toomre, 1989), (line 7 of Table 2) lies outside the radius of the steepest gradient, which is at , the centre of the outer taper. Again, the logarithmic spiral transform of the mode, lower panel of Fig. 10, has no significant leading component as expected for an edge mode, since the mechanism does not require feedback through leading waves (see §1.1).
Fig. 11 displays the changes to the density of particles in action space between and in model E, and the dashed and dotted lines mark the loci of the principal resonances for the measured pattern speed of the original edge mode. It reveals scattering features at corotation and the ILR, but there are no significant changes at the OLR because there is very little disc left at those radii, and angular momentum transport by this edge mode is from the ILR to CR only. Since the power spectra (Fig. 9) and the fitted mode shape (Fig. 10) were drawn using the relative overdensity at each radius, they exaggerate the apparent amplitude of the mode in the very outer part of the disc. The very low frequency features in the bottom panel of Fig. 9 have a small absolute amplitude, and probably arise from shot noise due to the low particle density near the disc edge.
As noted above, scattering vectors in action space have slopes . Thus the near perfect alignment of the scattering vector with the locus of the ILR occurs only for disturbances, and therefore the excess and deficiency in Fig. 11 at the ILR are slightly offset from the resonance locus for this pattern, and the groove carved by the mode at is fractionally exterior to its ILR.
3.2.2 An inwardly propagating cascade of groove modes
The power spectrum of the later part of this simulation, in the bottom panel of Fig. 9, indicates several additional coherent waves, in addition to the continuing presence of the first mode, which had not even finished growing by .
We have fitted two modes to the data from the simulation over the period , recovering both the edge mode and the second mode, which has an estimated frequency given in line 8 of Table 2. Corotation for this second mode, also given in line 8, is somewhat outside the groove centre carved by the original edge mode, as is usual groove mode (Sellwood & Kahn, 1991).
The green line in Fig. 9 shows the amplitude evolution we obtain in a new simulation, model ER, started from the scrambled particles of model E at . Once again we find the perturbation amplitude grows rapidly with the estimated frequency given in line 9 of Table 2, which is in reasonable agreement with the frequency of the second mode given in line 8. Note the second mode outgrows the original edge mode, which is also detectable in the scrambled simulation. The true uncertainties in the measured frequencies and resonance radii in this case are probably greater then the formal values given in the table because we were attempting to fit two vigorously growing modes over a short time interval.
The numerical evidence just presented implies that the second mode in model E is a groove mode seeded by ILR scattering by the first mode (Fig. 11). Once again, the near coincidence of the ILR of mode 1 (line 7 of Table 2) is CR of its daughter (line 8) is not evidence for non-linear mode coupling, for the same reasons as given above. We obtained the daughter mode (line 9) even when we eliminated all pre-existing waves by scrambling the disc particles, and we have strong evidence that the new mode is a linear instability caused by scattering at the ILR of the first mode.
The power spectrum in the bottom panel of Fig. 9 strongly suggests a cascade of groove instabilities to ever higher frequency, with corotation of each subsequent instability lying at the ILR of the previous. Since the initial outer edge mode had a low growth rate, the inner disc had to wait for a succession of destabilising grooves to be carved before each mode could develop. This delay is all the more remarkable because the dynamical clock runs faster at smaller radii. The long absence of coherent disturbances in the inner disc could therefore happen only if the single instability the disc possesses is at its outer edge.
3.3 Changes of angular symmetry
Disturbance forces in the two sets of experiments described above were each confined to a single sectoral harmonic: for the initial groove mode (§3.1) and for the initial edge mode (§3.2). Furthermore, the simulations with scrambled or spliced particle sets were also restricted to the same symmetry as in the parent simulation. Here we show that the features in action space created by the first mode can also give rise to instabilities having other rotational symmetries.
3.3.1 From 3 to 2
The initial edge mode of model E presented in §3.2 scattered particles to produce the features shown in Fig. 11 by . We have already demonstrated that the ILR scattering feature causes a new groove instability that we identified both in the continued run, model E, and in a separate simulation, model ER, started from a scrambled copy of the particles at . Here we report another simulation, model ER2, with the same scrambled copy of the particles at , but with disturbance forces restricted to instead.
The disturbance amplitude exponentiates rapidly, as shown in the top panel of Fig.12, and the power spectrum in the bottom panel reveals two simultaneous instabilities. Our mode fitting software finds two modes, a groove instability given in line 10 of Table 2 and an edge mode having a frequency given in line 11.
As noted above (§3.2.2), the edge mode in model E was still growing at , and it is therefore hardly surprising to find that the edge of this disc remains steep enough to excite a new edge mode this time. The new mode, line 11 of Table 2, has a higher growth rate than the edge mode because the swing amplifier is at full strength in this case, , whereas for . Because the instability is more vigorous, corotation is at the larger radius, as also indicated in the Table.
The groove mode in model ER2 also has a higher growth rate, line 10, than at instability from the same file of particles (line 9 of Table 2), consistent with more vigorous swing amplification, and corotation is still farther from the groove created by ILR scattering by the original edge mode at , as expected for a more vigorous and larger-scale groove instability (Sellwood & Kahn, 1991).
3.3.2 From 2 to 3
In this next case, model GS3OLR, we start from the spliced set of particles shown in Fig. 7, but this time restrict perturbation forces to the sectoral harmonic. Our estimated frequency of the dominant instability is given in line 12 of Table 2, and corotation is again almost exactly at the location of the groove in action space, as for the modes in lines 2, 3 and 5. Notice that the growth rate is a little lower than for the corresponding case (line 5 of Table 2), consistent with expectations since swing amplification is less vigorous for than for .
These last two experiments have demonstrated that a groove created by Lindblad resonance scattering from a pattern of one sectoral harmonic can excite an instability of a different .
3.4 A very slightly more general case
Perturbation forces in all the preceding simulations were restricted to a single sectoral harmonic, which we now relax. We start a simulation, model GU, from the particle distribution used in the groove mode case, shown in Fig. 3, which we know from model G will excite at least a mild instability. However, perturbation forces in this new experiment now include terms, with the exception that is excluded to avoid possible unbalanced forces from the fixed rigid halo component.
Multiple patterns develop over time, as shown in Fig. 13, with perhaps the first feature to appear being an mode. Fig. 14 presents power spectra from model GU over the same time interval for both and , revealing a number of coherent waves with pattern speeds independent of radius. A number of strong scattering features in action space are visible at in Fig. 15 (top). The bottom panel shows that changes become so intricate in the later evolution that we are no longer able to isolate the effects of individual modes, but there seems little doubt that the disc is being repeatedly destabilized by scattering at resonances of successive disturbances, each of which removes particles from near-circular orbits over narrow ranges of .
4 Discussion
The simulations of Sellwood & Carlberg (2014) manifested an apparently outwardly propagating cascade of spiral modes to ever larger radii over time. Although they presented evidence of resonance scattering and argued that the changes to the DF excited subsequent modes, they did not identify the mechanism. Here we have presented compelling evidence that the recurrence mechanism identified long ago by Sellwood & Lin (1989) for spirals a low-mass disc with a Keplerian rotation curve can, in fact, operate in massive discs having flat rotation curves. We doubted that this would be viable for three principal reasons that, in hindsight, no longer seem particularly cogent.
-
1
Probably the strongest reason was that the radial extent of spiral modes, which are expected to extend from the ILR to the OLR (Lin & Shu, 1964), is much greater for waves in a disc having a flat rotation curve. Both the lower value and the shape of the rotation curve cause the ratio , which was 1.67 for waves in a Kepler potential, to rise to for patterns in a flat rotation curve. If the patterns were required not to overlap, it would be hard to fit many into any disc of reasonable extent. But in fact, for a cascade of outwardly propagating modes, successive disturbances have radii in the ratio . Even for an inwardly propagating cascade initiated by an edge mode, say, the ratio is . These smaller ratios, which also allow extensive overlap of successive modes, would be even further reduced for larger values of .
-
2
It is well known that spiral disturbances have much greater amplitude inside corotation than outside – examples include the famous dust-to-ashes figure from Toomre (1981), as well as the power spectra and modes presented here, e.g. the middle panel of Fig. 4. However, the fitted mode in that case (Fig. 5) does have a weak spiral that extends past the OLR circle. This general disparity suggested that scattering at the OLR would not be as important as at the ILR. Since self-excited modes in a disc must conserve angular momentum (there is no externally applied torque), the gains and losses must balance and the angular momentum emitted at the ILR must be absorbed at other resonances. With the exception of edge modes, where corotation takes up almost all the angular momentum lost at the ILR (Fig. 11), the OLR must absorb a significant amount.
-
3
The third reason we expected that OLR scattering would be less consequential than at the ILR has already been stated. The close alignment of the ILR locus and the scattering vector causes particles to stay on resonance as they are scattered allowing large changes to build up. This does not happen at the OLR, where scattered particles are quickly moved off resonance and the angular momentum gain must therefore be shared among many more particles. Again this is true and consistent with our results presented in Fig. 7, which led us to doubt that the feeble OLR scattering seen there could excite the second mode. However, it seems that the depopulation of the low- region, as many particles are shifted away from near-circular orbits, is the dominant source of excitation of the next mode.
These arguments make it clear that we were wrong to doubt the possibility of a cascade of groove instabilities, running either radially outward or inward, could occur in a massive disc having a flat rotation curve. The evidence presented in §3 demonstrates that cascades of groove modes, with each causing changes to excite the next, arise naturally.
5 Conclusions
In this paper, we have presented a new part of our picture that spiral patterns result from true instabilities in galaxy discs. We have demonstrated that scattering at either Lindblad resonance by any one wave carves a new groove in the disc that excites a further mode. We presented examples of both inwardly and outwardly propagating cascades of instabilities in simulations restricted to a single sectoral harmonic. We also showed that a groove created by one wave of a certain angular symmetry can excite a mode of different angular symmetry. Thus, in more general simulations that include disturbance forces from multiple sectoral harmonics, such as are inevitable when tree codes are employed, it quickly becomes very difficult to follow the causal chain from one wave to the next.
The mirror mode mechanism, proposed by Sellwood & Carlberg (2014), seemed to be responsible for the first true mode in models 50 of Sellwood (2012), as evidenced by Fig. 2 shown here. However, we suspect it is important only in models that lack strong instabilities. Once a recurrent cycle of groove modes becomes established, mild variations of impedance to cause partial reflections of travelling waves must become physically less important as scattering features in phase space increase in both the strength and number – see e.g. the bottom panel of our Fig. 15 and Fig. 6 of Sellwood & Carlberg (2014), where 3D motion was allowed. The recurrent cycle of groove modes reported here is then far more likely to be the main driver of evolution.
The additional evidence we have presented here strengthens our argument that spirals in simulations are manifestations of global instabilities. The modes in our simulations are each detectable as coherent waves of fixed frequency for a number of rotations, but the visual pattern of spirals changes on a much shorter time scale. The superposition of two or more modes inevitably leads to the apparently shearing spiral features that are widely reported. But only unbounded growth of true instabilities in the linear regime can account for the final amplitudes being independent of the number of particles, as we have repeatedly shown in our previous work (Sellwood, 2011, 2012; Sellwood & Carlberg, 2014). None of the many papers arguing for the fundamental nature of shearing features has so far presented any mechanism that could deliver unbounded growth. Swing amplification and wakes, which are invoked in these papers, undoubtedly enhance collective features, but only by a fixed factor in linear theory (Julian & Toomre, 1966; Toomre, 1981). D’Onghia et al. (2013) describe non-linear consequences of responses to the mass clumps they introduced into their disc models, which do appear to cause more persisting non-axisymmetric structures, but it is unclear as yet whether they could account for indefinite growth. The non-linear scattering at resonances, that is a crucial part of our picture, readily excites new instabilities, leading to a robust cycle of recurring modes that accounts for the kind of behaviour that is almost universally observed in simulations of disc galaxies.
Naturally, resonant scattering causes irreversible changes, and the consequent secular increase in random motion would, if unchecked, degrade the ability of the disc to support continuing collective instabilities, and spiral activity must fade. But Sellwood & Carlberg (1984) were the first to show that allowing for dissipation and star formation in a reasonable gas fraction could allow spiral activity to continue “indefinitely,” an idea that has been supported in much subsequent work.
In their analysis of the local Gaia data, Sellwood et al. (2019) argued that an action-space representation of local phase space revealed evidence for Lindblad resonance scattering, that was not all attributable to the bar (Monari et al., 2018). This evidence suggests that the Milky Way has supported global spiral modes of the type we describe in our simulations, and we are reasonably confident that spirals in the old stellar discs of many other galaxies also result from such instabilities.
Acknowledgements
We thank an anonymous referee for thoughtful comments on the paper, and also Elena D’Onghia and especially Daisuke Kawata for helpful conversations during the Gaia19 program at KITP, where this paper was advanced significantly. KITP is supported in part by NSF grant PHY-1748958. JAS also acknowledges the hospitality of Steward Observatory.
References
- Agertz et al. (2011) Agertz, O., Teyssier, R. & Moore, B. 2011, MNRAS, 410, 1391
- Athanassoula et al. (1987) Athanassoula, E., Bosma, A. & Papaioannou, S. 1987, A&A, 179, 23
- Aumer et al. (2016) Aumer, M., Binney, J. & Schönrich, R. 2016, MNRAS, 459, 3326
- Baba (2015) Baba, J. 2015, MNRAS, 454, 2954
- Baba et al. (2013) Baba, J., Saitoh, T. R. & Wada, K. 2013, ApJ, 763, 46
- Bertin & Lin (1996) Bertin, G. & Lin, C. C. 1996, Spiral Structure in Galaxies (Cambridge, MA: The MIT Press)
- Bertin et al. (1989) Bertin, G., Lin, C. C., Lowe, S. A. & Thurstans, R. P. 1989, ApJ, 338, 104
- Binney (2019) Binney, J. 2019, MNRAS, submitted (arXiv:1906.11696)
- Binney & Tremaine (2008) Binney J. & Tremaine S. 2008, Galactic Dynamics 2nd ed. (Princeton University Press, Princeton NJ) (BT08)
- Carlberg & Sellwood (1985) Carlberg, R. G. & Sellwood, J. A. 1985, ApJ, 292, 79
- Davis et al. (2012) Davis, B. L., Berrier, J. C., Shields, D. W., et al. 2012, ApJS, 199, 33
- Debattista & Sellwood (2000) Debattista, V. P. & Sellwood, J. A. 2000, ApJ, 543, 704
- De Rijcke et al. (2019) De Rijcke, S., Fouvry, J-B. & Pichon, C. 2019, MNRAS, 484, 3198
- Dobbs & Baba (2014) Dobbs, C. & Baba, J. 2014, PASA, 31, 35
- D’Onghia et al. (2013) D’Onghia, E., Vogelsberger, M. & Hernquist, L. 2013, ApJ, 766, 34
- Earn & Sellwood (1995) Earn, D. J. D. & Sellwood, J. A. 1995, ApJ, 451, 533
- Fouvry et al. (2015) Fouvry, J-B., Binney, J. & Pichon, C. 2015, ApJ, 806, 117
- Fouvry & Pichon (2015) Fouvry, J-B. & Pichon, C. 2015, MNRAS, 449, 1928
- Gaia collaboration: Katz et al. (2018) Gaia collaboration: Katz, D., Antoja, T., Romero-Gó, M., et al. 2018, A&A, 616A, 11
- Grand et al. (2012a) Grand, R. J. J., Kawata, D. & Cropper, M. 2012a, MNRAS, 421, 1529
- Grand et al. (2012b) Grand, R. J. J., Kawata, D. & Cropper, M. 2012b, MNRAS, 426, 167
- Grand et al. (2013) Grand, R. J. J., Kawata, D. & Cropper, M. 2013, A&A, 553A, 77
- Goldreich & Lynden-Bell (1965) Goldreich, P. & Lynden-Bell, D. 1965, MNRAS, 130, 97
- Hart et al. (2016) Hart, R. E., Bamford, S. P., Willett, K. W., et al. 2016, MNRAS, 461, 3663
- Hohl (1971) Hohl, F. 1971, ApJ, 168, 343
- Hunt et al. (2018) Hunt, J. A. S., Hong, J., Bovy, J., Kawata, D. & Grand, R. J. J. 2018, MNRAS, 481, 3794
- Julian & Toomre (1966) Julian, W. H. & Toomre, A. 1966, ApJ, 146, 810
- Kalnajs (1971) Kalnajs, A. J. 1971, ApJ, 166, 275
- Kalnajs (1973) Kalnajs, A. J. 1973, Proc. Astron. Soc. Australia, 2, 174
- Kalnajs (1978) Kalnajs, A. J. 1978, in IAU Symposium 77 Structure and Properties of Nearby Galaxies eds. E. M. Berkhuisjen & R. Wielebinski (Dordrecht:Reidel) p. 113
- Kawata et al. (2014) Kawata, D., Hunt, Jason A. S., Grand, R. J. J., Pasetto, S. & Cropper, M. 2014, MNRAS, 443, 2757
- Kumamoto & Noguchi (2016) Kumamoto, J. & Noguchi, M. 2016, ApJ, 822, 110
- Lin & Shu (1964) Lin, C. C. & Shu, F. H. 1964, ApJ, 140, 646
- Lynden-Bell & Kalnajs (1972) Lynden-Bell, D. & Kalnajs, A. J. 1972, MNRAS, 157, 1
- Mark (1974) Mark, J. W-K. 1974, ApJ, 193, 539
- Mark (1977) Mark, J. W-K. 1977, ApJ, 212, 645
- Michikoshi & Kokubo (2018) Michikoshi, S. & Kokubo, E. 2018, MNRAS, 481, 185
- Monari et al. (2018) Monari, G., Famaey, B., Siebert, A., Wegg, C. & Gerhard, O. 2019, A&A, 626A, 41
- Oort (1962) Oort, J. H. 1962, in Interstellar Matter in Galaxies, ed. L. Woltjer (New York: Benjamin), p. 234
- Papaloizou & Lin (1989) Papaloizou, J. C. B. & Lin, D. N. C. 1989, ApJ, 344, 645
- Quillen et al. (2011) Quillen, A. C., Dougherty, J., Bagley, M. B., Minchev, I. & Comparetta, J. 2011, MNRAS, 417, 762
- Roca-Fàbrega et al. (2013) Roca-Fàbrega, S., Valenzuela, O., Figueras, F., et al. 2013, MNRAS, 432, 2878
- Roškar et al. (2008) Roškar, R., Debattista, V. P., Quinn, T. R., Stinson, G. S. & Wadsley, J. 2008, ApJ, 684, L79
- Sellwood (1989) Sellwood, J. A. 1989, in Dynamics of Astrophysical Discs, ed. J. A. Sellwood (Cambridge: Cambridge University Press) p. 155
- Sellwood (2011) Sellwood, J. A. 2011, MNRAS, 410, 1637
- Sellwood (2012) Sellwood, J. A. 2012, ApJ, 751, 44
- Sellwood (2014a) Sellwood, J. A. 2014a, Rev. Mod. Phys., 86, 1
- Sellwood (2014b) Sellwood, J. A. 2014b, arXiv:1406.6606 (on-line manual: http://www.physics.rutgers.edu/sellwood/manual.pdf)
- Sellwood & Athanassoula (1986) Sellwood, J. A. & Athanassoula, E. 1986, MNRAS, 221, 195
- Sellwood & Binney (2002) Sellwood, J. A. & Binney, J. J. 2002, MNRAS, 336, 785
- Sellwood & Carlberg (1984) Sellwood, J. A. & Carlberg, R. G. 1984, ApJ, 282, 61
- Sellwood & Carlberg (2014) Sellwood, J. A. & Carlberg, R. G. 2014, ApJ, 785, 137
- Sellwood & Kahn (1991) Sellwood, J. A. & Kahn, F. D. 1991, MNRAS, 250, 278
- Sellwood & Lin (1989) Sellwood, J. A. & Lin, D. N. C. 1989, MNRAS, 240, 991
- Sellwood et al. (2019) Sellwood, J. A., Trick, W. H., Carlberg, R. G., Coronado, J. & Rix, H-W. 2019, MNRAS, 484, 3154
- Shu (2016) Shu, F. H. 2016, ARA&A, 54, 667
- Sridhar (2019) Sridhar, S. 2019, arXiv:1906.08655
- Tagger et al. (1987) Tagger, M., Sygnet, J. F., Athanassoula, E. & Pellat, R. 1987, ApJ, 318, 43
- Toomre (1969) Toomre, A. 1969, ApJ, 158, 899
- Toomre (1977) Toomre, A. 1977, ARA&A, 15, 437
- Toomre (1981) Toomre, A. 1981, In ”The Structure and Evolution of Normal Galaxies”, eds. S. M. Fall & D. Lynden-Bell (Cambridge, Cambridge Univ. Press) p. 111
- Toomre (1989) Toomre, A. 1989, in Dynamics of Astrophysicsl Discs, ed. J. A. Sellwood (Cambridge: Cambridge University Press) p. 153
- Toomre (1990) Toomre, A. 1990, in Dynamics & Interactions of Galaxies, ed. R. Wielen (Berlin, Heidelberg: Springer-Verlag), p. 292
- Toomre & Kalnajs (1991) Toomre, A. & Kalnajs, A. J. 1991, in Dynamics of Disc Galaxies, ed. B. Sundelius (Gothenburg: Göteborgs University) p. 341
- Yu et al. (2018) Yu, S-Y., Ho, L. C., Barth, A. J. & Li, Z-Y. 2018, ApJ, 862, 13
- Zang (1976) Zang, T. A, 1976, PhD thesis., MIT