Influence of interface and microstructure on magnetization of epitaxial thin film
Abstract
Epitaxial thin films grown on lattice-matched LaAlO3 (LAO) substrate using sputtering and molecular beam epitaxy techniques have been studied in this work. Within the sputtering process, films were grown with conventional direct current magnetron sputtering (dcMS) and for the first time, using a high power impulse magnetron sputtering (HiPIMS) process. Surface morphology and depth profile studies on these samples reveal that HiPIMS deposited film has the lowest roughness, the highest packing density and the sharpest interface. We found that the substrate-film interface and the microstructure play a vital role in affecting the magnetic properties of films. La from the LAO substrate and Fe from the film interdiffuse and forms an undesired interface spreading to an extent of about 10-20 nm. In the HiPIMS process, layer by layer type growth leads to a globular microstructure which restricts the extent of the interdiffused interface. Such substrate-film interactions also affect the electronic hybridization and magnetic properties of films. The magnetic moment () was compared using bulk, element-specific and magnetic depth profiling techniques. We found that was the highest when the thickness of the interdiffused layer was lowest. And such conditions can only be achieved in the HiPIMS grown samples. Presence of small moment at the N site was also evidenced by element-specific x-ray circular dichroism measurement in HiPIMS grown sample. A large variation in the values of films found in the experimental works carried out so far could be due to such interdiffused layer which is generally not expected to form in otherwise stable oxide substrate at low substrate temperature 675 K. In addition, a consequence of substrate-film interdiffusion and microstructure results in different kinds of different kind of magnetic anisotropies in films grown using different techniques. A detailed investigation of substrate-film interface and microstructure on the magnetization of film is presented and discussed in this work.
I Introduction
Ferromagnetic electrodes materials with large spin polarization ratio (SPR) of transport electrons are of great interest for the application development of spintronic devices. Numerous materials have been actively investigated in this context. Ji et al. (2001); Vahidi et al. (2014) Among them, recently elicited renewed interest as it is predicted to show half-metallicity (spin polarization ratio 100), Kokado et al. (2006) high Curie temperature ( 761 K), Meinert (2016) large magnetic moment ( 2.5 /Fe atom) Blancá et al. (2009) low coercivity and high chemical stability. Blancá et al. (2009) In addition, possesses an anti-perovskite structure which can be epitaxially grown on most oxide substrates such as SrTiO3, MgO and LaAlO3. is also reported to exhibit the perpendicular magnetic anisotropy with BiFeO3 Yin et al. (2016) and giant value of tunnel magneto resistance (TMR 24000) with MgO based magnetic tunnel junction. Yang et al. (2018) As a result, becomes an attractive candidate in spintronic devices due to its TMR ratio, spin polarization ratio, etc. Komasaki et al. (2009); Narahara et al. (2009)
However, a large variation (from the theoretical value of 2.5 /Fe atom Blancá et al. (2009)) can be seen in the of thin films studied so far (table 1). In some studies as high as 2.9 Atiq et al. (2008) was reported and in others as low as 1.3 /Fe atom. Feng-Xian et al. (2015) In most other works the of was found between these two extremes shown in table 1. Such a large scattering in the values of can stem from various experimental factors: (i) measurement accuracy (ii) phase purity and/or compositional variations across the depth of the film and (iii) the deposition methodology affecting the microstructure of the films. These factors need to be sought.
It should be noted here that primarily bulk magnetization measurements have been performed on thin films in most of the work hitherto which inherently includes the large foreseen errors while estimating the film volume. On the other hand, studies on the structural and magnetic depth profiling in film are completely lacking. Moreover, different deposition methodology may also lead to different microstructure and hence different values in thin film. Mostly, direct current magnetron sputtering (dcMS) Atiq et al. (2008); Feng-Xian et al. (2015); Loloee et al. (2003); Na et al. (2015); Dirba et al. (2015) and molecular beam epitaxy (MBE) Costa-Krämer et al. (2004); Ito et al. (2011, 2015); Narahara et al. (2009); Komasaki et al. (2009) methods have been extensively used to prepare the films. Whereas, relatively new but a very promising technique - high power impulse magnetron sputtering (HiPIMS) has not yet been employed. There are several advantages inherent to the HiPIMS process over the conventional dcMS process such as improvement of the film quality by denser microstructure and enhanced adhesion etc. Anders (2017); Gudmundsson et al. (2012) As compared to dcMS, in HiPIMS high-power pulses are employed at low duty cycle ( 10) Strijckmans et al. (2017) leading to enhanced ionization of process gas and sputtered species. Therefore, the fraction of ionized species exceeds neutrals. These unusual properties of HiPIMS led to additional improvement in the film quality. Anders (2017); Gudmundsson et al. (2012)
In the view of this, we scrutinize the factors affecting the variation in in a systematic way in this work. We deposited single phase and epitaxial film on a LaAlO3 substrate (lattice parameter; LP = 3.79 Å) as it is almost 100 lattice matched with (LP = 3.79 Å) Blancá et al. (2009). They were deposited using three different techniques namely dcMS, N-plasma assisted MBE and HiPIMS. We performed detailed depth profiling measurements on these samples and found an interesting result that La from the LAO and Fe from interdiffuse at the film-substrate interface. The extent of this interface gets affected due to differences in the microstructure of samples grown using different methods. By further performing magnetic depth profiling and element specific magnetization measurements, we attempt to understand the role of interface and microstructure in affecting the magnetization of thin films.
| Experiemtnal Work | |||
| Technique | Ref. | ||
| /Fe | |||
| 2.9 | Bulk magnetisation | [Atiq et al. (2008)] | |
| 1.3 | Bulk magnetisation | [Feng-Xian et al. (2015)] | |
| 2.23 | Bulk magnetisation | [Dirba et al. (2015)] | |
| 2.47 | x-ray circular magnetic dicorism | [Ito et al. (2011)] | |
| 2.04 | Bulk magnetisation | [Nikolaev et al. (2003)] | |
| 2.1 | x-ray circular magnetic dicorism | [Takagi et al. (2010)] | |
| 2.12 | Bulk magnetisation | [Gölden et al. (2017)] | |
| 1.65 | Bulk magnetisation | [Li et al. (2018)] | |
| Theoretical Work | |||
| Method/function | Ref. | ||
| /Fe | |||
| 2.4-2.8 | APW+lo/LDA+U, PBE+U | [Blancá et al. (2009)] | |
| 2.29 | LMTO+ASA/LDA | [Sakuma (1991)] | |
| 2.355 | LMTO+ASA/LDA | [Kuhnen et al. (1992)] | |
| 2.31 | LMTO+ASA/LDA | [Coey et al. (1994)] | |
| 2.42 | FLAPW/LDA | [Coehoorn et al. (1993)] | |
| 2.34 | FLAPW/LDA | [Mohn and Matar (1999)] | |
| 2.16 | FLAPW/LDA | [Sifkovits et al. (1999a)] | |
| 2.35 | ASW/GGA | [Houari et al. (2010)] |
II Experimental Procedure
films were grown on LaAlO3 (100) substrate using N-assisted MBE (DCA, M600 system at JCNS, Garching), direct current magnetron (dcMS) and high power impulse mgnetron sputtering (HiPIMS) (ATC Orion 8, AJA Int. Inc. at UGC-DAE CSR, Indore) techniques. In MBE a rf N-plasma source was used to evaporate Fe (99.995 pure) from an effusion cell. In MBE chamber the base pressure was about 510-10 Torr and with the N2 gas flow of 0.07 standard cubic centimeter per minute (sccm) in the rf plasma source, the pressure during growth was about 1.310-7 Torr. In dcMS and HiPIMS processes, Fe targets (99.95 pure) - 1 inch and 3 inch were used as a source, respectively. In HiPIMS process the peak power was maintained at 26 kW by keeping average power fixed at 300 W, peak voltage 700 V, pulse frequency 75 Hz and pulse duration 150 s. In dcMS process, the sputtering power was fixed at 5 W. The partial gas flow of nitrogen ( = p/(pAr+p), where pAr and p are gas flow of Ar and N2 gases, respectively) was kept at 10 and 23 for dcMS and HiPIMS processes, respectively. A base pressure of 110-7 Torr was achieved before deposition and the working pressure was maintained at 4 mTorr during deposition in both dcMS and HiPIMS processes. The thickness of samples was about 50 nm. An Au layer of thickness around 2 nm was used as a capping layer in MBE grown film.
The crystal structure and the phase formation of the films were characterized by x-ray diffraction (XRD) using a standard x-ray diffractometer (Bruker D8 Advance) using CuK- x-ray source. Compositional depth profiling was performed using secondary ion mass spectroscopy (SIMS) in a Hiden Analytical SIMS workstation. A primary O2+ ions source was used for sputtering with an energy of 3 keV and beam current of 150 nA. The sputtered secondary ions were detected using a quadrupole mass analyzer. X-ray reflectivity measurements were carried out using using CuK- x-ray source. Bulk magnetization measurements were done using Quantum design SQUID-VSM magnetometer. Polarized neutron reflectivity (PNR) measurements were performed at AMOR, SINQ, PSI Switzerland in time of flight mode using Selene optics on samples deposited using dcMS and HiPIMS. Stahn and Glavic (2016, 2017) PNR measurements on MBE deposited samples were carried out using the MAgnetic Reflectometer with high Incident Angle (MARIA) of the JCNS, Garching, Germany. Mattauch et al. (2018) During PNR measurements, to saturate the sample magnetically, a magnetic field of 0.5 T was applied parallel to the sample surface. X-ray magnetic circular dichroism (XMCD) measurement were carried out at BL-01, Indus 2, RRCAT, India. Phase et al. (2014) The x-ray incidence angle was fixed at 90∘ with respect to the sample surface. Magnetic anisotropy was studied using magneto optical-Kerr effect (MOKE) and Kerr microscopy (Evico Magnetics) equipment.
III Results and Discussion
III.1 Structure and bulk magnetization
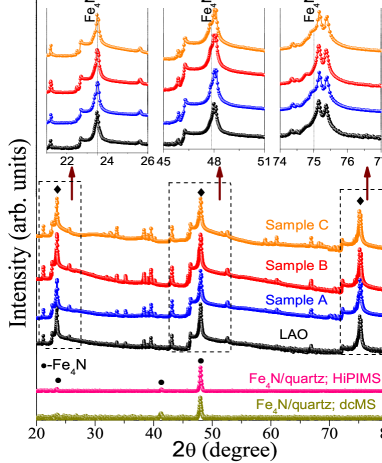
thin film samples grown on LAO(001) substrate are labelled as: dcMS (sample A), HiPIMS (sample B) and MBE (sample C) and their XRD patterns are shown in fig. 1 (a). For reference, XRD patterns of two polycrystalline films deposited along with the above mentioned samples (grown on amorphous quartz substrate using dcMS and HiPIMS) and a bare LAO substrate are also included in fig. 1 (a). Polycrystalline samples demonstrated solely three peaks associated to (100), (111) and (200) planes of phase. This implies the formation of single phase. In addition, XRD patterns (fig. 1 (a)) of samples grown on the LAO substrate shown only the reflections which are exactly matched with the LAO substrate peaks. This could be understood from the fact that LAO and exhibit 0 lattice mismatching and therefore, discrimination between the peak positions of LAO and is not possible. In order to distinguish the reflection of phase, an enlarged view corresponding to (100), (200) and (300) peaks has been plotted shown in the inset of fig. 1 (a). A shoulder appeared towards lower 2 can be seen in each case confirming the presence of phase. As expected, for higher angle (300) plane, it is considerably noticeable rather than the lower angle planes. Consequently, our XRD results confirms the formation of single phased film well-oriented along the c axis (normal) of the substrate.
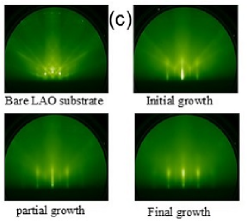
To confirm the epitaxial growth of our film, RHEED images were taken in-situ during the growth of sample C and shown in fig. 1 (b). Here, the RHEED images of a bare LAO substrate taken before and after several deposition times are shown. During growth streaks become visible proving epitaxial growth. As an intensity modulation of the streaks evolves, we conclude that the surface roughness increases due to terraces of discontiguous widths. Lagally et al. (1988) Hereby, the RHEED images confirm the epitaxial nature of our films. Microstructure and surface morphology of these samples were obtained using atomic force microscopy (AFM) measurements shown in the Supplementary Material. Sup From here, it can be seen that HiPIMS grown samples exhibited a denser microstructure and lower roughness.
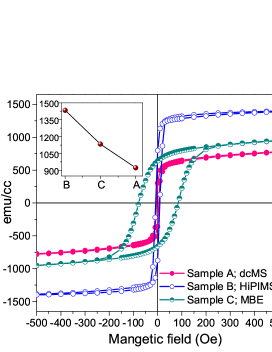
Bulk magnetization measurements were performed on all samples A, B and C and corresponding MH hysteresis loops are shown in fig. 2. The coercivity () of dcMS and HiPIMS samples is 20 Oe but for sample C it is much higher 100 Oe. Such a higher value of for MBE grown sample C may due to presence of different type of interfaces, film-substrate and film-capping layer. This may lead to higher pinning domain resulted in larger . Moreover, even larger difference can be seen in the values of saturation magnetization () for samples A, B and C shown in the inset of fig. 2. is the highest for sample B (HiPIMS) while the lowest for sample A (dcMS). However, even the highest obtained value of 1425 emu/cc for HiPIMS grown sample is still lower than its theoretical value 1690 emu/cc. Blancá et al. (2009)
III.2 Structural and magnetic depth profiles of films
From our XRD measurements, it can be seen that the structure of samples grown using dcMS, HiPIMS and MBE is similar and confirm the epitaxial growth of on LAO substrate. But from our bulk magnetization measurements and CEMS measurements, Sup overall values of are smaller than the theoretically predicted values. Blancá et al. (2009) Differences in values can also be seen in samples prepared using different techniques. In order to understand such variances in , we did elemental and magnetic depth profiling using SIMS and PNR, respectively.
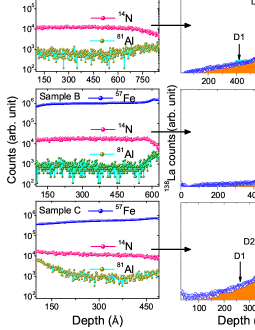
SIMS depth profiles are shown in fig. 3 (a) for samples A, B and C. Here, we can see that the Fe and N profiles demonstrated nearly uniform behavior and an analogous distribution to each other along the depth of the films in the samples A (dcMS) and B (HiPIMS). Whereas, they seem to be skewed in sample C (MBE) near to the surface and interface regions. This reflects that the distribution of Fe and N is more uniform in samples A and B while presence of some concentration gradient in sample C. On the other hand, La depth profiles shown in fig. 3 (b) reveal the mystery. They were deconvoluted assuming two gaussian functions. Here, the component D2 can be directly related to the film-substrate interface region and D1 to an interdiffused region. The value of D2 comes out to be about 20, 7 and 14 nm, for sample A, B and C, respectively reflects the thinnest film-substrate interface in sample B (HiPIMS). These results clearly evident that the La diffuses more into films grown by dcMS and MBE and play a major role in forming a broad interface. Similarly, the D1 contribution is quite profound in sample A and C while and feeble in sample B. Therefore, it appears that La propagated as an impurity into quite substantially in samples A and C but not so much in sample B. Such interdiffusion has been previously probed in SrTiO3/LAO heterostructure and it was found that La forms a broader interface (compared to Al in LAO) and has been described in terms of the stability of LAO compound with oxygen vacancies. Chambers (2011); Kawanowa et al. (2002) Oxygen depletion from LAO induces the Al diffusion into sub surface regions but a change of valency of La from 3+ to 2+ act as a driving force leading to segregation of La to a much larger length scales. Kawanowa et al. (2002)
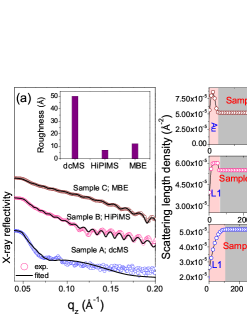
To further confirm SIMS results, depth profiles were also obtained from XRR measurements as shown in fig. 4 (a). Fitting of XRR data were performed (using Parraatt32 Braun (7 99)) considering a three layer model -(i) L1- surface region (ii) L2- bulk of film and (iii) L3- film-substrate interface. As shown in fig. 4 (b), the width of L3 is substantially small in HiPIMS grown sample B as compared to samples A and C. This behavior is in agreement with SIMS depth profiling results and the width of the interface is also similar. As discussed before, such variations can be understood due to larger La interdiffusion when the microstructure is porous in dcMS and MBE grown samples but due to denser microstructure, La diffusion gets suppressed leading to sharper interface in HiPIMS grown sample. In addition, it can be seen that surface roughness of dcMS grown sample is much higher in agreement with AFM results shown in Supplementary Material. Sup
The consequence of such film-substrate interface is also expected to affect the magnetization behavior. Since the width of this interface was lowest in HiPIMS grown sample, the value of magnetization was largest. However, from bulk magnetization measurements, contributions from interface layer can not be separated. Therefore, we did PNR measurements in samples A, B and C. It is well-known that the magnetic depth profile can be uniquely obtained from PNR measurements but it was surprising to note that they have not been performed in thin films before. Fig. 5 (a) shows the PNR patterns for samples A, B and C and they were fitted using GenX software. Björck and Andersson (2007) It is known that the splitting between spin up (R+) and down (R-) neutron reflectivities near critical angle () is proportional to the magnetization of the sample, given by: Blundell and Bland
| (1) |
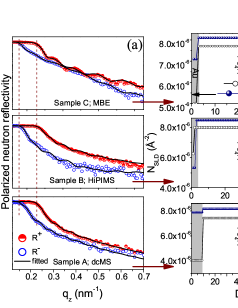
where, is the number density, and are the nuclear and magnetic scattering lengths for neutrons. We can see that at the separation between R+ and R- is somewhat larger in sample B, indicating higher in this sample. Taking inputs from SIMS and XRR measurements, we again used a three layer model described above and we can see that a film-substrate interface of similar thickness was present in all three samples. From the fitting of PNR data, we found that this interface layer is magnetically dead as shown in fig. 5 (b). The extent of this layer was about 20, 7 and 15 nm in dcMS, HiPIMS and MBE grown samples, respectively. For the layer (excluding surface and interface) obtained values of = 1.8, 2.4 and 2.1 ( 0.05) /Fe for sample A, B and C, respectively. This difference in values of is in agreement with bulk magnetization results. This value of matches well with the theoretical value in sample B (see table 1) but smaller values in sample A and C can be understood due to the presence of La impurity. Clearly, the microstructure and La diffusion affects in thin films. As can be seen from SIMS depth profiles, La diffusion can prolong to a much larger length scale and thereby affects the . Since in HiPIMS grown film the La diffusion could be suppressed due to a denser microstructure, the value of reaches to the theoretical predicted value of 2.45 /Fe. Blancá et al. (2009) Obtained results can be applied to understand very large differences in the magnetization of films studied in the literature as shown in table 1. It can be anticipated that interdiffusion can also take place from other substrates e.g. Si, SrTiO3 and MgO into (or any other film) and in this situation the randomly generated interface may lead to the randomness in the values of that can be seen in films grown in different works. Ito et al. (2011); Costa-Krämer et al. (2004); Atiq et al. (2008); Feng-Xian et al. (2015); Loloee et al. (2003); Na et al. (2015); Dirba et al. (2015)
III.3 Elemental-specific magnetization
Theoretical calculations suggest a small but oppositely aligned moment at the N site in . The origin of such magnetic moment was explained in terms of the extension of spin-down electron wave function near the interstitial region using spin-density plots located within the muffin-tin spheres. Sifkovits et al. (1999b); Coey (2010); Scheunert et al. (2016) However, to the best of our knowledge, experimentally the magnetic moment at the N site has only been studied by Ito using XMCD measurements, Ito et al. (2015) but there also a large discrepancy can be seen between the theoretically simulated and experimentally observed N -edge spectra. Ito et al. (2015) In the present case, as we have shown that the sample grown using HiPIMS was superior and it will be interesting to inspect the electronic and magnetic behavior at Fe and N sites.
| Sample | mS | mL | mtot | mL/mS |
|---|---|---|---|---|
| /Fe | ||||
| 0.1 | 0.05 | |||
| A | 1.56 | 0.07 | 1.64 | 0.046 |
| B | 2.23 | 0.13 | 2.36 | 0.058 |
| C | 1.86 | 0.07 | 1.92 | 0.042 |
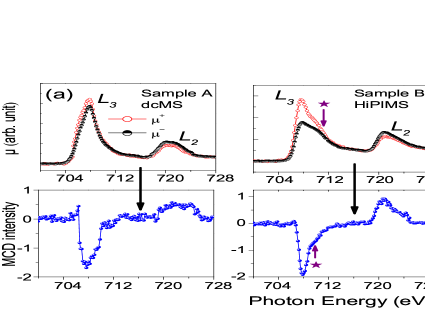
We performed, XAS and XMCD measurements at Fe -edges at 300 K under UHV conditions by switching the applied external magnetic field 0.5 T ( and ) along the direction of propagation of x-ray beam leaving the x-ray helicity unchanged. They are shown in fig. 6 (a), here edges appearing at photon energies of about 707 and 720 eV can be seen and assigned to Fe and , respectively. A shoulder (denoted by ) can also be seen about 3 eV above the edge and it is more clearly pronounced in sample B grown using HiPIMS. It may be noted here that such shoulder has been observed in some metallic ferromagnetic systems and has been explained in terms of unoccupied single-particle density of states. Ito et al. (2015) Here, this feature () can be attributed to the dipole transition from the Fe 2p core-level to the hybridized state between Fe (II) sites Sup and N 2p orbitals. Takagi et al. (2010); Ito et al. (2011, 2015) Since, this feature () is noticeable only in sample B, it indicates that the HiPIMS grown sample has more localized states which could be due to better quality film. Distinct MCD spectra were observed at Fe -edges in all samples. Spin and orbital magnetic moments of samples A, B and C were deduced by applying sum-rules analysis. The pre and post-edge background correction was applied using Athena software. Ravel and Newville (2005) Transitions to the continuum states were removed by subtracting the XAS average data using two step arc tangent function.
It is known that, in sum-rules analysis, the magnetic moment is proportional to the number of holes (). In the present case, we used = 3.88. This value was derived by Takagi Takagi et al. (2010) for in-situ grown thin films on a Cu substrate. Obtained values of spin (mS), orbital (mL) and total magnetic moments (mtot) are shown in table. 2 along with the gyromagnetic ratio (mL/mS) for samples A, B and C. Our values of mL/mS matched well with the previously found values. Takagi et al. (2010); Ito et al. (2011, 2015) Here, the lowest values of total magnetic moments including orbital and spin magnetic moments are found for the sample A (dcMS) while the highest for sample B (HiPIMS), in agreement with bulk and PNR measurements.
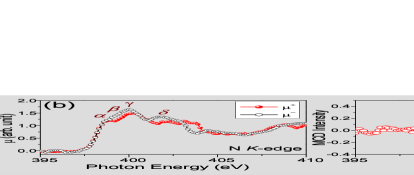
We also did N -edge XAS and XMCD measurements in sample B (HiPIMS) as shown in fig. 6 (b). Here, mainly four features can be seen and they are assigned as , , and . The feature is attributed to the dipole transition from the N 1s to anti-bonding states and features and are explained by anti-bonding states of N 2p and Fe 3d. Ito et al. (2011, 2015) Moreover, distinct XMCD spectrum is observed at N -edge confirms that N 2p orbital of is spin-polarized. It is also interesting to note that the and intensities get reversed compared to Fe -edge XMCD signal. This can be manifested considering an oppositely aligned (negative) moment at the N site as compared to Fe as predicted theoretically. Sifkovits et al. (1999b); Coey (2010); Scheunert et al. (2016) Also, our N -edge XMCD spectra is well consistent with the theoretically simulated spectra of Ito . Ito et al. (2011)
III.4 Magnetic anisotropy
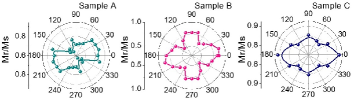
We did longitudinal MOKE measurements to study magnetic anisotropy (MA) and polar plots of reduced remanence (Mr/; here Mr and is the remanence and saturation magnetization) are shown in fig. 7. As can seen there, MA appears different in these three samples. Only sample B (HiPIMS) demonstrated a biaxial MA that is generally expected in cubic symmetry. Around the easy magnetization axes (100) the reduced remanence is highest close to 1(0.85) and around to the hard magnetization axes (110) it is close to cos 45 0.52. In addition, very weak biaxial MA can be seen for sample C. On contrary, sample A exhibited a small uniaxial MA. Unusual behavior of MA found in samples A and C may be due to the significant diffusion of La from the substrate to the film or due to substrate induce effect. Here also, a discrepancy in the MA is clearly evident similar to the magnetization of samples A, B and C. However, the detailed investigation of such MA behavior needs to be further explored.
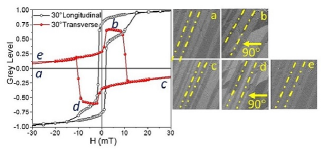
As biaxial MA can only be seen in sample B, the magnetization reversal by 90∘ domain is expected to appear in this sample. Therefore, Kerr images were captured between easy and hard axes for an applied field angle of 30∘ in transverse direction. MH hysteresis loop of longitudinal and transverse directions for applied field angle of 30∘ are shown in the fig. 8. Images were captured for the transversal MH loop at points , , and . The cusp at points and in both longitudinal and transversal directions reflected the 90∘ domain wall driven transition. 180∘ magnetization reversal can be clearly seen from the image to followed by two consecutive 90∘ domain wall nucleation in image and (shown by arrow 90∘). However, stripe type domains called as lamellar pattern can be seen in all images (shown by dashed lines in all images). Such lamellar pattern domains originate as ferroelastic domain arising due to occurrence of twin structures in LAO. Hussain et al. (2019)
IV Conclusion
In conclusion, we made an attempt to resolve the anomaly about values of thin films reported so far. In this view, we have grown epitaxial thin films on LAO substrate by utilizing three different processes dcMS, MBE and HiPIMS and investigated their structural and magnetic properties. of these samples were measured using bulk magnetization, XMCD and PNR measurements. Surprisingly, different values were found for all samples. However, the highest value of was achieved for HiPIMS grown sample. In order to probe the causes for the discrepancies in the values, the detailed depth profiling and microstructure were examined. A densely packed microstructure was found for HiPIMS case. Whereas, a broad film-substrate interfaces were observed in the samples grown by MBE and dcMS compared to the HiPIMS grown sample. The results obtained in this work directly signifies that the denser microstructure may prohibits the La diffusion inside the film resulting in a narrower film-substrate interface. Our SIMS results elucidate that the in highly influenced by the La diffusion. Due to denser microstructure and low film-substrate interaction in the HiPIMS grown sample, a small magnetic moment at N atom was uniquely probed by element-specific XMCD technique. In addition, the magnetic anisotropy behavior was also found to be different in all samples. Four-fold magnetic anisotropy expected for cubic symmetry was only observed for HiPIMS grown sample. However, the origin of different kinds of magnetic anisotropy requires a detailed investigation.
Acknowledgments
NP is thankful to Council of Scientific Industrial Research (CSIR) for senior research fellowship. Authors thank the Department of Science and Technology, India (SR/NM/Z-07/2015) for the financial support and Jawaharlal Nehru Centre for Advanced Scientific Research (JNCASR) for managing the project. A part of this work was performed at AMOR, Swiss Spallation Neutron Source, Paul Scherrer Institute, Villigen, Switzerland. We acknowledge Zaineb Hussain for fruitful discussion about MOKE measurements. We acknowledge help received from L. Behera in sample preparation and various measurements. We are thankful to V. Ganesan and M. Gangrade for AFM measurements, R.J. Choudhary for S-VSM measurements, R. Sah and A. Wadikar for XMCD measurements.
References
References
- Ji et al. (2001) Y. Ji, G. Strijkers, F. Yang, C. Chien, J. Byers, A. Anguelouch, G. Xiao, and A. Gupta, Physical Review Letters 86, 5585 (2001).
- Vahidi et al. (2014) M. Vahidi, J. Gifford, S. Zhang, S. Krishnamurthy, Z. Yu, L. Yu, M. Huang, C. Youngbull, T. Chen, and N. Newman, APL Materials 2, 046108 (2014).
- Kokado et al. (2006) S. Kokado, N. Fujima, K. Harigaya, H. Shimizu, and A. Sakuma, Physical Review B 73, 172410 (2006).
- Meinert (2016) M. Meinert, Journal of Physics: Condensed Matter 28, 056006 (2016).
- Blancá et al. (2009) E. L. P. y. Blancá, J. Desimoni, N. E. Christensen, H. Emmerich, and S. Cottenier, physica status solidi (b) 246, 909 (2009).
- Yin et al. (2016) L. Yin, W. Mi, and X. Wang, Physical Review Applied 6, 064022 (2016).
- Yang et al. (2018) B. Yang, L. Tao, L. Jiang, W. Chen, P. Tang, Y. Yan, and X. Han, Physical Review Applied 9, 054019 (2018).
- Komasaki et al. (2009) Y. Komasaki, M. Tsunoda, S. Isogami, and M. Takahashi, Journal of Applied Physics 105, 07C928 (2009).
- Narahara et al. (2009) A. Narahara, K. Ito, T. Suemasu, Y. Takahashi, A. Ranajikanth, and K. Hono, Applied Physics Letters 94, 202502 (2009).
- Atiq et al. (2008) S. Atiq, H.-S. Ko, S. A. Siddiqi, and S.-C. Shin, Applied Physics Letters 92, 222507 (2008).
- Feng-Xian et al. (2015) J. Feng-Xian, Z. Ye, Z. Guo-Wei, Z. Jun, F. Jiu-Ping, and X. Xiao-Hong, Chinese Physics Letters 32, 087501 (2015).
- Loloee et al. (2003) R. Loloee, K. Nikolaev, and W. Pratt Jr, Applied Physics Letters 82, 3281 (2003).
- Na et al. (2015) Y. Na, C. Wang, J. Xiang, N. Ji, and J. ping Wang, Journal of Crystal Growth 426, 117 (2015).
- Dirba et al. (2015) I. Dirba, M. B. Yazdi, A. Radetinac, P. Komissinskiy, S. Flege, O. Gutfleisch, and L. Alff, Journal of Magnetism and Magnetic Materials 379, 151 (2015).
- Costa-Krämer et al. (2004) J. L. Costa-Krämer, D. Borsa, J. M. García-Martín, M. S. Martín-González, D. Boerma, and F. Briones, Physical Review B 69, 144402 (2004).
- Ito et al. (2011) K. Ito, G. H. Lee, K. Harada, M. Suzuno, T. Suemasu, Y. Takeda, Y. Saitoh, M. Ye, A. Kimura, and H. Akinaga, Applied Physics Letters 98, 102507 (2011).
- Ito et al. (2015) K. Ito, K. Toko, Y. Takeda, Y. Saitoh, T. Oguchi, T. Suemasu, and A. Kimura, Journal of Applied Physics 117, 193906 (2015).
- Anders (2017) A. Anders, Journal of Applied Physics 121, 171101 (2017).
- Gudmundsson et al. (2012) J. Gudmundsson, N. Brenning, D. Lundin, and U. Helmersson, Journal of Vacuum Science & Technology A: Vacuum, Surfaces, and Films 30, 030801 (2012).
- Strijckmans et al. (2017) K. Strijckmans, F. Moens, and D. Depla, Journal of Applied Physics 121, 080901 (2017).
- Nikolaev et al. (2003) K. Nikolaev, I. Krivorotov, E. Dahlberg, V. Vas ko, S. Urazhdin, R. Loloee, and W. Pratt Jr, Applied Physics Letters 82, 4534 (2003).
- Takagi et al. (2010) Y. Takagi, K. Isami, I. Yamamoto, T. Nakagawa, and T. Yokoyama, Physical Review B 81, 035422 (2010).
- Gölden et al. (2017) D. Gölden, E. Hildebrandt, and L. Alff, Journal of Magnetism and Magnetic Materials 422, 407 (2017).
- Li et al. (2018) H. Li, X. Li, D. Kim, G. Zhao, D. Zhang, Z. Diao, T. Chen, and J.-P. Wang, Applied Physics Letters 112, 162407 (2018).
- Sakuma (1991) A. Sakuma, Journal of Magnetism and Magnetic Materials 102, 127 (1991).
- Kuhnen et al. (1992) C. Kuhnen, R. De Figueiredo, V. Drago, and E. Da Silva, Journal of Magnetism and Magnetic Materials 111, 95 (1992).
- Coey et al. (1994) J. Coey, K. O’donnell, Q. Qinian, E. Touchais, and K. Jack, Journal of Physics: Condensed Matter 6, L23 (1994).
- Coehoorn et al. (1993) R. Coehoorn, G. Daalderop, and H. Jansen, Physical Review B 48, 3830 (1993).
- Mohn and Matar (1999) P. Mohn and S. Matar, Journal of Magnetism and Magnetic Materials 191, 234 (1999).
- Sifkovits et al. (1999a) M. Sifkovits, H. Smolinski, S. Hellwig, and W. Weber, Journal of Magnetism and Magnetic Materials 204, 191 (1999a).
- Houari et al. (2010) A. Houari, S. F. Matar, and M. A. Belkhir, Journal of Magnetism and Magnetic Materials 322, 658 (2010).
- Stahn and Glavic (2016) J. Stahn and A. Glavic, Nuclear Instruments and Methods in Physics Research Section A: Accelerators, Spectrometers, Detectors and Associated Equipment 821, 44 (2016).
- Stahn and Glavic (2017) J. Stahn and A. Glavic, in Journal of Physics: Conference Series, Vol. 862 (IOP Publishing, 2017) p. 012007.
- Mattauch et al. (2018) S. Mattauch, A. Koutsioubas, U. Rücker, D. Korolkov, V. Fracassi, J. Daemen, R. Schmitz, K. Bussmann, F. Suxdorf, M. Wagener, et al., Journal of applied crystallography 51 (2018).
- Phase et al. (2014) D. M. Phase, M. Gupta, S. Potdar, L. Behera, R. Sah, and A. Gupta, AIP Conference Proceedings 1591, 685 (2014).
- Lagally et al. (1988) M. Lagally, D. Savage, and M. Tringides, in Reflection high-energy electron diffraction and reflection electron imaging of surfaces (Springer, 1988) pp. 139–174.
- (37) See Supplemental Material at , for describing the morphology, microstrcutre, growth mode and site-specific information of Fe4N thin films.
- Chambers (2011) S. A. Chambers, Surface Science 605, 1133 (2011).
- Kawanowa et al. (2002) H. Kawanowa, H. Ozawa, M. Ohtsuki, Y. Gotoh, and R. Souda, Surface Science 506, 87 (2002).
- Braun (7 99) C. Braun, Parratt32- The Reflectivity Tool (HMI Berlin, 1997-99).
- Björck and Andersson (2007) M. Björck and G. Andersson, Journal of Applied Crystallography 40, 1174 (2007).
- (42) S. Blundell and J. Bland, Physical Review B 46.
- Sifkovits et al. (1999b) M. Sifkovits, H. Smolinski, S. Hellwig, and W. Weber, Journal of Magnetism and Magnetic Materials 204, 191 (1999b).
- Coey (2010) J. M. Coey, Magnetism and Magnetic Materials (Cambridge university press, 2010).
- Scheunert et al. (2016) G. Scheunert, O. Heinonen, R. Hardeman, A. Lapicki, M. Gubbins, and R. Bowman, Applied Physics Reviews 3, 011301 (2016).
- Ravel and Newville (2005) B. Ravel and M. Newville, Journal of Synchrotron Radiation 12, 537 (2005).
- Hussain et al. (2019) Z. Hussain, D. Kumar, and V. R. Reddy, Journal of Magnetism and Magnetic Materials (2019).