Handling Divergent Reference Texts when Evaluating
Table-to-Text Generation
Abstract
Automatically constructed datasets for generating text from semi-structured data (tables), such as WikiBio (Lebret et al., 2016), often contain reference texts that diverge from the information in the corresponding semi-structured data. We show that metrics which rely solely on the reference texts, such as BLEU and ROUGE, show poor correlation with human judgments when those references diverge. We propose a new metric, PARENT, which aligns n-grams from the reference and generated texts to the semi-structured data before computing their precision and recall. Through a large scale human evaluation study of table-to-text models for WikiBio, we show that PARENT correlates with human judgments better than existing text generation metrics. We also adapt and evaluate the information extraction based evaluation proposed in Wiseman et al. (2017), and show that PARENT has comparable correlation to it, while being easier to use. We show that PARENT is also applicable when the reference texts are elicited from humans using the data from the WebNLG challenge.111Code and Data: http://www.cs.cmu.edu/~bdhingra/pages/parent.html
1 Introduction
The task of generating natural language descriptions of structured data (such as tables) Kukich (1983); McKeown (1985); Reiter and Dale (1997) has seen a growth in interest with the rise of sequence to sequence models that provide an easy way of encoding tables and generating text from them (Lebret et al., 2016; Wiseman et al., 2017; Novikova et al., 2017b; Gardent et al., 2017).
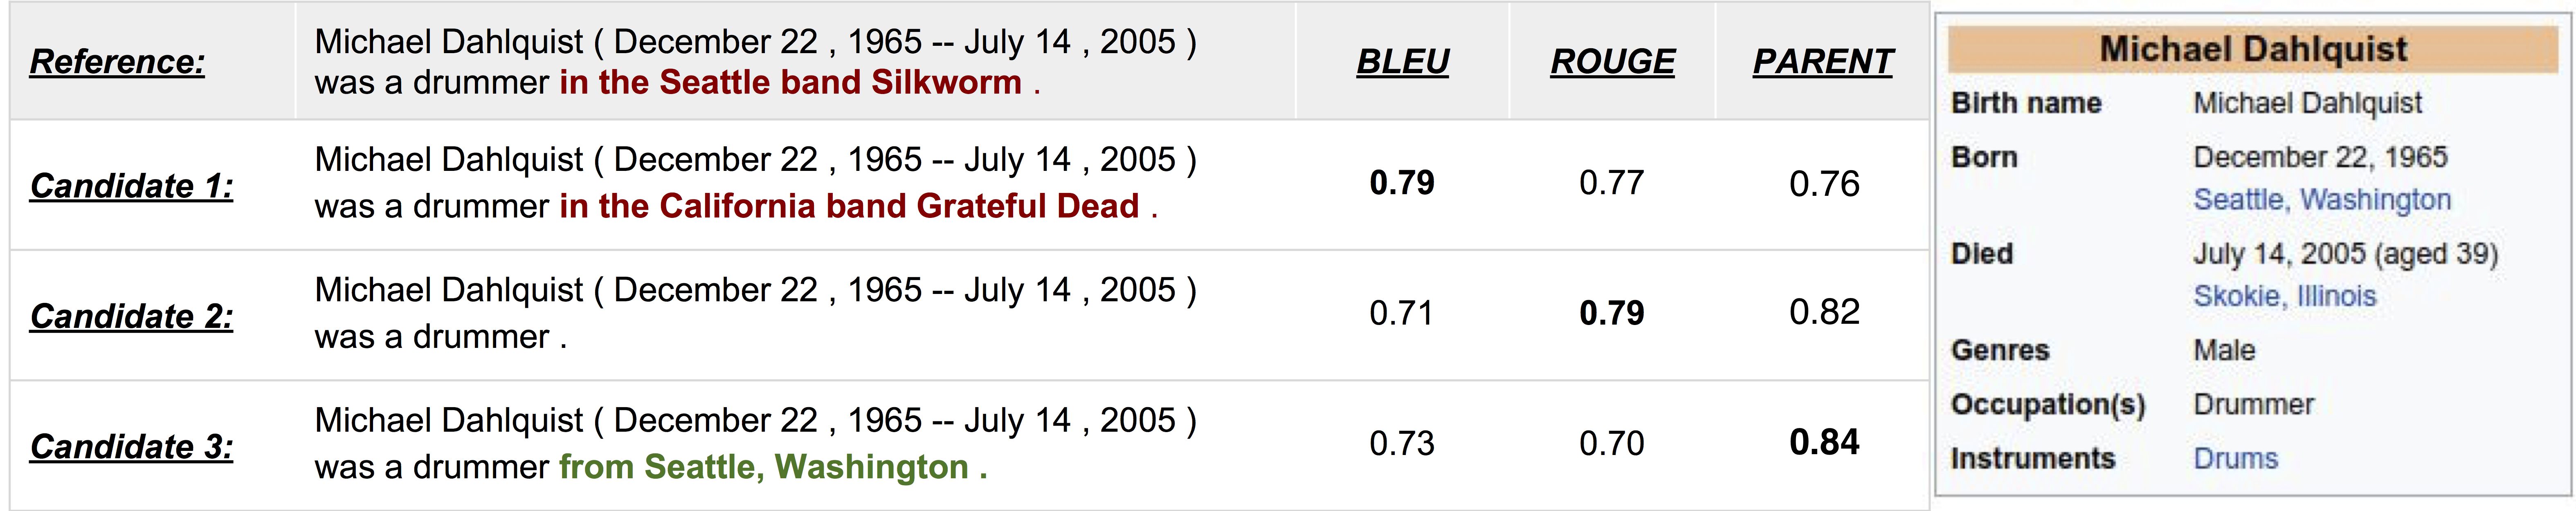
For text generation tasks, the only gold standard metric is to show the output to humans for judging its quality, but this is too expensive to apply repeatedly anytime small modifications are made to a system. Hence, automatic metrics that compare the generated text to one or more reference texts are routinely used to compare models (Bangalore et al., 2000). For table-to-text generation, automatic evaluation has largely relied on BLEU (Papineni et al., 2002) and ROUGE (Lin, 2004). The underlying assumption behind these metrics is that the reference text is gold-standard, i.e., it is the ideal target text that a system should generate. In practice, however, when datasets are collected automatically and heuristically, the reference texts are often not ideal. Figure 1 shows an example from the WikiBio dataset (Lebret et al., 2016). Here the reference contains extra information which no system can be expected to produce given only the associated table. We call such reference texts divergent from the table.
We show that existing automatic metrics, including BLEU, correlate poorly with human judgments when the evaluation sets contain divergent references (§5.4). For many table-to-text generation tasks, the tables themselves are in a pseudo-natural language format (e.g., WikiBio, WebNLG (Gardent et al., 2017), and E2E-NLG (Dušek et al., 2019)). In such cases we propose to compare the generated text to the underlying table as well to improve evaluation. We develop a new metric, PARENT (Precision And Recall of Entailed N-grams from the Table) (§3). When computing precision, PARENT effectively uses a union of the reference and the table, to reward correct information missing from the reference. When computing recall, it uses an intersection of the reference and the table, to ignore extra incorrect information in the reference. The union and intersection are computed with the help of an entailment model to decide if a text n-gram is entailed by the table.222Here “entailed” means can be reasonably inferred from the corresponding table. In practice, we use simple lexical entailment models to determine this. We show that this method is more effective than using the table as an additional reference. Our main contributions are:
-
•
We conduct a large-scale human evaluation of the outputs from table-to-text models on examples from the WikiBio dataset, many of which have divergent references (§5.2).
-
•
We propose a new metric, PARENT (§3), and show that it improves correlation with human judgments over existing metrics, both when comparing similar systems (such as different hyperparameters of a neural network) and when comparing vastly different systems (such as template-based and neural models).
- •
-
•
We analyze the sensitivity of the metrics to divergence by collecting labels for which references contain only information also present in the tables. We show that PARENT maintains high correlation as the number of such examples is varied. (§5.5).
- •
2 Table-to-Text Generation
We briefly review the task of generating natural language descriptions of semi-structured data, which we refer to as tables henceforth (Barzilay and Lapata, 2005; Liang et al., 2009). Tables can be expressed as set of records , where each record is a tuple (entity, attribute, value). When all the records are about the same entity, we can truncate the records to (attribute, value) pairs. For example, for the table in Figure 1, the records are {(Birth Name, Michael Dahlquist), (Born, December 22 1965), …}. The task is to generate a text which summarizes the records in a fluent and grammatical manner.333In some cases the system is expected to summarize all the records (e.g. WebNLG); in others the system is expected to only summarize the salient records (e.g. WikiBio). For training and evaluation we further assume that we have a reference description available for each table. We let denote an evaluation set of tables, references and texts generated from a model , and , denote the collection of n-grams of order in and , respectively. We use to denote the count of n-gram in , and to denote the minimum of its counts in and . Our goal is to assign a score to the model, which correlates highly with human judgments of the quality of that model.
Divergent References.
In this paper we are interested in the case where reference texts diverge from the tables. In Figure 1, the reference, though technically correct and fluent, mentions information which cannot be gleaned from the associated table. It also fails to mention useful information which a generation system might correctly include (e.g. candidate in the figure). We call such references divergent from the associated table. This phenomenon is quite common – in WikiBio we found that of the references mention extra information (§5.5). Divergence is common in human-curated translation datasets as well (Carpuat et al., 2017; Vyas et al., 2018).
How does divergence affect automatic evaluation? As a motivating example, consider the three candidate generations shown in Figure 1. Clearly, candidate is the worst since it “hallucinates” false information, and candidate is the best since it is correct and mentions more information than candidate . However, BLEU and ROUGE, which only compare the candidates to the reference, penalize candidate for both excluding the divergent information in the reference (in red) and including correct information from the table (in green).444BLEU is usually computed at the corpus-level, however here we show its value for a single sentence purely for illustration purposes. The remaining BLEU scores in this paper are all at the corpus-level. PARENT, which compares to both the table and reference, correctly ranks the three candidates.
3 PARENT
PARENT evaluates each instance separately, by computing the precision and recall of against both and .
Entailment Probability.
The table is in a semi-structured form, and hence not directly comparable to the unstructured generated or reference texts. To bridge this gap, we introduce the notion of entailment probability, which we define as the probability that the presence of an n-gram in a text is “correct” given the associated table. We denote this probability as . Estimating this probability is in itself a challenging language understanding task, since the information in the table may be expressed in varied forms in text. Here, we describe two simple models of lexical entailment, inspired by work on the Recognizing Textual Entailment Challenge (Dagan et al., 2006). We found these simple models to be effective; while more sophisticated models may be used if there are complex inferences between the table and text, they are beyond the scope of this paper.
-
1.
Word Overlap Model: Let denote all the lexical items present in the table , including both attribute names and their values. Then, , where is the length of , and is the th token in .
-
2.
Co-occurrence Model: (Glickman and Dagan, 2005) Originally proposed for the RTE task, this model computes the probability of a term in the n-gram being entailed by the table as the maximum of its probabilities of being entailed by each lexical item in the table:
(1) is estimated using co-occurrence counts from a training set of table-reference pairs. Then the overall probability of the n-gram being entailed is taken as the geometric average .555Glickman and Dagan (2005) used a product instead of geometric mean. Here we use a geometric mean to ensure that n-grams of different lengths have comparable probabilities of being entailed.
We note that these models are not sensitive to paraphrases between the table and text. For tasks where this is important, embedding-based similarities may be used, but those are beyond the scope of this paper. Next we discuss how to compute the precision and recall of the generation.
Entailed Precision.
When computing precision, we want to check what fraction of the n-grams in are correct. We consider an n-gram to be correct either if it occurs in the reference 666It is unlikely that an automated system produces the same extra n-gram as present in the reference, thus a match with the reference n-gram is considered positive. For example, in Figure 1, it is highly unlikely that a system would produce “Silkworm” when it is not present in the table., or if it has a high probability of being entailed by the table (i.e. is high). Let denote the probability that an n-gram in also appears in . Then, the entailed precision for n-grams of order is given by:
| (2) |
In words, an n-gram receives a reward of if it appears in the reference, with probability , and otherwise it receives a reward of . Both numerator and denominator are weighted by the count of the n-gram in . rewards an n-gram for appearing as many times as it appears in the reference, not more. We combine precisions for n-gram orders - using a geometric average, similar to BLEU:
| (3) |
Entailed Recall.
We compute recall against both the reference (), to ensure proper sentence structure in the generated text, and the table (), to ensure that texts which mention more information from the table get higher scores (e.g. candidate in Figure 1). These are combined using a geometric average:
| (4) |
The parameter trades-off how much the generated text should match the reference, versus how much it should cover information from the table. The geometric average, which acts as an AND operation, ensures that the overall recall is high only when both the components are high. We found this necessary to assign low scores to bad systems which, for example, copy values from the table without phrasing them in natural language.
When computing , divergent references will have n-grams with low . We want to exclude these from the computation of recall, and hence their contributions are weighted by :
| (5) |
Similar to precision, we combine recalls for - using a geometric average to get .
For computing , note that a table is a set of records . For a record , let denote its string value (such as “Michael Dahlquist” or “December 22 1965”). Then:
| (6) |
where denotes the number of tokens in the value string, and is the length of the longest common subsequence between and . The function, borrowed from ROUGE, ensures that entity names in appear in the same order in the text as the table. Higher values of denote that more records are likely to be mentioned in .
The entailed precision and recall are combined into an F-score to give the PARENT metric for one instance. The system-level PARENT score for a model is the average of instance level PARENT scores across the evaluation set:
| (7) |
Smoothing & Multiple References.
The danger with geometric averages is that if any of the components being averaged become , the average will also be . Hence, we adopt a smoothing technique from Chen and Cherry (2014) that assigns a small positive value to any of , and which are . When multiple references are available for a table, we compute PARENT against each reference and take the maximum as its overall score, similar to METEOR (Denkowski and Lavie, 2014).
Choosing and .
To set the value of we can tune it to maximize the correlation of the metric with human judgments, when such data is available. When such data is not available, we can use the recall of the reference against the table, using Eq. 6, as the value of . The intuition here is that if the recall of the reference against the table is high, it already covers most of the information, and we can assign it a high weight in Eq. 4. This leads to a separate value of automatically set for each instance.777For WikiBio, on average using this heuristic. is set to for all experiments.
4 Evaluation via Information Extraction
Wiseman et al. (2017) proposed to use an auxiliary model, trained to extract structured records from text, for evaluation. However, the extraction model presented in that work is limited to the closed-domain setting of basketball game tables and summaries. In particular, they assume that each table has exactly the same set of attributes for each entity, and that the entities can be identified in the text via string matching. These assumptions are not valid for the open-domain WikiBio dataset, and hence we train our own extraction model to replicate their evaluation scheme.
Our extraction system is a pointer-generator network (See et al., 2017), which learns to produce a linearized version of the table from the text.888 All (attribute, value) pairs are merged into long string using special separator tokens between them. The network learns which attributes need to be populated in the output table, along with their values. It is trained on the training set of WikiBio. At test time we parsed the output strings into a set of (attribute, value) tuples and compare it to the ground truth table. The F-score of this text-to-table system was , which is comparable to other challenging open-domain settings (Huang et al., 2017). More details are included in the Appendix A.1.
Given this information extraction system, we consider the following metrics for evaluation, along the lines of Wiseman et al. (2017). Content Selection (CS): F-score for the (attribute, value) pairs extracted from the generated text compared to those extracted from the reference. Relation Generation (RG): Precision for the (attribute, value) pairs extracted from the generated text compared to those in the ground truth table. RG-F: Since our task emphasizes the recall of information from the table as well, we consider another variant which computes the F-score of the extracted pairs to those in the table. We omit the content ordering metric, since our extraction system does not align records to the input text.
5 Experiments & Results
In this section we compare several automatic evaluation metrics by checking their correlation with the scores assigned by humans to table-to-text models. Specifically, given models , and their outputs on an evaluation set, we show these generated texts to humans to judge their quality, and obtain aggregated human evaluation scores for all the models, (§5.2). Next, to evaluate an automatic metric, we compute the scores it assigns to each model, , and check the Pearson correlation between and (Graham and Baldwin, 2014).999We observed similar trends for Spearman correlation.
5.1 Data & Models
Our main experiments are on the WikiBio dataset (Lebret et al., 2016), which is automatically constructed and contains many divergent references. In §5.6 we also present results on the data released as part of the WebNLG challenge.
| Name |
|
|
|
|
||||||||
| References | – | – | – | 0.20 0.03 | ||||||||
| Template | – | – | – | -0.19 0.04 | ||||||||
| Seq2Seq | 1 | 0 | No | -0.28 0.03 | ||||||||
| Seq2Seq + Att | 1 | 0 | No | -0.12 0.03 | ||||||||
| PG-Net | 1,4,8 | 0,1,2,3 | No,Yes | 0.40 0.03 |
We developed several models of varying quality for generating text from the tables in WikiBio. This gives us a diverse set of outputs to evaluate the automatic metrics on. Table 1 lists the models along with their hyperparameter settings and their scores from the human evaluation (§5.2). Our focus is primarily on neural sequence-to-sequence methods since these are most widely used, but we also include a template-based baseline. All neural models were trained on the WikiBio training set. Training details and sample outputs are included in Appendices A.2 & A.3.
We divide these models into two categories and measure correlation separately for both the categories. The first category, WikiBio-Systems, includes one model each from the four families listed in Table 1. This category tests whether a metric can be used to compare different model families with a large variation in the quality of their outputs. The second category, WikiBio-Hyperparams, includes different hyperparameter settings of PG-Net (See et al., 2017), which was the best performing system overall. of these were obtained by varying the beam size and length normalization penalty of the decoder network (Wu et al., 2016), and the remaining were obtained by re-scoring beams of size with the information extraction model described in §4. All the models in this category produce high quality fluent texts, and differ primarily on the quantity and accuracy of the information they express. Here we are testing whether a metric can be used to compare similar systems with a small variation in performance. This is an important use-case as metrics are often used to tune hyperparameters of a model.
5.2 Human Evaluation

We collected human judgments on the quality of the models trained for WikiBio, plus the reference texts. Workers on a crowd-sourcing platform, proficient in English, were shown a table with pairs of generated texts, or a generated text and the reference, and asked to select the one they prefer. Figure 2 shows the instructions they were given. Paired comparisons have been shown to be superior to rating scales for comparing generated texts Callison-Burch et al. (2007). However, for measuring correlation the comparisons need to be aggregated into real-valued scores, , for each of the models. For this, we use Thurstone’s method (Tsukida and Gupta, 2011), which assigns a score to each model based on how many times it was preferred over an alternative.
The data collection was performed separately for models in the WikiBio-Systems and WikiBio-Hyperparams categories. tables were sampled from the development set, and for each table we got different sentence pairs annotated across the two categories, resulting in a total of pairwise comparisons. Each pair was judged by one worker only which means there may be noise at the instance-level, but the aggregated system-level scores had low variance (cf. Table 1). In total around different workers were involved in the annotation. References were also included in the evaluation, and they received a lower score than PG-Net, highlighting the divergence in WikiBio.
5.3 Compared Metrics
Text only: We compare BLEU (Papineni et al., 2002), ROUGE (Lin, 2004), METEOR (Denkowski and Lavie, 2014), CIDEr and CIDEr-D (Vedantam et al., 2015) using their publicly available implementations.
Information Extraction based: We compare the CS, RG and RG-F metrics discussed in §4.
Text & Table: We compare a variant of BLEU, denoted as BLEU-T, where the values from the table are used as additional references. BLEU-T draws inspiration from iBLEU (Sun and Zhou, 2012) but instead rewards n-grams which match the table rather than penalizing them. For PARENT, we compare both the word-overlap model (PARENT-W) and the co-occurrence model (PARENT-C) for determining entailment. We also compare versions where a single is tuned on the entire dataset to maximize correlation with human judgments, denoted as PARENT*-W/C.
5.4 Correlation Comparison
| Metric |
|
|
Average | ||||
|---|---|---|---|---|---|---|---|
| ROUGE | 0.5180.07C,W | -0.5850.15C,W | -0.034 | ||||
| CIDEr | 0.6740.06C,W | -0.5160.15C,W | 0.079 | ||||
| CIDEr-D | 0.6460.06C,W | -0.3720.16C,W | 0.137 | ||||
| METEOR | 0.6970.06C,W | -0.0790.24C,W | 0.309 | ||||
| BLEU | 0.5480.07C,W | 0.4070.15C,W | 0.478 | ||||
| CS | 0.7350.06W | -0.6040.16C,W | 0.066 | ||||
| BLEU-T | 0.6880.11W | 0.5870.14C,W | 0.638 | ||||
| RG | 0.6450.07C,W | 0.7490.12 | 0.697 | ||||
| RG-F | 0.7530.06W | 0.7630.12 | 0.758 | ||||
| PARENT-C | 0.7760.05W | 0.7550.12 | 0.766 | ||||
| PARENT-W | 0.9120.03 | 0.7630.12 | 0.838 | ||||
| PARENT*-C | 0.9760.01 | 0.7930.11 | 0.885 | ||||
| PARENT*-W | 0.9820.01 | 0.8440.10 | 0.913 |
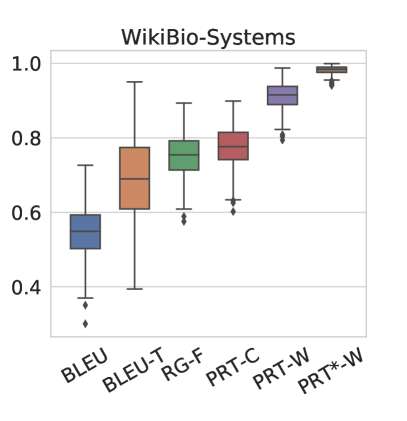
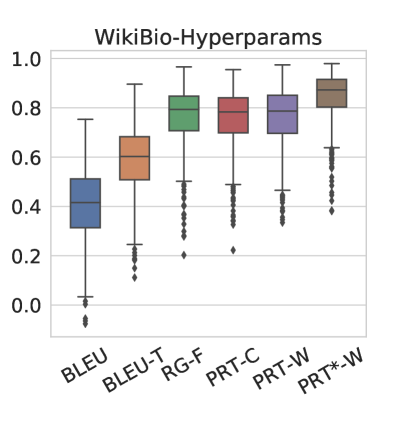
We use bootstrap sampling ( iterations) over the tables for which we collected human annotations to get an idea of how the correlation of each metric varies with the underlying data. In each iteration, we sample with replacement, tables along with their references and all the generated texts for that table. Then we compute aggregated human evaluation and metric scores for each of the models and compute the correlation between the two. We report the average correlation across all bootstrap samples for each metric in Table 2. The distribution of correlations for the best performing metrics are shown in Figure 3.
Table 2 also indicates whether PARENT is significantly better than a baseline metric. Graham and Baldwin (2014) suggest using the William’s test for this purpose, but since we are computing correlations between only / systems at a time, this test has very weak power in our case. Hence, we use the bootstrap samples to obtain a confidence interval of the difference in correlation between PARENT and any other metric and check whether this is above (Wilcox, 2016).
Correlations are higher for the systems category than the hyperparams category. The latter is a more difficult setting since very similar models are compared, and hence the variance of the correlations is also high. Commonly used metrics which only rely on the reference (BLEU, ROUGE, METEOR, CIDEr) have only weak correlations with human judgments. In the hyperparams category, these are often negative, implying that tuning models based on these may lead to selecting worse models. BLEU performs the best among these, and adding n-grams from the table as references improves this further (BLEU-T).
Among the extractive evaluation metrics, CS, which also only relies on the reference, has poor correlation in the hyperparams category. RG-F, and both variants of the PARENT metric achieve the highest correlation for both settings. There is no significant difference among these for the hyperparams category, but for systems, PARENT-W is significantly better than the other two. While RG-F needs a full information extraction pipeline in its implementation, PARENT-C only relies on co-occurrence counts, and PARENT-W can be used out-of-the-box for any dataset. To our knowledge, this is the first rigorous evaluation of using information extraction for generation evaluation.
On this dataset, the word-overlap model showed higher correlation than the co-occurrence model for entailment. In §5.6 we will show that for the WebNLG dataset, where more paraphrasing is involved between the table and text, the opposite is true. Lastly, we note that the heuristic for selecting is sufficient to produce high correlations for PARENT, however, if human annotations are available, this can be tuned to produce significantly higher correlations (PARENT*-W/C).
5.5 Analysis
In this section we further analyze the performance of PARENT-W101010The trends were similar for PARENT-C. under different conditions, and compare to the other best metrics from Table 2.
Effect of Divergence.
To study the correlation as we vary the number of divergent references, we also collected binary labels from workers for whether a reference is entailed by the corresponding table. We define a reference as entailed when it mentions only information which can be inferred from the table. Each table and reference pair was judged by independent workers, and we used the majority vote as the label for that pair. Overall, only of the references were labeled as entailed by the table. Fleiss’ was , which indicates a fair agreement. We found the workers sometimes disagreed on what information can be reasonably entailed by the table.
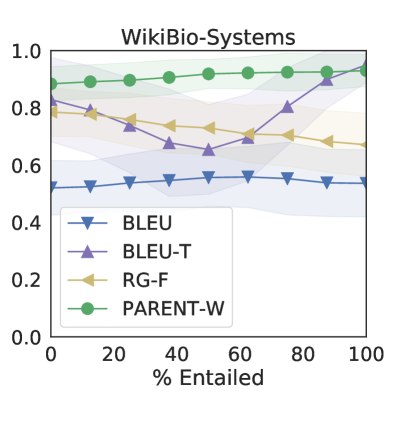
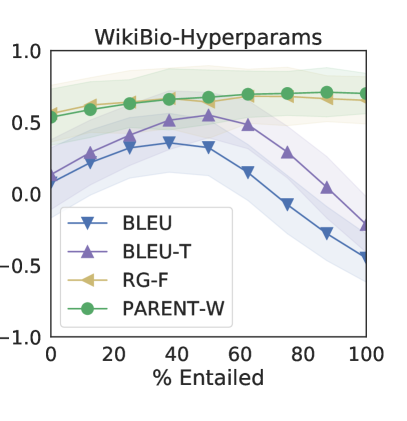
Figure 4 shows the correlations as we vary the percent of entailed examples in the evaluation set of WikiBio. Each point is obtained by fixing the desired proportion of entailed examples, and sampling subsets from the full set which satisfy this proportion. PARENT and RG-F remain stable and show a high correlation across the entire range, whereas BLEU and BLEU-T vary a lot. In the hyperparams category, the latter two have the worst correlation when the evaluation set contains only entailed examples, which may seem surprising. However, on closer examination we found that this subset tends to omit a lot of information from the tables. Systems which produce more information than these references are penalized by BLEU, but not in the human evaluation. PARENT overcomes this issue by measuring recall against the table in addition to the reference.
Ablation Study.
We check how different components in the computation of PARENT contribute to its correlation to human judgments. Specifically, we remove the probability of an n-gram being entailed by the table from Eqs. 2 and 5.111111When computing precision we set , and when computing recall we set for all . The average correlation for PARENT-W drops to in this case. We also try a variant of PARENT with , which removes the contribution of Table Recall (Eq. 4). The average correlation is in this case. With these components, the correlation is , showing that they are crucial to the performance of PARENT.
Sentence Level Discrimination.
Chaganty et al. (2018) point out that hill-climbing on an automatic metric is meaningless if that metric has a low instance-level correlation to human judgments. In Table 3 we show the average accuracy of the metrics in making the same judgments as humans between pairs of generated texts. Both variants of PARENT are significantly better than the other metrics, however the best accuracy is only for the binary task. This is a challenging task, since there are typically only subtle differences between the texts. Achieving higher instance-level accuracies will require more sophisticated language understanding models for evaluation.
| BLEU | BLEU-T | RG-F | PARENT-W | PARENT-C |
|---|---|---|---|---|
| 0.556 | 0.567∗ | 0.588∗ | 0.598‡ | 0.606† |
5.6 WebNLG Dataset
| Metric | Grammar | Fluency | Semantics | Avg |
|---|---|---|---|---|
| METEOR | 0.7880.04 | 0.7920.04 | 0.5760.06 | 0.719 |
| ROUGE | 0.7880.04 | 0.7920.04 | 0.5760.06 | 0.719 |
| CIDEr | 0.8040.03 | 0.7530.04 | 0.8600.02 | 0.806 |
| BLEU | 0.8580.02 | 0.8110.03 | 0.7750.03 | 0.815 |
| BLEU-T | 0.8490.02 | 0.8010.03 | 0.8160.02 | 0.822 |
| CIDErD | 0.8380.04 | 0.7960.04 | 0.8530.02 | 0.829 |
| PARENT-W | 0.8210.03 | 0.7680.04 | 0.8870.02 | 0.825 |
| PARENT-C | 0.8510.03 | 0.8090.04 | 0.8770.02 | 0.846 |
To check how PARENT correlates with human judgments when the references are elicited from humans (and less likely to be divergent), we check its correlation with the human ratings provided for the systems competing in the WebNLG challenge (Gardent et al., 2017). The task is to generate text describing - RDF triples (e.g. John E Blaha, birthPlace, San Antonio), and human ratings were collected for the outputs of participating systems on instances. These systems include a mix of pipelined, statistical and neural methods. Each instance has upto reference texts associated with the RDF triples, which we use for evaluation.
The human ratings were collected on distinct aspects – grammaticality, fluency and semantics, where semantics corresponds to the degree to which a generated text agrees with the meaning of the underlying RDF triples. We report the correlation of several metrics with these ratings in Table 4.121212 We omit extractive evaluation metrics since no extraction systems are publicly available for this dataset, and developing one is beyond the scope of this work. Both variants of PARENT are either competitive or better than the other metrics in terms of the average correlation to all three aspects. This shows that PARENT is applicable for high quality references as well.
While BLEU has the highest correlation for the grammar and fluency aspects, PARENT does best for semantics. This suggests that the inclusion of source tables into the evaluation orients the metric more towards measuring the fidelity of the content of the generation. A similar trend is seen comparing BLEU and BLEU-T. As modern neural text generation systems are typically very fluent, measuring their fidelity is of increasing importance. Between the two entailment models, PARENT-C is better due to its higher correlation with the grammaticality and fluency aspects.
Distribution of .
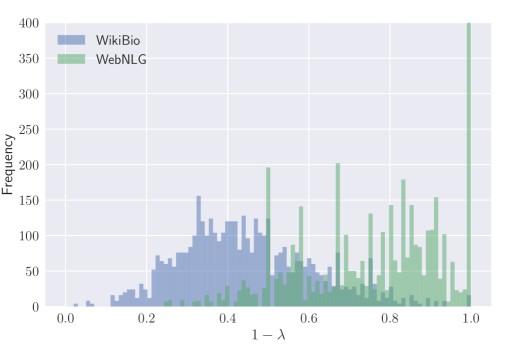
The parameter in the calculation of PARENT decides whether to compute recall against the table or the reference (Eq. 4). Figure 5 shows the distribution of the values taken by using the heuristic described in §3 for instances in both WikiBio and WebNLG. For WikiBio, the recall of the references against the table is generally low, and hence the recall of the generated text relies more on the table. For WebNLG, where the references are elicited from humans, this recall is much higher (often ), and hence the recall of the generated text relies more on the reference.
6 Related Work
Over the years several studies have evaluated automatic metrics for measuring text generation performance (Callison-Burch et al., 2006; Stent et al., 2005; Belz and Reiter, 2006; Reiter, 2018; Liu et al., 2016; Kilickaya et al., 2017; Gatt and Krahmer, 2018). The only consensus from these studies seems to be that no single metric is suitable across all tasks. A recurring theme is that metrics like BLEU and NIST (Doddington, 2002) are not suitable for judging content quality in NLG. Recently, Novikova et al. (2017a) did a comprehensive study of several metrics on the outputs of state-of-the-art NLG systems, and found that while they showed acceptable correlation with human judgments at the system level, they failed to show any correlation at the sentence level. Ours is the first study which checks the quality of metrics when table-to-text references are divergent. We show that in this case even system level correlations can be unreliable.
Hallucination (Rohrbach et al., 2018; Lee et al., 2018) refers to when an NLG system generates text which mentions extra information than what is present in the source from which it is generated. Divergence can be viewed as hallucination in the reference text itself. PARENT deals with hallucination by discounting n-grams which do not overlap with either the reference or the table.
PARENT draws inspiration from iBLEU (Sun and Zhou, 2012), a metric for evaluating paraphrase generation, which compares the generated text to both the source text and the reference. While iBLEU penalizes texts which match the source, here we reward such texts since our task values accuracy of generated text more than the need for paraphrasing the tabular content Liu et al. (2010). Similar to SARI for text simplification (Xu et al., 2016) and Q-BLEU for question generation (Nema and Khapra, 2018), PARENT falls under the category of task-specific metrics.
7 Conclusions
We study the automatic evaluation of table-to-text systems when the references diverge from the table. We propose a new metric, PARENT, which shows the highest correlation with humans across a range of settings with divergent references in WikiBio. We also perform the first empirical evaluation of information extraction based metrics (Wiseman et al., 2017), and find RG-F to be effective. Lastly, we show that PARENT is comparable to the best existing metrics when references are elicited by humans on the WebNLG data.
Acknowledgements
Bhuwan Dhingra is supported by a fellowship from Siemens, and by grants from Google. We thank Maruan Al-Shedivat, Ian Tenney, Tom Kwiatkowski, Michael Collins, Slav Petrov, Jason Baldridge, David Reitter and other members of the Google AI Language team for helpful discussions and suggestions. We thank Sam Wiseman for sharing data for an earlier version of this paper. We also thank the anonymous reviewers for their feedback.
References
- Bangalore et al. (2000) Srinivas Bangalore, Owen Rambow, and Steve Whittaker. 2000. Evaluation metrics for generation. In Proc. of INLG.
- Barzilay and Lapata (2005) Regina Barzilay and Mirella Lapata. 2005. Collective content selection for concept-to-text generation. In Proc. of EMNLP.
- Belz and Reiter (2006) Anja Belz and Ehud Reiter. 2006. Comparing automatic and human evaluation of nlg systems. In Proc. of EACL.
- Callison-Burch et al. (2007) Chris Callison-Burch, Cameron Fordyce, Philipp Koehn, Christof Monz, and Josh Schroeder. 2007. (meta-) evaluation of machine translation. In Proc. of WMT.
- Callison-Burch et al. (2006) Chris Callison-Burch, Miles Osborne, and Philipp Koehn. 2006. Re-evaluation the role of bleu in machine translation research. In Proc. of EACL.
- Carpuat et al. (2017) Marine Carpuat, Yogarshi Vyas, and Xing Niu. 2017. Detecting cross-lingual semantic divergence for neural machine translation. In Proc.of Workshop on NMT.
- Chaganty et al. (2018) Arun Chaganty, Stephen Mussmann, and Percy Liang. 2018. The price of debiasing automatic metrics in natural language evalaution. In Proc. of ACL.
- Chen and Cherry (2014) Boxing Chen and Colin Cherry. 2014. A systematic comparison of smoothing techniques for sentence-level bleu. In Proc. of WMT.
- Dagan et al. (2006) Ido Dagan, Oren Glickman, and Bernardo Magnini. 2006. The pascal recognising textual entailment challenge. In Machine Learning Challenges. Evaluating Predictive Uncertainty, Visual Object Classification, and Recognising Tectual Entailment, pages 177–190, Berlin, Heidelberg. Springer Berlin Heidelberg.
- Denkowski and Lavie (2014) Michael Denkowski and Alon Lavie. 2014. Meteor universal: Language specific translation evaluation for any target language. In Proc. of WMT.
- Doddington (2002) George Doddington. 2002. Automatic evaluation of machine translation quality using n-gram co-occurrence statistics. In Proc. of HLT.
- Dušek et al. (2019) Ondřej Dušek, Jekaterina Novikova, and Verena Rieser. 2019. Evaluating the state-of-the-art of end-to-end natural language generation: The E2E NLG Challenge. arXiv preprint arXiv:1901.11528.
- Gardent et al. (2017) Claire Gardent, Anastasia Shimorina, Shashi Narayan, and Laura Perez-Beltrachini. 2017. Creating training corpora for micro-planners. In Proc. of ACL.
- Gatt and Krahmer (2018) Albert Gatt and Emiel Krahmer. 2018. Survey of the state of the art in natural language generation: Core tasks, applications and evaluation. Journal of Artificial Intelligence Research, 61:65–170.
- Glickman and Dagan (2005) Oren Glickman and Ido Dagan. 2005. A probabilistic setting and lexical cooccurrence model for textual entailment. In Proceedings of the ACL Workshop on Empirical Modeling of Semantic Equivalence and Entailment, pages 43–48. Association for Computational Linguistics.
- Graham and Baldwin (2014) Yvette Graham and Timothy Baldwin. 2014. Testing for significance of increased correlation with human judgment. In Proc. of EMNLP.
- Huang et al. (2017) Lifu Huang, Avirup Sil, Heng Ji, and Radu Florian. 2017. Improving slot filling performance with attentive neural networks on dependency structures.
- Kilickaya et al. (2017) Mert Kilickaya, Aykut Erdem, Nazli Ikizler-Cinbis, and Erkut Erdem. 2017. Re-evaluating automatic metrics for image captioning. In Proc. of EACL.
- Kukich (1983) Karen Kukich. 1983. Design of a knowledge-based report generator. In Proc. of ACL.
- Lebret et al. (2016) Rémi Lebret, David Grangier, and Michael Auli. 2016. Neural text generation from structured data with application to the biography domain. In Proc. of EMNLP.
- Lee et al. (2018) Katherine Lee, Orhan Firat, Ashish Agarwal, Clara Fannjiang, and David Sussillo. 2018. Hallucinations in neural machine translation.
- Liang et al. (2009) Percy Liang, Michael I Jordan, and Dan Klein. 2009. Learning semantic correspondences with less supervision. In Proc. of ACL.
- Lin (2004) Chin-Yew Lin. 2004. Rouge: A package for automatic evaluation of summaries. In Proc. of Workshop on Text Summarization Branches Out.
- Liu et al. (2010) Chang Liu, Daniel Dahlmeier, and Hwee Tou Ng. 2010. PEM: A paraphrase evaluation metric exploiting parallel texts. In Proc. of EMNLP.
- Liu et al. (2016) Chia-Wei Liu, Ryan Lowe, Iulian Serban, Mike Noseworthy, Laurent Charlin, and Joelle Pineau. 2016. How not to evaluate your dialogue system: An empirical study of unsupervised evaluation metrics for dialogue response generation. In Proc. of EMNLP.
- McKeown (1985) Kathleen R. McKeown. 1985. Text Generation: Using Discourse Strategies and Focus Constraints to Generate Natural Language Text. Cambridge University Press, New York, NY, USA.
- Nema and Khapra (2018) Preksha Nema and Mitesh M Khapra. 2018. Towards a better metric for evaluating question generation systems. In Proc. of EMNLP.
- Novikova et al. (2017a) Jekaterina Novikova, Ondřej Dušek, Amanda Cercas Curry, and Verena Rieser. 2017a. Why we need new evaluation metrics for NLG. In Proc. of EMNLP.
- Novikova et al. (2017b) Jekaterina Novikova, Ondřej Dušek, and Verena Rieser. 2017b. The E2E dataset: New challenges for end-to-end generation. In Proc. of SIGDIAL.
- Papineni et al. (2002) Kishore Papineni, Salim Roukos, Todd Ward, and Wei-Jing Zhu. 2002. Bleu: A method for automatic evaluation of machine translation. In Proc. of ACL.
- Pennington et al. (2014) Jeffrey Pennington, Richard Socher, and Christopher Manning. 2014. Glove: Global vectors for word representation. In Proceedings of the 2014 conference on empirical methods in natural language processing (EMNLP), pages 1532–1543.
- Reiter (2018) Ehud Reiter. 2018. A structured review of the validity of bleu. Computational Linguistics, pages 1–12.
- Reiter and Dale (1997) Ehud Reiter and Robert Dale. 1997. Building applied natural language generation systems. Nat. Lang. Eng., 3(1):57–87.
- Rohrbach et al. (2018) Anna Rohrbach, Lisa Anne Hendricks, Kaylee Burns, Trevor Darrell, and Kate Saenko. 2018. Object hallucination in image captioning. EMNLP.
- See et al. (2017) Abigail See, Peter J. Liu, and Christopher D. Manning. 2017. Get to the point: Summarization with pointer-generator networks. In Proc. of ACL.
- Stent et al. (2005) Amanda Stent, Matthew Marge, and Mohit Singhai. 2005. Evaluating evaluation methods for generation in the presence of variation. In Proc. of CICLing.
- Sun and Zhou (2012) Hong Sun and Ming Zhou. 2012. Joint learning of a dual smt system for paraphrase generation. In Proc. of ACL.
- Tsukida and Gupta (2011) Kristi Tsukida and Maya R Gupta. 2011. How to analyze paired comparison data. Technical report, Washington University Seattle Dept of Electrical Engineering.
- Vedantam et al. (2015) Ramakrishna Vedantam, C Lawrence Zitnick, and Devi Parikh. 2015. Cider: Consensus-based image description evaluation. In Proceedings of the IEEE conference on computer vision and pattern recognition, pages 4566–4575.
- Vyas et al. (2018) Yogarshi Vyas, Xing Niu, and Marine Carpuat. 2018. Identifying semantic divergences in parallel text without annotations. In Proc. of NAACL.
- Wilcox (2016) Rand R Wilcox. 2016. Comparing dependent robust correlations. British Journal of Mathematical and Statistical Psychology, 69(3):215–224.
- Wiseman et al. (2017) Sam Wiseman, Stuart M Shieber, and Alexander M Rush. 2017. Challenges in data-to-document generation. In Proc. of EMNLP.
- Wu et al. (2016) Yonghui Wu, Mike Schuster, Zhifeng Chen, Quoc V. Le, Mohammad Norouzi, Wolfgang Macherey, Maxim Krikun, Yuan Cao, Qin Gao, Klaus Macherey, Jeff Klingner, Apurva Shah, Melvin Johnson, Xiaobing Liu, Łukasz Kaiser, Stephan Gouws, Yoshikiyo Kato, Taku Kudo, Hideto Kazawa, Keith Stevens, George Kurian, Nishant Patil, Wei Wang, Cliff Young, Jason Smith, Jason Riesa, Alex Rudnick, Oriol Vinyals, Greg Corrado, Macduff Hughes, and Jeffrey Dean. 2016. Google’s neural machine translation system: Bridging the gap between human and machine translation. CoRR, abs/1609.08144.
- Xu et al. (2016) Wei Xu, Courtney Napoles, Ellie Pavlick, Quanze Chen, and Chris Callison-Burch. 2016. Optimizing statistical machine translation for text simplification. Transactions of the Association for Computational Linguistics, 4:401–415.
Appendix A Appendices
A.1 Information Extraction System
For evaluation via information extraction (Wiseman et al., 2017) we train a model for WikiBio which accepts text as input and generates a table as the output. Tables in WikiBio are open-domain, without any fixed schema for which attributes may be present or absent in an instance. Hence we employ the Pointer-Generator Network (PG-Net) (See et al., 2017) for this purpose. Specifically, we use a sequence-to-sequence model, whose encoder and decoder are both single-layer bi-directional LSTMs. The decoder is augmented with an attention mechanism over the states of the encoder. Further, it also uses a copy mechanism to optionally copy tokens directly from the source text. We do not use the coverage mechanism of See et al. (2017) since that is specific to the task of summarization they study. The decoder is trained to produce a linearized version of the table where the rows and columns are flattened into a sequence, and separate by special tokens. Figure 6 shows an example.
| Text: |
|---|
| michael dahlquist ( december 22 , 1965 – july 14 , 2005 ) |
| was a drummer in the seattle band silkworm . |
| Table: |
| name C michael dahlquist R birth date C 22 |
| december 1965 R birth place C seattle , washington |
| R death date C 14 july 2005 R death |
| place C skokie , illinois R genres C male |
| R occupation(s) C drummer R instrument |
| C drums |
Clearly, since the references are divergent, the model cannot be expected to produce the entire table, and we see some false information being hallucinated after training. Nevertheless, as we show in §5.4, this system can be used for evaluating generated texts. After training, we can parse the output sequence along the special tokens R and C to get a set of (attribute, value) pairs. Table 5 shows the precision, recall and F-score of these extracted pairs against the ground truth tables, where the attributes and values are compared using an exact string match.
| Precision | Recall | F-score |
| 0.428 | 0.310 | 0.351 |
| Reference | vedran nikšić ( born 5 may 1987 in osijek ) is a croatian football striker . [STOP] | ||
|---|---|---|---|
| Prediction | vedran nikšić ( born 5 may 1987 ) is a croatian football forward who is currently a free agent . [STOP] | ||
| Reference |
|
||
| Prediction | adam whitehead ( born 28 march 1980 ) is an english swimmer . [STOP] | ||
| Reference | chris fortier is an american dj and founder of the balance record pool as well as co-founder and owner of fade records . [STOP] | ||
| Prediction | chris fortier ( born in melbourne , florida ) is an american disc jockey and record producer from melbourne , florida . [STOP] | ||
| Reference | pretty balanced was an american band based in columbus , ohio . [STOP] | ||
| Prediction | pretty balanced is an american piano band from columbus , ohio . [STOP] | ||
| Reference |
|
||
| Prediction |
|
A.2 Hyperparameters
After tuning we found the same set of hyperparameters to work well for both the table-to-text PG-Net, and the inverse information extraction PG-Net. The hidden state size of the biLSTMs was set to . The input and output vocabularies were set to most common words in the corpus, with additional special symbols for table attribute names (such as “birth-date”). The embeddings of the tokens in the vocabulary were initialized with Glove (Pennington et al., 2014). Learning rate of was used during training, with the Adam optimizer, and a dropout of was also applied to the outputs of the biLSTM. Models were trained till the loss on the dev set stopped dropping. Maximum length of a decoded text was set to tokens, and that of the tables was set to tokens. Various beam sizes and length normalization penalties were applied for the table-to-text system, which are listed in the main paper. For the information extraction system, we found a beam size of and no length penalty to produce the highest F-score on the dev set.
A.3 Sample Outputs
Table 6 shows some sample references and the corresponding predictions from the best performing model, PG-Net for WikiBio.