A Giant Intragroup Nebula Hosting a Damped Absorber at
Abstract
This paper reports the discovery of spatially-extended line-emitting nebula, reaching to physical kpc (pkpc) from a damped absorber (DLA) at along the sightline toward QSO PKS 1127145 (). This DLA was known to be associated with a galaxy group of dynamical mass , but its physical origin remained ambiguous. New wide-field integral field observations revealed a giant nebula detected in [O II], H, [O III], H, and [N II] emission, with the line-emitting gas following closely the motions of group galaxies. One of the denser streams passes directly in front of the QSO with kinematics consistent with the absorption profiles recorded in the QSO echelle spectra. The emission morphology, kinematics, and line ratios of the nebula suggest that shocks and turbulent mixing layers, produced as a result of stripped gaseous streams moving at supersonic speed across the ambient hot medium, contribute significantly to the ionization of the gas. While the DLA may not be associated with any specific detected member of the group, both the kinematic and dust properties are consistent with the DLA originating in streams of gas stripped from sub- group members at pkpc from the QSO sightline. This study demonstrates that gas stripping in low-mass galaxy groups is effective in releasing metal-enriched gas from star-forming regions, producing absorption systems in QSO spectra, and that combining absorption and emission-line observations provides an exciting new opportunity for studying gas and galaxy co-evolution.
1 Introduction
The diffuse circumgalactic and intergalactic gas beyond visible galaxy disks contains % of all baryons in the universe (e.g., Miralda-Escudé et al. 1996; Fukugita 2004), serving as a reservoir of materials for sustaining the growth of galaxies while maintaining a record of feedback from previous episodes of star formation and active galactic nuclei (AGN) activity. A comprehensive understanding of the origin and evolution of galaxies relies on accurate characterizations of this diffuse gas (e.g., Somerville & Davé 2015). However, direct imaging of the diffuse circumgalactic medium (CGM) around distant galaxies has been challenging (e.g., Fynbo et al. 1999; Christensen et al. 2006; Rauch et al. 2008, 2011, 2013; Steidel et al. 2011; Krogager et al. 2017), because the gas density is typically too low to radiate at sufficiently high intensities (e.g., Cantalupo et al. 2005; Kollmeier et al. 2010) and because the factor of cosmological surface brightness dimming further suppresses the signal. On the other hand, quasar absorption spectroscopy has provided a sensitive probe of tenuous gas based on the absorption features imprinted in the quasar spectra (e.g., Rauch 1998; Wolfe et al. 2005; Chen 2017; Tumlinson et al. 2017).
Among different types of QSO absorption-line systems, damped absorbers (DLAs) with neutral hydrogen column density are of particular significance in understanding the complex interface between star formation and the interstellar gas. The high ensures that the gas is neutral which, together with the presence of heavy elements, makes DLAs a promising signpost of distant galaxies. Studies of DLAs not only help characterize the cosmic evolution of neutral gas with time (e.g., Neeleman et al. 2016), but also provide key insights into the interplay between star formation in the interstellar matter (ISM) of distant galaxies and their large-scale neutral gas properties (e.g., Wolfe et al. 2005).
Here we present a unique system, for which newly available wide-field integral field spectroscopic (IFS) data enabled detections of spatially extended line-emitting gas, connected directly to a previously known DLA at . It demonstrates the power of combining emission and absorption measurements, which provides a new and exciting opportunity for studying gas and galaxy co-evolution (cf. Zhang et al. 2018). Throughout the paper, we adopt a standard cosmology, = 0.3 and =0.7 with a Hubble constant .
2 Observations and Data Descriptions
Here we briefly describe available imaging and spectroscopic data for characterizing the DLA and its surrounding gas and galaxy properties.
2.1 Galaxy imaging and spectroscopic data
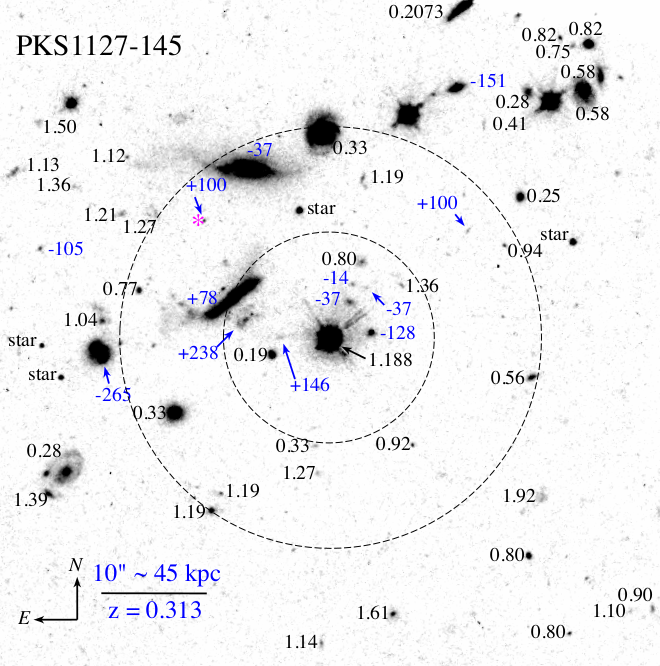
High spatial resolution optical images obtained using the Wide Field and Planetary Camera 2 (WFPC2) and the F814W filter on board the Hubble Space Telescope (HST) were retrieved from the HST data archive (PID9173; PI: Bechtold), and coadded to form a final combined image using custom software. Source detection was performed using the SExtractor program (Bertin & Arnouts 1996). A portion of the combined image, covering the area centered at the QSO, is presented in Figure 1.
Wide-field IFS data of the field around PKS 1127145 were obtained using the Multi-Unit Spectroscopic Explorer (MUSE; Bacon et al. 2010). MUSE observes a field of with a pixel scale of and a spectral resolution of at 7000 Å. The observations were obtained under PID096.A-0303 (PI: Péroux), with a total integration of 8700 seconds and a mean seeing condition of . Pipeline-processed and flux-calibrated individual data cubes were downloaded from ESO Phase 3 data archive. The individual data cubes were combined using custom software with optimal weights determined based on the inverse variance of the sky and with the world coordinates calibrated to match the HST WFPC2 image. The wavelength array was converted to vacuum. Finally, a median sky spectrum was formed using spaxels in blank areas and subtracted from the final combined data cube to reduce sky residuals.
The combined MUSE data cube reaches a 1- limiting sensitivity over a box of at 4900 Å and 8600 Å, and at 6600 Å. It enables a highly complete spectroscopic survey of faint galaxies in the QSO field, including those in the vicinity of the DLA at . We extracted object spectra from the final MUSE data cube using a circular aperture of two pixels () in radius. Redshift measurements were based on a fitting routine described in Chen & Mulchaey (2009) and Johnson et al. (2013). The best-fit redshift of each object was visually inspected for confirmation. This exercise led to robust redshift measurements of 63 objects, 13 of which are found within of the DLA. The redshift measurements are presented in Figure 1. To avoid crowding, redshifts of galaxies not associated with the DLA are presented to two decimal places. For the galaxies associated with the DLA, the line-of-sight velocity offsets are shown relative to (see below).
2.2 Absorption spectra of the QSO
Absorption spectra of PKS 1127145 were obtained using the Faint Object Spectrograph (FOS) and the low-resolution G160L grating on board HST (PID6577; PI: Rao), the Space Telescope Imaging Spectrograph (STIS) and the E230M grating (PID9173; PI: Bechtold), and the Ultraviolet and Visual Echelle Spectrograph (UVES; D’Odorico et al. 2000) on the VLT-UT2 telescope under multiple programs (67.A-0567, 69.A-0371, 076.A-086). Details regarding the STIS and UVES data processing are described in Cooksey et al. (2010) and Zahedy et al. (2017), respectively.
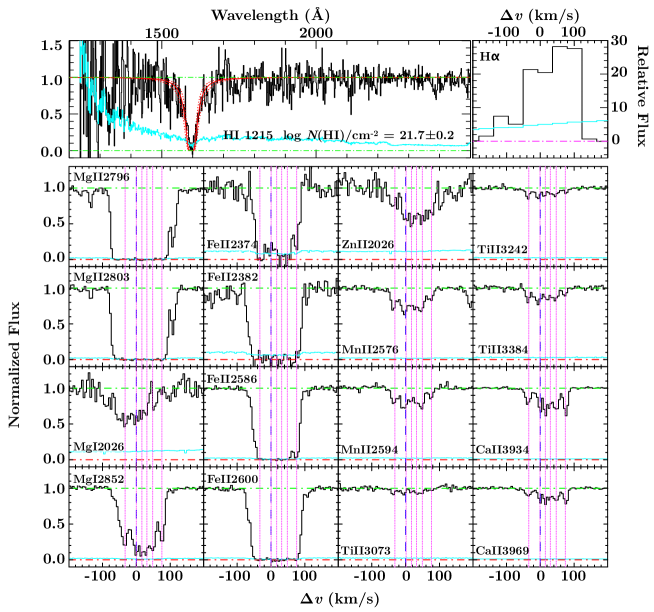
These ultraviolet and optical spectra enabled detailed studies of the chemical and dust content of the DLA (e.g., Kanekar et al. 2014; Guber et al. 2018). In particular, the high-resolution echelle spectra provide the wavelength coverage for observing a suite of heavy ions, including Mg+, Fe+, Mn+, Ti+, and Ca+. A summary of the absorption properties of the DLA is presented in Figure 2. Metal absorption lines, such as Mn II, Ti II, and Ca II, are resolved into at least six individual components. The strongest Mn II component occurs at , which is adopted as the redshift zero point for subsequent discussions. The remaining components are detected at relative line-of-sight velocities, , , , , and (vertical dotted lines in Figure 2).
| ID | (′′) | (′′) | (′′) | (pkpc) | ( ) | (mag) | (mag) | () | Typec | crossIDd | |
| (1) | (2) | (3) | (4) | (5) | (6) | (7) | (8) | (9) | (10) | (11) | (12) |
| J113006.80144926.86 | 0.3121 | 3.8 | 0.4 | 3.8 | 17.4 | 128 | 22.11 | 0.09 | em | G1 | |
| J113006.92144923.96 | 0.3125 | 2.0 | 3.3 | 3.9 | 17.9 | 37 | 22.19 | 0.08 | abs | ||
| J113007.38144927.06 | 0.3133 | 4.6 | 0.2 | 4.6 | 21.3 | 146 | 24.56 | 0.01 | em | G16 | |
| J113006.89144922.36 | 0.3126 | 2.5 | 4.9 | 5.5 | 25.3 | 14 | 23.88 | 0.02 | em | ||
| J113006.82144922.63 | 0.3125 | 3.5 | 4.7 | 5.8 | 26.7 | 37 | 24.67 | 0.01 | em | G18 | |
| J113007.61144925.49 | 0.3137 | 8.0 | 1.8 | 8.2 | 37.5 | 238 | 21.79 | 0.12 | em | G17 | |
| J113007.68144923.29 | 0.3130 | 9.0 | 4.0 | 9.8 | 45.1 | 78 | 19.24 | 1.24 | em | G2 | |
| J113007.86144916.36 | 0.3131 | 11.6 | 10.9 | 15.9 | 73.1 | 100 | 25.18 | 0.01 | em | ||
| J113006.16144917.16 | 0.3131 | 13.1 | 10.1 | 16.5 | 75.8 | 100 | 25.15 | 0.01 | em | ||
| J113007.58144911.01 | 0.3125 | 7.5 | 16.3 | 17.9 | 82.2 | 37 | 18.95 | 1.62 | LINER | G4 | |
| J113008.55144928.26 | 0.3115 | 21.6 | 1.0 | 21.6 | 98.8 | 265 | 20.20 | 0.51 | em | G6 | |
| J113006.23144903.80 | 0.3120 | 12.0 | 23.5 | 26.4 | 120.8 | 151 | 21.32 | 0.18 | em | G19 | |
| J113008.92144918.30 | 0.3122 | 27.0 | 9.0 | 28.4 | 130.1 | 105 | 24.51 | 0.01 | em | G21 | |
| J113010.32144904.34 | 0.3124e | 47.3 | 23.0 | 52.5 | 240.6 | 59 | 20.42 | 0.42 | em | G14 | |
| a corresponds to , the strongest absorbing component in Figure 2. | |||||||||||
| bWe adopt a characteristic rest-frame absolute -band magnitude of from Cool et al. (2012). | |||||||||||
| cSpectral type of the galaxy: emission-line (’em’), absorption (’abs’), or LINER dominated. | |||||||||||
| dGalaxy ID’s from Kacprzak et al. (2010) and Péroux et al. (2019). | |||||||||||
| eThis galaxy occurs outside the MUSE field of view. Redshift is taken from Kacprzak et al. (2010). | |||||||||||
3 The Galactic Environment of the DLA at
The MUSE observations described in § 2.1 have yielded a total of 13 galaxies in the vicinity of the DLA at toward PKS 1127145 (cf. Péroux et al. 2019), with redshifts ranging from to and physical projected distances from pkpc to pkpc. Including the galaxy found at and kpc by Kacprzak et al. (2010), we establish a total of 14 galaxies associated with the DLA, four of which are new from this work (cf. Kacprzak et al. 2010; Péroux et al. 2019). Table 1 presents a complete list of galaxies spectroscopically identified in the vicinity of the DLA. In columns (1) through (11), we present the galaxy ID based on their J2000 coordinates, best-fit redshift, angular offsets in right ascension and declination (, ) and angular distance () of the galaxy from the background QSO, the projected distance () in physical units from the QSO sightline, the line-of-sight velocity offset from the fiducial redshift (), the observed magnitude, the corresponding rest-frame -band absolute magnitude (), the intrinsic luminosity in units of , and cross-reference ID from Kacprzak et al. (2010) and Péroux et al. (2019)111Note that G20 was identified by Péroux et al. 2019 as a group member based on the absorption features, but we find it to be a star..
The galaxy group in the vicinity of the DLA spans a range in the optical brightness, from to mag. At , the observed F814W band corresponds to the rest-frame -band. The observed brightnesses therefore translate directly to the rest-frame -band luminosities. Adopting the characteristic rest-frame absolute -band magnitude of for blue galaxies from Cool et al. (2012), the corresponding rest-frame luminosities range from to (see also Kacprzak et al. 2010; Péroux et al. 2019). In addition, the observed line-of-sight velocity offsets of the group members relative to the strongest absorption component at range from to .
We also compute the light-weighted center of the group at (, ) from the QSO (marked by ’*’ in Figure 1), with a corresponding projected distance of pkpc from the DLA. The observed line-of-sight velocity dispersion of among the 14 group members indicates a dynamical group mass of .
The presence of a galaxy group around the DLA complicates common theories of the physical origin of the high-column density gas. With a mean gas metallicity lower in the DLA than in the ISM of luminous group members, previously favored scenarios include low-luminosity dwarf satellites (e.g., York et al. 1986), tidal debris in the group environment (e.g., Kacprzak et al. 2010), and diffuse intragroup medium (e.g., Péroux et al. 2019).
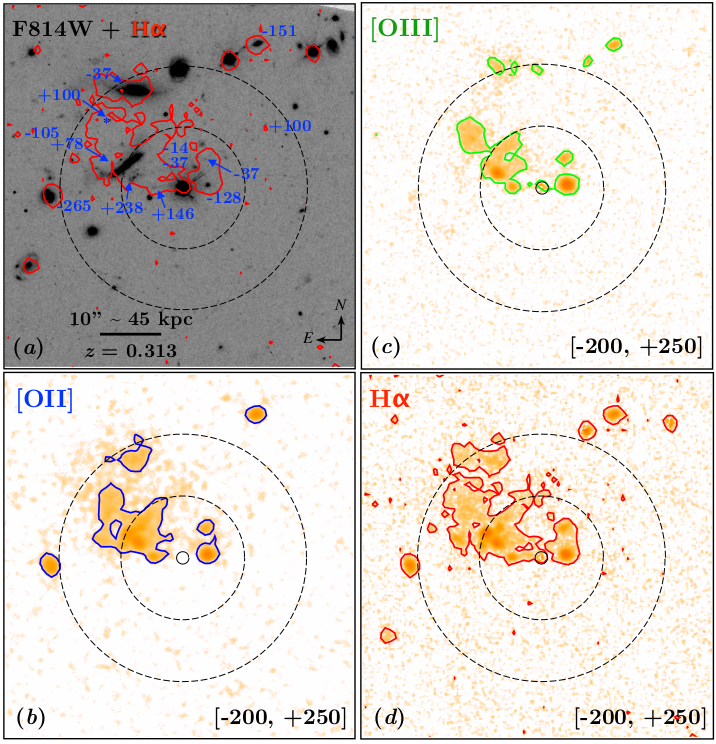
However, in addition to individual galaxies associated with DLA, the MUSE data also uncovered spatially extended line-emitting gas, detected in H, H, [O III], and [O II], across the galaxy group. The emitting morphology is consistent with the gas being stripped from members of the galaxy group, similar to what was found in other group environments (e.g., Epinat et al. 2018; Johnson et al. 2018). One of the denser streams passes directly in front of the QSO with kinematics consistent with the absorption profiles revealed in the QSO echelle spectrum. While the MUSE data do not have the spectral resolution necessary to resolve relative motions under , both the velocity centroid and width of the lines near the QSO sightline agree well with the mean and dispersion of the absorbing components (top-right panel in Figure 2). The imaging panels in Figure 3 compare the spatial distributions of the stellar continuum revealed in the HST F814W image and the line-emitting nebula from the MUSE data. Continuum subtracted line-flux maps of [OII], [O III], and H integrated over a velocity window from to are displayed. The line-emitting gas, detected in multiple transitions, is seen to extend much beyond the stellar disks, reaching to pkpc from the QSO sightline.
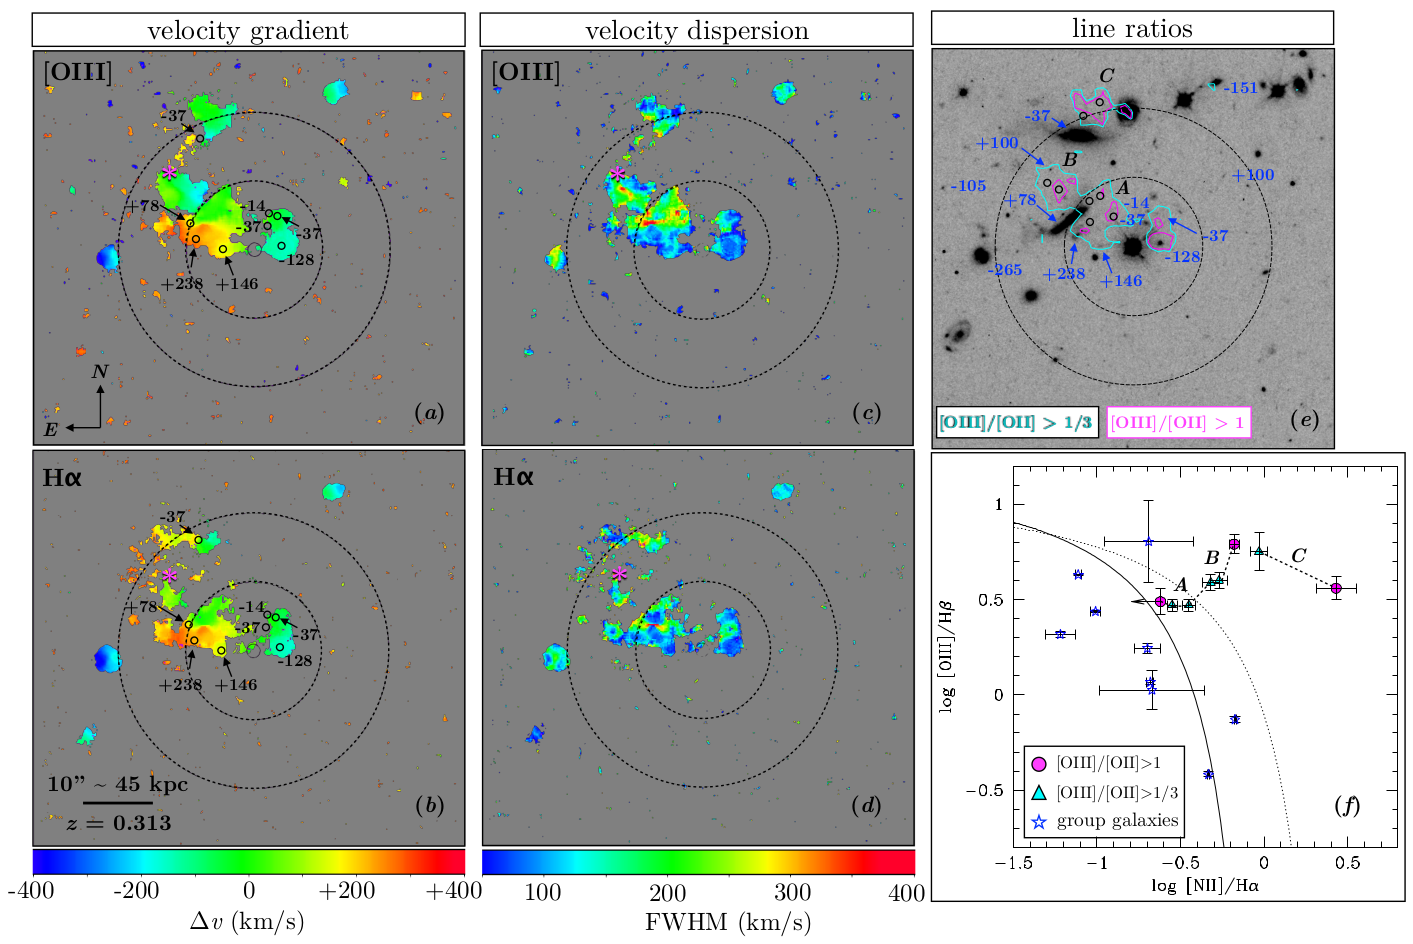
In addition, this extended gas is seen to follow a coherent motion that closely traces the motion of the galaxies in the group, with the intensity peaks moving from west to east of the QSO (left panels of Figure 4). Furthermore, the gas exhibits a broad range in velocity dispersion. The observed large dispersion in [O III], in particular, indicates the presence of turbulent, multiphase intragroup gas (cf. Johnson et al. 2018; see below). We measure a total integrated line flux in H of and in [O III] of .
4 Discussion
Newly available wide-field IFS observations of the field around PKS 1127145 have provided a wealth of information concerning the galactic environment of the DLA at . While this DLA is previously known to be associated with a galaxy group (e.g., Bergeron & Boissé 1991, Chen & Lanzetta 2003; Kacprzak et al. 2010; Péroux et al. 2019), the IFS data have uncovered spatially extended, line-emitting nebula connecting between members of the galaxy group. One of the denser streams passes directly in front of the QSO with kinematics consistent with the absorption profiles revealed in the QSO echelle spectrum, establishing a direct connection between the DLA and the giant nebula.
The MUSE data also allow us to examine the physical condition of the gas based on comparisons of multiple transitions. First, we examine the gas density based on the observed [OII] doublet ratio and the H surface brightness (e.g., Osterbrock & Ferland 2006). The [OII] line is found to be comparable or stronger than the member across the line-emitting nebulae, constraining the electron density at . At the same time, the observed H surface brightness is related to the gas density following,
| (1) |
where represents the clumping factor of the line-emitting gas, represents the mean gas density, and represents the depth of the line-emitting region in units of kpc. Adopting a characteristic surface brightness of from Figure 3 and assuming kpc lead to a crude estimate of gas density of for .
Next, we examine the ionization state of the gas by measuring the [OIII]/[OII] ratio in the nebula. Panel (e) of Figure 4 shows the contours of [OIII]/[OII] (cyan) and 1 (magenta). These contours identify the locations of highly-ionized gas both within 45 pkpc of the DLA and next to the two super- spirals in the group with flared/warped disk morphologies. Because the observed [OIII]/[OII] ratio depends on both the ionization radiation and gas metallicity (e.g., Kewley & Dopita 2002), we also place this gas on the BPT diagram (Baldwin et al. 1981) to examine how the observed [OIII]/H compares with [NII]/H (e.g., Kewley et al. 2013).
Panel (f) of Figure 4 shows line ratios at different locations in the nebula, in comparison to the ISM of the group galaxies222Note that J113007.58144911.01 (G4 in Péroux et al. 2019) at 82 pkpc exhibits a LINER-like [NII]/H but is not detected in H or [OIII], preventing its inclusion in the panel.. Error bars show the 1- measurement uncertainties. While the galaxies appear to be typical of distant star-forming galaxies on the BPT diagram, the observed line ratios of high [OIII]/[OII] regions appear in the parameter space traditionally occupied by active galaxies, indicating the need of a hard ionizing spectrum to account for the ionization condition of the gas (e.g., Kewley et al. 2013). Specifically, the nebula at ( pkpc) from the QSO sightline (regions and in Panel e of Figure 4) appears to be under a more extreme ionizing condition than the gas closer to the QSO sightline.
Possible sources for a hard radiation field include AGN, turbulent mixing layers (e.g., Slavin et al. 1993; Miller & Veilleux 2003), and shocks (e.g., Dopita & Sutherland 1995; Rich et al. 2011). We have searched for signatures of AGN in the group galaxies by examining their optical spectra and WISE photometry (e.g., Wright et al. 2010; Mateos et al. 2013), and found none. The spatial variation of the ionization state of the gas is also inconsistent with fossil ionized regions from a previous AGN outburst. On the other hand, the presence of extended stellar streams from the two super- disk galaxies in the HST image are indicative of ongoing violent galaxy interactions between the group members. For a dynamical mass of , the temperature of the intragroup medium would be K, if present, and the sound speed of the hot halo would be . As galaxies move through this hot intragroup medium, ram-pressure stripping, in addition to tidal interactions between galaxy group members, is expected to be effective in removing the ISM (e.g., Gunn & Gott 1972; Roediger & Brüggen 2007) and shocks and/or turbulent mixing layers should form as stripped gaseous streams travel through the hot gas at supersonic speed. Both the observed line widths seen in [O III] and H (panels c and d) and emission morphologies are consistent with the expectation that the line-emitting gas originates in shocks or turbulent mixing layers. Ram-pressure and tidal stripping are most effective in removing gas in the outskirts of galaxies (e.g., Roediger & Brüggen 2007). Coupled with metallicity gradients commonly seen in galaxy disks (e.g., Bresolin 2017), this naturally explains the low metallicity in the DLA.
In summary, available MUSE data have revealed a complex, multiphase intragroup medium hosting a DLA at . The DLA is not associated with any specific detected member of the group. Both the kinematic and dust properties are consistent with the absorber originating in streams of stripped gas from sub- group members at pkpc from the QSO sightline as a result of violent interactions in the group environment. In contrast, the nebula at pkpc likely originates in the two super- spirals; and its kinematics, line ratios, and morphologies are consistent with being ionized by shocks or turbulent mixing layers. This system demonstrates that metal-enriched gas can be released from star-forming regions into the intragroup medium through effective gas stripping processes in distant low-mass groups, where it produces absorption systems in QSO spectra.
References
- Bacon et al. (2010) Bacon, R., Accardo, M, Adjali, L. et al. 2010, in Ground-based and Airborne Instrumentation for Astronomy III. p. 773508
- Baldwin et al. (1981) Baldwin, J. A., Phillips, M. M., Terlevich, R. (1981), PASP, 93, 5
- Bergeron et al. (1991) Bergeron J., Boissé P., 1991, A&A, 234, 344
- Bertin & Arnouts (1996) Bertin, E., & Arnouts, S. 1996, A&AS, 117, 393
- Bresolin (2017) Bresolin, F. (2017), in Outskirts of Galaxies (eds Knapen,Lee, and Gil de Paz), Astrophysics and Space ScienceLibrary (Springer), vol. 434, 145
- Cantalupo et al. (2005) Cantalupo, S., Porciani, C., Lilly, S. J., & Miniati, F. 2005, ApJ, 628, 61
- Chen et al. (2003) Chen H.-W., Lanzetta K. M., 2003, ApJ, 597, 706
- Chen and Mulchaey (2009) Chen, H.-W. & Mulchaey, J. S. 2009, ApJ, 701, 1219
- Chen (2017) Chen, H.-W. 2017, Outskirts of Galaxies, Astrophysics and Space Science Library, eds. J. H. Knapen, J. C. Lee and A. Gil de Paz, Springer, p. 291
- Christensen et al. (2006) Christensen, L., Wisotzki, L., Roth, M. M., Sánchez, S. F., Kelz, A., Jahnke, K. (2006), A&A, 468, 587
- Cooksey et al. (2010) Cooksey, K. L., Thom, C., Prochaska, J. X., & Chen, H. 2010, ApJ, 708, 868
- Cool et al. (2012) Cool, R. J. et al. 2012, ApJ, 748, 10
- D’Odorico et al. (2000) D’Odorico, S., Cristiani, S., Dekker, H., et al. 2000, Proc. SPIE, 4005, 121
- Dopita (1995) Dopita, M. A. and Sutherland, R. S. (1995), ApJ, 455, 468
- Epinat et al. (2018) Epinat, B., Contini, T., Finley, H., et al. 2018, A&A, 609,A40,
- Fukugita (2004) Fukugita M., 2004, in Ryder S., Pisano D., Walker M., Freeman K., eds.,Proc. IAU Symp. 220, Dark Matter in Galaxies. Astron. Soc. Pac.,San Francisco, p. 227
- Fynbo et al. (1999) Fynbo, J. U., Møller, P., Warren, S. J. (1999), MNRAS, 305, 849
- Gunn and Gott (1972) Gunn, J.-E., Gott, III, J. R. (1972), ApJ, 176, 1
- Guber et al. (2018) Guber C. R., Richter P., Wendt M., 2018, A&Ap, 609, A85
- Johnson et al. (2013) Johnson, S. D., Chen, H.-W., & Mulchaey, J. S. 2013, MNRAS, 434, 1765
- Johnson et al. (2018) Johnson, S. D., Chen, H.-W., Straka, L. A., Schaye, J., Cantalupo, S., Wendt, M., Muzahid, S., Bouché, N., Herenz, E. C., Kollatschny, W., Mulchaey, J. S., Marino, R. A., Maseda, M. V., Wisotzki, L. 2018, ApJ, L1
- Kacprzak et al. (2010) Kacprzak G. G., Murphy M. T., Churchill C. W., 2010, MNRAS, 406, 445
- Kanekar et al. (2014) Kanekar, N., Prochaska, J. X., Smette, A., Ellison, S. L., Ryan-Weber, E. V., Momjian, E., Briggs, F. H., Lane, W. M., Chengalur, J. N., Delafosse, T., Grave, J., Jacobsen, D., de Bruyn, A. G. 2014, MNRAS, 438, 2131
- Kauffmann et al. (2003) Kauffmann, G., Heckman, T. M., Tremonti, C., Brinchmann, J., Charlot, S., White, S. D. M., Ridgway, S. E., Brinkmann, J., Fukugita, M., Hall, P. B., Ivezić, Ž., Richards, G. T., Schneider, D. P. 2003, MNRAS, 346, 1055
- Kewley et al. (2001) Kewley, L. J., Dopita, M. A., Sutherland, R. S., Heisler, C. A., Trevena, J. 2001, ApJ, 556, 121
- Kewley (2002) Kewley, L. J., Dopita, M. A. (2002), ApJS, 142, 35
- Kewley et al. (2013) Kewley, L. J., Dopita, M. A., Leitherer, C., Davé, R., Yuan, T., Allen, M., Groves, B., Sutherland, R. (2013), ApJS, 774, 100
- Kollmeier et al. (2010) Kollmeier, J. A., Zheng, Z., Davé, R., Gould, A., Katz, N., Miralda-Escudé, J., & Weinberg, D. H. 2010, ApJ, 708, 1048
- Krogager et al. (2017) Krogager, J.-K., Møller, P., Fynbo, J. P. U., Noterdaeme, P. (2017), MNRAS 469, 2959
- Mateos et al. (2013) Mateos, S., Alonso-Herrero, A., Carrera, F. J., Blain, A., Severgnini, P., Caccianiga, A., Ruiz, A. (2013), MNRAS, 434, 941
- Miller (2003) Miller, S. T., Veilleux, S. (2003), ApJ, 592, 79
- Miralda et al. (1996) Miralda-Escudé, J., Cen, R., Ostriker, J. P., & Rauch, M., 1996, ApJ, 471, 582
- Neeleman et al. (2016) Neeleman, M., Prochaska, J. X., Ribaudo, J., Lehner, N., Howk, J. C., Rafelski, M., & Kanekar, N. 2016, ApJ, 818, 113
- Osterbrock (2006) Osterbrock, D. E., Ferland, G. J. (2006), Astrophysics of gaseous nebulae and active galactic nuclei
- Péroux et al. (2019) Péroux, C., Zwaan, M. A., Klitsch, A., Augustin, R., Hamanowicz, A., Rahmani, H., Pettini, M., Kulkarni, V., Straka, L. A., Biggs, A. D., York, D. G., & Milliard, B. 2019, MNRAS, 485, 1595
- Rao et al. (2000) Rao S. M., Turnshek D. A., 2000, ApJS, 130, 1
- Rauch (1998) Rauch, M. 1998, ARA&A, 36, 267
- Rauch et al. (2008) Rauch, M., Haehnelt, M., Bunker, A., Becker, G., Marleau, F., Graham, J., Cristiani, S., Jarvis, M., Lacey, C., Morris, S., Peroux, C., Röttgering, H., Theuns, T. (2008), ApJ, 681, 856
- Rauch et al. (2011) Rauch, M., Becker, G. D., Haehnelt, M. G., Gauthier, J.-R., Ravindranath, S., Sargent, W. L. W. (2011), MNRAS, 418, 1115
- Rauch et al. (2013) Rauch, M., Becker, G. D., Haehnelt, M. G., Gauthier, J.-R., Sargent, W. L. W. (2013), MNRAS, 429, 429
- Rich et al. (2011) Rich, J. A., Kewley, L. J., Dopita, M. A. (2011), ApJ, 734, 87
- Roediger (2007) Roediger, E. and Brüggen, M. 2007, MNRAS, 380, 1399
- Slavin et al. (1993) Slavin, J. D., Shull, J. M., Begelman, M. C. (1993), ApJ, 407, 83
- Somerville et al. (2015) Somerville, R. S. and Davé, R. 2015, ARA&A, 53, 51
- Steidel et al. (2011) Steidel, C. C., Bogosavljević, M., Shapley, A. E., Kollmeier, J. A., Reddy, N. A., Erb, D. K., Pettini, M. (2011), ApJ, 736, 160
- Wolfe et al. (2005) Wolfe, A. M., Gawiser, E., & Prochaska, J. X. 2005, ARA&A, 43, 861
- Wright et al. (2010) Wright, E. L, Eisenhardt, P. R. M, Mainzer, A. K, Ressler, M. E, Cutri, R. M, Jarrett, T, Kirkpatrick, J. D, Padgett, D, McMillan, R. S, Skrutskie, M, Stanford, S. A, Cohen, M, Walker, R. G, Mather, J. C, Leisawitz, D, Gautier, III, T. N, McLean, I, Benford, D, Lonsdale, C. J, Blain, A, Mendez, B, Irace, W. R, Duval, V, Liu, F, Royer, D, Heinrichsen, I, Howard, J, Shannon, M, Kendall, M, Walsh, A. L, Larsen, M, Cardon, J. G, Schick, S, Schwalm, M, Abid, M, Fabinsky, B, Naes, L, Tsai, C.-W. (2010), AJ, 140, 1868
- York et al. (1986) York D., Dopita M., Green R., Bechtold J., 1986, ApJ, 311,610
- Zahedy et al. (2017) Zahedy F. S., Chen H.-W., Gauthier J.-R., Rauch M., 2017,MNRAS,466, 1071
- Zhang et al. (2018) Zhang, H., Zaritsky, D., Werk, J., Behroozi, P., 2018, ApJ, 866, L4