A New Two-Molecule Combination Band as Diagnostic of Carbon Monoxide Diluted in Nitrogen Ice On Triton
Abstract
A combination band due to a mechanism whereby a photon excites two or more vibrational modes (e.g. a bend and a stretch) of an individual molecule is commonly seen in laboratory and astronomical spectroscopy. Here, we present evidence of a much less commonly seen combination band one where a photon simultaneously excites two adjacent molecules in an ice. In particular, we present near-infrared spectra of laboratory CO/N2 ice samples where we identify a band at 4467.5 cm-1 (2.239 m) that results from single photons exciting adjacent pairs of CO and N2 molecules. We also present a near-infrared spectrum of Neptune’s largest satellite Triton taken with the Gemini-South 8.1 meter telescope and the Immersion Grating Infrared Spectrograph (IGRINS) that shows this 4467.5 cm-1 (2.239 m) CO-N2 combination band. The existence of the band in a spectrum of Triton indicates that CO and N2 molecules are intimately mixed in the ice rather than existing as separate regions of pure CO and pure N2 deposits. Our finding is important because CO and N2 are the most volatile species on Triton and so dominate seasonal volatile transport across its surface. Our result will place constraints on the interaction between the surface and atmosphere of Triton.
1 Introduction
Carbon monoxide (CO) ice and nitrogen (N2) ice have been detected in ground-based telescope spectra of Triton (Cruikshank et al., 1984, 1993) and Pluto (Owen et al., 1993). An unanswered question is whether CO molecules are diluted in N2 ice or whether CO and N2 exist as separate and pure ices. Answering this question is important because CO and N2 are the most volatile species on Triton and Pluto (methane, CH4, is a distant third), and so dominate seasonal volatile transport across their surfaces. It is entirely reasonable to expect CO and N2 molecules to mix throughout the ice. CO and N2 molecules have similar sizes, shapes, and masses. They have similar volatility, and they are unusual in that they are fully miscible in one another, in both liquid and solid phases. On the other hand, it is entirely possible that the surfaces of Triton and Pluto have regions of largely pure CO ice and largely pure N2 ice. Specifically, N2 is somewhat more volatile than CO, so the two species could separate through a solid state distillation process
Observations of Triton and Pluto lead toward the mixing of CO in N2 ice. In the case of Triton, Grundy et al. (2010) found similar patterns of longitudinal variation of CO and N2 ice. For Pluto, Grundy et al. (2016) analyzed New Horizons spacecraft data and found CO and N2 ice coexist in Sputnik Planitia, i.e. the western lobe of the heart-shaped Tombaugh Regio. The similar location of the two species on the two bodies suggest the CO molecules are mixed in the N2 ice. However, as of yet there is no spectroscopic evidence on either Triton or Pluto.
Finding spectroscopic evidence first requires an understanding of the physical structure of pure N2 ice and pure CO ice. Both species undergo a solid-solid phase transition between a higher temperature -phase with an orientationally disordered hexagonal crystal structure and a lower temperature -phase with an orientationally ordered cubic structure. In pure N2, this transition occurs at 35.61 K (Scott, 1976), while in pure CO it occurs at a much warmer 61.6 K (Barrett & Meyer, 1965). Since the two are fully miscible, the transition temperature can be expected to vary as a function of composition, and a phase diagram published by Angwin & Wasserman (1966) from x-ray diffraction shows exactly that. The binary phase diagram was further explored by Vetter & Jodl (2007) using infrared spectroscopy, resulting in - phase boundary curves somewhat different from the Angwin and Wasserman curves.
Besides experiments to discern the phase of the ice, additional experiments are essential to relate the phase to a spectroscopic signature. Only then can the laboratory spectra be compared to spectra of Triton and Pluto. Quirico & Schmitt (1997) made an extensive laboratory study of CO diluted in N2. Their work focused on the frequency, width, and intensity of the CO first vibrational overtone (0-2) at 4252 cm-1 because of its potential application to analyzing spectra of Triton and Pluto. Quirico and Schmitt found that the phase of the N2 ice made a difference in the appearance of the CO band. In particular, the CO (0-2) band was much more intense and narrower in the ordered -phase than in the disordered -phase. In addition, they found a difference in the frequency of the (0-2) band in the vs. ice. Besides the common isotope of CO, Quirico and Schmitt reported frequency measurements of the (0-2) band for uncommon isotopes of CO in the -phase. Of particular importance to the work we report here, Quirico and Schmitt also reported a new and unidentified band at 4467.3 cm-1. See their Figure 1 and Table 1.
Considering the importance of ice phase on the spectroscopic signature of a CO/N2 ice mixture, and the difference between the two published phase diagrams, we decided to revisit the phase diagram, but instead of using transmission spectroscopy, we opted to use Raman spectroscopy. Our rationale for use of Raman instead of transmission spectroscopy was that N2 is a symmetric molecule with no dipole, so its infrared spectral absorption is extremely weak, involving a temporary induced dipole moment from interaction with a neighboring molecule (Shapiro & Gush, 1966; Sheng & Ewing, 1971). The weakness of the infrared absorption by N2 creates difficulties for detecting its features in transmission spectra of thin or highly scattering samples. CO and N2 both have strong Raman bands (Cahil & Leroi, 1969), so use of Raman spectroscopy to track phase changes in N2/CO mixtures obviates difficulties associated with the weakness of N2 absorption.
In addition to the Raman spectroscopy experiments designed to clarify phase boundaries, we describe a series of laboratory transmission spectroscopy experiments designed to identify the 4467.3 cm-1 band in the spectra of Quirico & Schmitt (1997). Our experiments show the band is due to the simultaneous vibrational excitation of a CO molecule and an adjacent N2 molecule in the ice by a single photon. We term such a band a two-molecule combination band, which is also known in the literature as a ”dimol absorption band,” dimol meaning ”two-molecule.” For example, see Ida et al. (2010) and Tajti et al. (2017). Previous identifications of two-molecule combination bands in spectra of ice samples include single photons exciting the fundamental mode of adjacent N2 molecules (Grundy et al., 1993) and adjacent N2 and O2 molecules (Minenko & Jodl, 2006) as well as single photons exciting an electronic transition in adjacent O2 molecules (Landau et al., 1962; Spencer & Calvin, 2002).
The CO-N2 two-molecule combination band has the potential to further inform us about the state of ices on icy outer solar system bodies. In particular, besides our laboratory work, we present a near-infrared spectrum of Triton from the Gemini 8-meter telescope in Chile and the Immersion Grating Infrared Spectrograph (IGRINS). The spectrum shows the CO-N2 combination band. The detection conclusively shows that a significant amount of CO is indeed diluted in N2 ice on the surface of Triton.
2 Overtone and Combination Bands
Since the laboratory transmission spectra we describe below contain overtone bands and a newly identified two-molecule combination band, it’s important to elucidate the difference between overtone and combination bands.
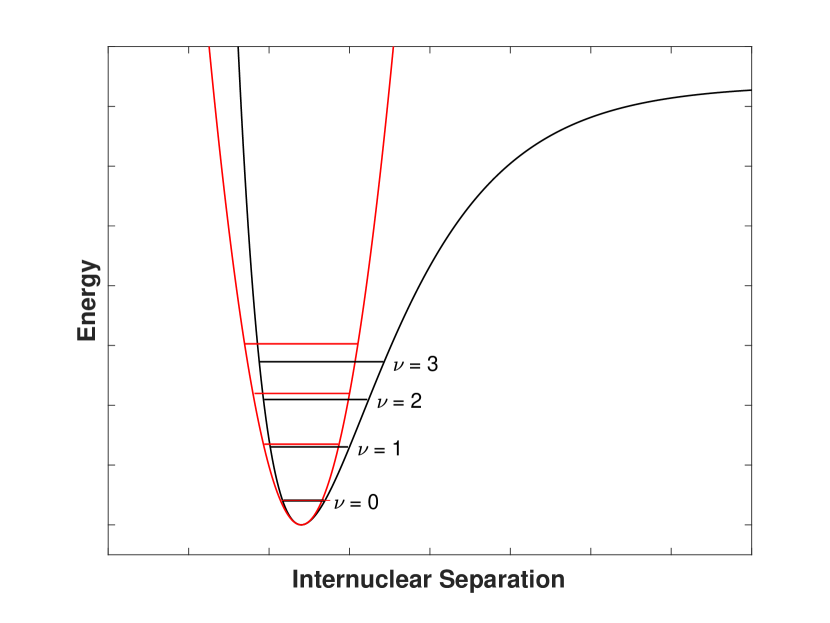
In Figure 1, we show a harmonic potential approximation to vibration of a generic diatomic molecule (red line). It gives a good approximation of the fundamental excitation of a vibrational mode (0-1). However, the equally spaced energy levels and a selection rule that requires 1 predicts a spectrum of only one band whereas we know spectra of real diatomic molecules exhibit more than one band.
An anharmonic potential is a much better approximation to vibration of a diatomic molecule. In Figure 1, we show the Morse potential (black line) which is an example of an anharmonic potential commonly used to describe bond vibration. Notice that unlike the harmonic oscillator potential, the energy levels are not evenly spaced but decrease in spacing as increases. In addition, the anharmonicity breaks the selection rule 1. So, it is possible for photons to excite the molecule from 0 to 2 (first overtone) and 0 to 3 (second overtone) and so on. An important point to draw from Figure 1 for our work here is that the first overtone is not excited by a photon with exactly twice the frequency of the fundamental. Rather, it is excited by a photon with a frequency less than twice the frequency of the fundamental. The same is true of the second overtone. It is not excited by a photon with a frequency three times the fundamental. Rather it is excited by a photon with a frequency less than three times the fundamental.
Combination bands commonly occur when a photon simultaneously excites two or more fundamentals of a single molecule with three or more atoms, i.e. molecules with more than one vibration mode. For example, a single photon could simultaneously excite the OH symmetric stretch fundamental of a H2O molecule at 3657 cm-1 and the bend fundamental of the same H2O molecule at 1595 cm-1 to create a combination band at about 5252 cm-1.
Here, we report combination bands that result from photons that simultaneously excite the fundamentals of two adjacent molecules, N2 and CO, rather than photons that excite two fundamentals in a single molecule.
3 Experimental Set Up
The experiments reported here were carried out in the Astrophysical Materials Laboratory located in the Department of Physics and Astronomy of Northern Arizona University. Ice samples were crystallized in a cell fitted with windows to allow a spectrometer beam to pass through the ice (Figure 2a). A detailed description of the facility was published in Tegler et al. (2010). Subsequent to that paper, we made several important improvements to the facility including the addition of a mercury cadmium telluride (MCT) type-A detector cooled with liquid nitrogen, off-axis aluminum paraboloid mirrors (Figure 2b), and a 2 L mixing volume. Detailed descriptions of these improvements were published in Grundy et al. (2011).
Samples were grown as follows. High pressure cylinders of CO (purity 99.99 ) and N2 (purity 99.9 ) supplied by Airgas were connected through separate pressure regulators and valves to the mixing volume. We mixed gasses at room temperature in the mixing volume. Then, we opened a valve which allowed the gas to flow into the empty, cold cell, condensing it as a liquid. We froze the liquid by reducing the temperature in the cell at a rate of 0.1 K per minute. During the freezing process, we maintained a vertical thermal gradient of about 2 K across the sample by means of heaters (Figure 2a). In this way, the sample froze from the bottom upward, with the location of the freezing front controlled by the cell temperature. Once the sample was frozen, we removed the vertical thermal gradient.
Spectra were recorded with a Nicolet iS50 Fourier transform infrared (FTIR) spectrometer at a sampling interval of 0.24 cm-1, resulting in a spectral resolution of 0.6 cm-1 (full width at half maximum of unresolved lines). We averaged over spectral scans to improve the signal/noise ratio. After we recorded our initial ice spectrum, we ramped down to lower temperatures at 0.1 K per minute.
Raw transmission spectra were converted to absorption coefficient spectra as follows. First, we removed the instrumental signature and water vapor lines by dividing each raw transmission spectrum by a background spectrum, i.e. a spectrum taken just before insertion of the sample and/or just after blowing off the sample. Then, we removed a low-amplitude, high-frequency interference pattern due to the windows in our cell by using a Fourier filter. Finally, we used the Beer-Lambert law to compute absorption coefficient spectra, .
Using the same sample preparation procedures described above, we probed our samples using a Kaiser Optical Systems Rxn1 Raman instrument with a 400 mW 785 nm laser. The laser beam traveled through an optical fiber and, after emerging from the fiber, was focused just inside the window of the sample cell by means a 5.5 inch focal length lens. Scattered photons were focused by the same lens back into the optical fiber, which returned them to a grating spectrometer that recorded wavelengths from about 791 to 1074 nm, corresponding to wavenumbers from 100 to 3425 cm-1 below that of the laser. These are photons that have lost energy to the material, a process known as Stokes Raman scattering (as opposed to anti-Stokes scattering in which photons gain energy from the material).
4 Experimental Results
4.1 Raman Spectroscopy
Figure 3a shows how we used Raman spectra to determine the temperatures of phase transitions for three different CO and N2 compositions. In both the - and -phases of each of the three samples, the Raman shift slowly increased with decreasing temperature. Furthermore, the shifts were much higher in -phase than in phase. Of particular importance here, during the formation of the first -ice and until the disappearance of the last -ice, the rate of change in Raman shift with temperature was much faster than when the ice was all -ice or all -ice. The location in Figure 3a where the slope changed (green vertical lines) reveal the upper and lower temperature limits of the two-phase region. In Figure 3b, we plot the upper and lower temperature limits of the two phase region for the three compositions in Figure 3a along with four other compositions. In addition, we plot the phase boundaries from Angwin & Wasserman (1966) (gray curves) and from Vetter & Jodl (2007) (dashed black curves). Our results show that the two-phase region between the two curves is narrower than found in earlier studies. Figure 3b gives us confidence we know the phase of our ice samples in our transmission spectroscopy experiments.
4.2 Transmission Spectroscopy
Below we describe the results of our transmission spectroscopy experiments designed to identify the 4467.3 cm-1 band reported by Quirico & Schmitt (1997).
4.2.1 -Ice vs. -Ice
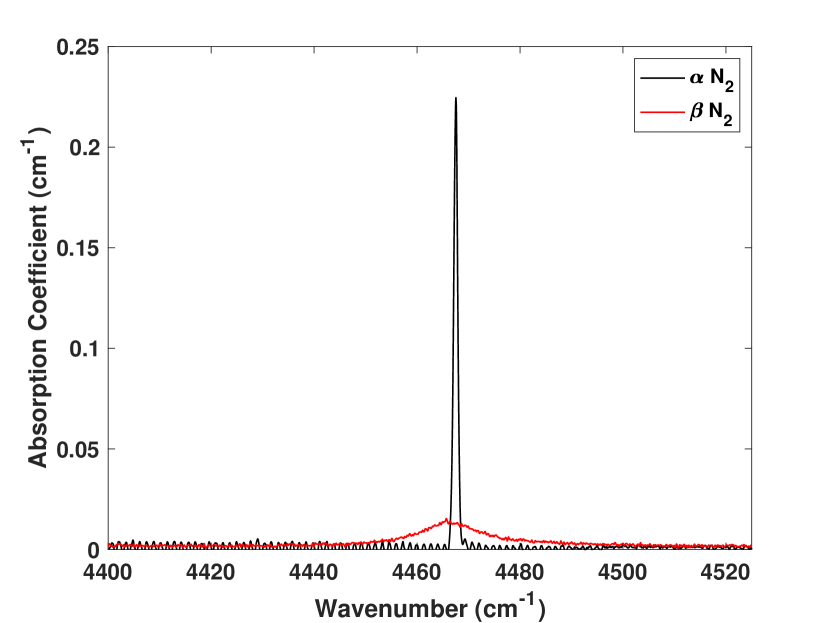
In Figure 4, we plot spectra of a 4% CO and 96% N2 ice sample at temperatures of 60 K (-phase, red line) and 33 K (-phase, black line). From Figure 3b, it is clear that the sample was exclusively -ice at 60 K and exclusively -ice at 33 K. In other words, neither spectrum was sampling both phases. As expected, the unidentified band is more intense and narrower in the -phase than in the -phase. It is also clear from Figure 4 that the peak absorption of the band occurs at different frequencies in -ice and -ice. In particular, we measured a frequency of 4467.5 cm-1 in the -phase and 4466.5 cm-1 in the -phase. We point out that our frequency and intensity measurements for the band are in good agreement with Quirico & Schmitt (1997). Specifically, we measured a frequency and intensity of 4467.5 cm-1 and 0.22 cm-1 and Quirico & Schmitt (1997) measured a frequency and intensity of 4467.3 cm-1 and 0.3 cm-1. Our measurements and those of Quirico and Schmitt were made at nearly identical temperatures and compositions but in different laboratories.
| Sample | Band | Frequency | Reference |
|---|---|---|---|
| (cm-1) | |||
| N2 | 0-1 | 2328.1 | a |
| 12C16O | 0-1 | 2139.5 | b |
| 13C16O | 0-1 | 2092.3 | b |
| 12C18O | 0-1 | 2088.4 | b |
| 14N2 14N2 | Combination | 4656.3 | c |
| 12C16O14N2 | Combination | 4467.5 | c |
| 13C16O14N2 | Combination | 4420.4 | c |
| 12C18O14N2 | Combination | 4416.4 | c |
4.2.2 Frequency Measurements
If the unidentified band is due to the simultaneous excitation of a CO and N2 molecule, its frequency should be the sum of a CO frequency and a N2 frequency. The CO fundamental (0-1) has a frequency of 2139.5 cm-1 (Quirico & Schmitt, 1997) and the N2 fundamental (0-1) has a frequency of 2328.1 cm-1 (Grundy et al., 1993), both in the -phase. The sum of these two fundamental frequencies is 4467.6 cm-1. As described above, we measured a frequency of 4467.5 cm-1 for the unidentified band in the -phase. As the uncertainty in our frequency measurements is about 0.1 cm-1, these frequency measurements are consistent with the unidentified band resulting from the simultaneous absorption of single photons by adjacent pairs of CO and N2 molecules.
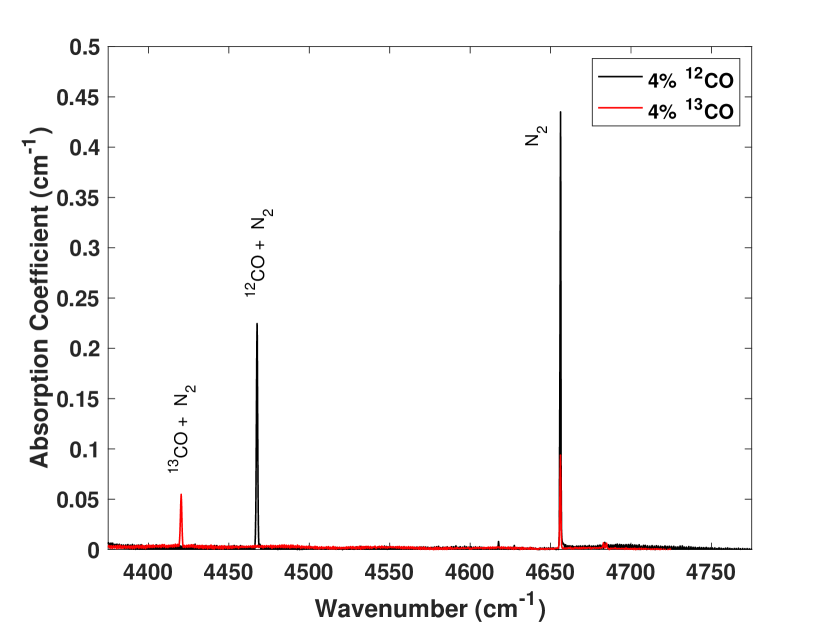
Ices with uncommon isotopic compositions provide a means to further test the above mechanism. Specifically, the frequency of vibrational absorption by a diatomic molecule depends on the masses of the individual atoms. Therefore, changing the mass of one of the atoms, e.g. 12C to 13C, will change the frequency of the CO (0-1) band and so should change the frequency of a CO-N2 combination band. To test our mechanism, we obtained spectra of a 4% 13C16O 96% 14N2 sample and compared it to spectra of our 4% 12C16O 96% 14N2 sample. In Figure 5, we show spectra of our 4% 13C16O sample (red line) and our 4% 12C16O sample (black line). The unidentified band shifts from 4467.5 cm-1 in the 12C16O sample to 4420.4 cm-1 in the 13C16O sample. Note that as expected the 14N2 band at 4656.2 cm-1 did not shift between the two samples. Quirico & Schmitt (1997) measured a frequency of 2092.3 cm-1 for 13CO (0-1). Combining that frequency with a frequency 2328.1 cm-1 for 14N2 (0-1) we get 4420.4 cm-1. In short, there is excellent agreement between summing the frequencies of 13C16O (0-1) and 14N2 (0-1) and the frequency of the unidentified band in our spectrum.
We did one more isotope experiment. Specifically, we obtained spectra of a 4% 12C18O 96% 14N2 sample and compared it to spectra of our 4% 12C16O 96% 14N2 sample. The unidentified band shifted from 4467.5 cm-1 in the 12C16O sample to 4416.4 cm-1 in the 12C18O sample. Quirico & Schmitt (1997) measured a frequency of 2088.4 cm-1 for 12C18O (0-1). Combining that frequency with the 14N2 (0-1) frequency, we get 4416.5 cm-1. In other words, a difference of only 0.1 cm-1 between the sum of the fundamental frequencies and our measured frequency for the unidentified band. Again, the result is consistent with our mechanism of photons exciting adjacent pairs of CO and N2 molecules. In Table 1, we summarize the measured band frequencies.
4.2.3 Stoichiometry
Yet another way to test our idea that the new band is the result of photons exciting adjacent pairs of CO and N2 molecules is through stoichometry. If our mechanism is correct, the new band should be strongest in spectra of ice samples where there is a large number of CO molecules adjacent to N2 molecules. In other words, the band should be strongest in ice samples with nearly equal amounts of CO and N2 and absent in spectra of pure CO ice and pure N2 ice.
In Figure 6, we show spectra of ten CO/N2 ice samples with increasing CO abundances ranging from no CO, i.e. pure N2 ice, to pure CO ice. These spectra include the (02) CO band at 4252 cm-1, the new band, and a N2 band at 4654 cm-1 . All spectra were taken at 60 K, so the ice was in the phase. In Figure 6a, we see the band is not present in the spectrum of pure N2 (black line). The band increases in strength as the CO abundance increases in the samples. By comparing Figure 6a and Figure 6b, we can see the band reaches a maximum strength for samples with nearly equal abundances of N2 and CO, i.e. CO abundances of 40% and 60%. In Figure 6b, we can see the band steadily decreases in strength as the CO abundance continues to increase in the samples. The band is not present in the spectrum of a pure CO ice sample (black line). As expected, the new band is strongest in spectra of samples with near equal amounts of CO and N2 and absent in spectra of pure CO and pure N2. Note that the behavior of the new band is contrary to the behavior of the CO and N2 bands in these 10 spectra which show an increase in their strength with an increase in their abundance.
4.2.4 Other Two-Molecule Combination Bands
The identification of a CO-N2 combination band prompted us to look for similar bands in other samples. Specifically, we looked for evidence of two-molecule combination bands in a pure N2 ice sample and a pure CO ice sample.
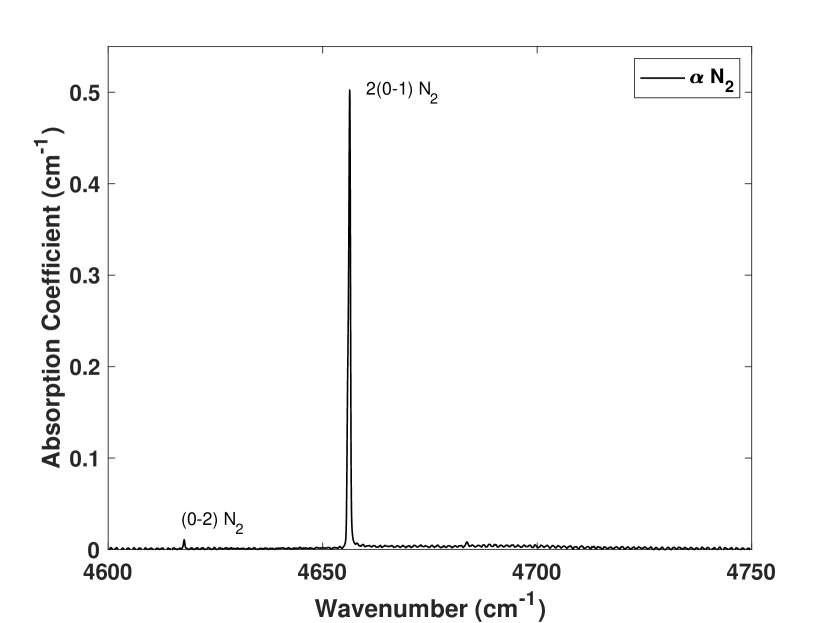
In Figure 7, we plot a spectrum of a pure N2 ice at 32 K. From Figure 3b, we see the ice is in the -phase. The strong band in the figure has a frequency of 4656.3 cm-1, i.e. almost exactly two times the N2 fundamental frequency of 2328.1 cm-1 . Therefore, the 4656.3 cm-1 band is likely a two-molecule combination band. We designate the band N2 2(0-1). Remember from Figure 1, the first overtone of a diatomic molecule occurs at a frequency of less than twice the frequency of the fundamental. Hence, the weaker band at 4617.7 cm-1 is likely the first overtone N2 (0-2). It is interesting to note that the planetary science literature designates the N2 band at 4656.3 cm-1 as the first overtone rather than a two-molecule combination band (see Piscitelli et al. (1988), Grundy & Fink (1991), Tryka et al. (1993), and Burgdorf et al. (2010)).
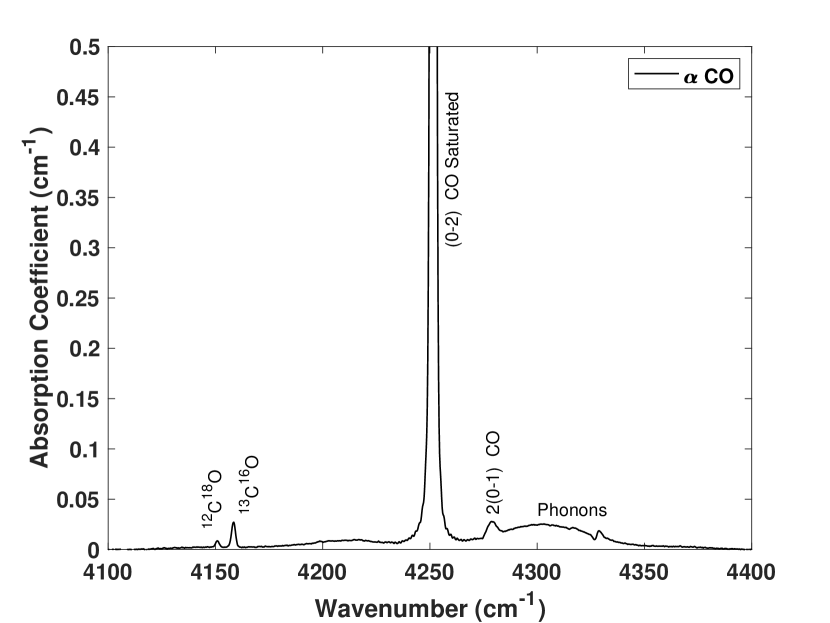
In Figure 8, we plot a spectrum of a pure CO ice sample at 55 K. Again, from Figure 3b, we see the ice is in the -phase. Note that the weak band at a frequency of 4278.9 cm-1 in Figure 8 is almost exactly two times the CO fundamental frequency of 2139.5 cm-1. Therefore, the 4278.9 cm-1 band is likely a two-molecule combination band. We designate it as CO 2(0-1). As expected, the first overtone CO (0-2) occurs at a frequency of 4252.2 cm-1, i.e. less than twice the frequency of the fundamental. Note that the first overtone band (0-2) is saturated.
5 Astronomical Spectroscopy
We obtained near-infrared spectra of Triton on the night of 2018 July 2 UT using the Gemini-South 8.1 meter telescope and IGRINS (Park et al., 2014; Mace et al., 2018). IGRINS’ slit size on the sky was 0.34 arc sec wide by 5 arc sec long. IGRINS provided wavelength coverage from 1.45 m to 2.5 m, a resolution (/fwhm) of 45,000, and a sampling of 0.000017 m pixel-1 at 2.239 m (4466.5 cm-1). There were cirrus clouds and the seeing was 0.9 arcsec at the time of observations. Triton was at an airmass of 1.26 and 1.10 at the start and end of observations, respectively. The observing sequence involved nodding Triton along the slit in an A-B-B-A pattern. The spectra were then reduced using the standard IGRINS Pipeline package (Lee & Gullikson, 2017). The pipeline first removed pixel to pixel variations through flat fielding, it then performed spatial rectification of the two-dimension spectra using flat-lamp echellograms. A wavelength correction was then applied using sky emission and absorption features. Finally, the spectra were optimally extracted from the two dimensional image (Horne, 1986). The output result for each observation of an A-B pairs was a one-dimensional spectrum of wavelength vs. flux for each order. Spectra of an A0V comparison star were taken in order to remove instrumental signatures and telluric bands in the spectra of Triton. We summed our individual Triton spectra to obtain a single spectrum with a total exposure time of 80 minutes. Since our objective was to detect the spectrally broad CO-N2 combination band at 2.239 m (4466.5 cm-1), we used inverse variance weighting to bin the spectrum into blocks of 64 pixels, and thereby improve the signal-to-noise ratio of the Triton spectrum. The binned spectrum had a resolution of / 2500.
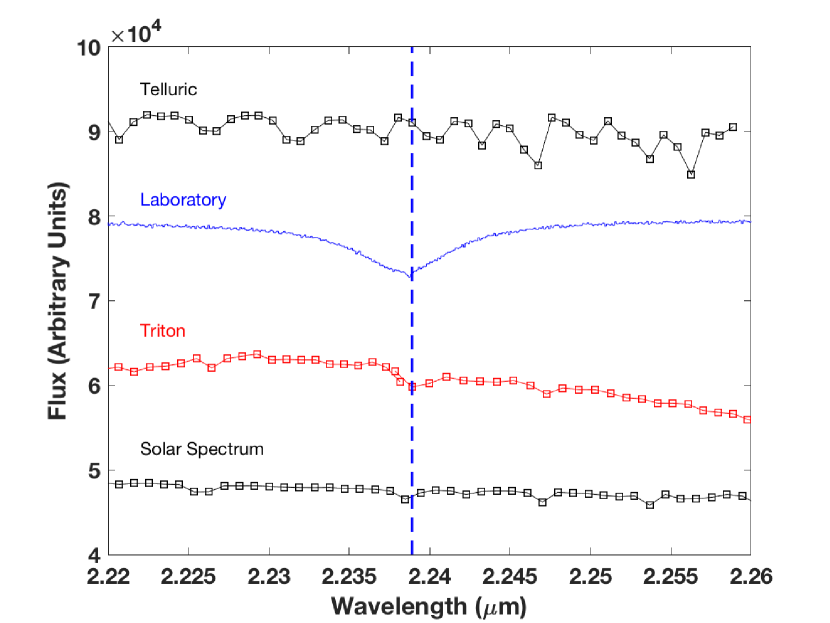
In Figure 9, we provide evidence for the detection of the two-molecule combination band at 2.239 m (4466.5 cm-1) in the spectrum of Triton (red squares). In addition, we show a transmission spectrum of an 8% CO and 92% N2 ice sample at 60 K, i.e. a -ice (blue line). We use a 60 K sample because of convenience for the laboratory experiments and not to derive a surface temperature for Triton which is 40 K. The lab band associated with -ice at 60 K is nearly identical to the lab band associated with -ice at 40 K. For comparison, we show absorption due to Earth’s atmosphere (black squares at top of figure) and reflected sunlight, i.e. Fraunhofer lines (black squares at bottom of figure). The telluric and solar spectra are binned to the same resolution as the binned Triton spectrum, i.e. / 2500. The vertical dotted line marks the wavelength of maximum absorption by the broad band in our Triton spectrum. The band in our Triton spectrum coincides with the 2.239 m (4466.5 cm-1) band in the laboratory spectrum. A comparison of the Triton and telluric spectra shows our A0V star observations did an excellent job of cancelling atmospheric lines. A comparison of the Triton and solar spectra shows that three weak solar bands contaminate the Triton spectrum, one of which coincides with the two-molecule combination band at 2.239 m (4466.5 cm-1). However, it appears the solar band is much weaker and narrower than the two-molecule combination band. On the basis of these comparisons, we have a high confidence in the detection of the band in the spectrum of Triton. Furthermore, Merlin et al. (2018) detected a broad and weak absorption band at 2.239 m in their spectrum of Triton taken with the 8.2-m UT4 telescope in Chile, but they did not identify it.
We caution the reader to not over interpret the data in Figure 9. The Triton spectrum is a reflectance spectrum and the lab spectrum is a transmission spectrum. Hence, it is not possible to quantitatively fit the band in the lab spectrum to the band in the Triton spectrum in Figure 9. Such a fit requires us to first convert the laboratory transmission spectrum to a reflectance spectrum using a radiation transfer model, e.g. a Hapke model. Such a conversion is beyond the scope of this paper.
6 Conclusions
We carried out extensive experiments in order to identify a band at 4467.3 cm-1 that was first detected in a sample of CO (4%) isolated in solid -N2 ice (Quirico & Schmitt, 1997). Our laboratory results show that the band is strongest in samples with near equal amounts of CO and and is not present in either pure CO or pure N2 samples. In addition, we found that summing the frequencies of the CO (0-1) fundamental and the N2 (0-1) fundamental agreed with the frequency of the band under study. We performed a similar analysis on two additional samples one of 13C16O/14N and the other of 12C18O/14N. In all samples, we found summing the frequencies of the CO and N2 fundamentals agreed with the frequencies of the band under study. These experiments indicate that photons are exciting adjacent CO and N2 molecules to produce the band. We call the band a two-molecule combination band.
In addition to our laboratory experiments, we obtained an 80 minute spectrum of Triton using the Gemini South 8-meter telescope and the IGRINS spectrometer. The spectrum shows clear evidence for the two-molecule combination band at 2.239 m (4466.5 cm-1). Merlin et al. (2018) found the same band in their VLT spectrum of Triton. However, they did not identify the band. The presence of the band in spectra of Triton indicates that CO and N2 are intimately mixed in the surface ice rather than separated into spatially distinct CO and N2 regions.
The CO-N2 combination band has the potential to better inform us about the ice composition of icy dwarf planets. For example, future ground-based observations could determine if the band strength depends on the Triton longitude. Perhaps a future spacecraft mission to Pluto will image Sputnik Planitia in the 2.239 m (4467 cm-1) band. Such an image would provide a wealth of stoichiometric information about the surface ices and so help constrain geologic and atmospheric processes on Pluto.
We thank the NASA Outer Planets Research program (NNX11AM53G), NASA Solar Systems Workings program (80NSSC19K0556), John and Maureen Hendricks Foundation, Technology Research Initiative Fund at NAU, and National Science Foundation Research Experience for Undergraduates program at NAU (AST-1461200) for their financial support.
This work was based on observations obtained at the Gemini Observatory, which is operated by the Association of Universities for Research in Astronomy, Inc., under a cooperative agreement with the NSF on behalf of the Gemini partnership: the National Science Foundation (United States), National Research Council (Canada), CONICYT (Chile), Ministerio de Ciencia, Tecnología e Innovación Productiva (Argentina), Ministério da Ciência, Tecnologia e Inovação (Brazil), and Korea Astronomy and Space Science Institute (Republic of Korea).
This work used the Immersion Grating Infrared Spectrometer (IGRINS) that was developed under a collaboration between the University of Texas at Austin and the Korea Astronomy and Space Science Institute (KASI) with the financial support of the US National Science Foundation under grants AST-1229522 and AST-1702267, of the University of Texas at Austin, and of the Korean GMT Project of KASI.
References
- Angwin & Wasserman (1966) Angwin, M.J., & Wasserman, J. 1966, J. Chem. Phys. 44, 417-418
- Barrett & Meyer (1965) Barrett, C.S. & Meyer, L. 1965. J. Chem. Phys. 43, 3502
- Burgdorf et al. (2010) Burgdorf, M., Cruikshank, D.P., Dalle Ore, C.M. et al. 2010, ApJ, 718, 53
- Cahil & Leroi (1969) Cahill, J.E.,& Leroi , G.E. 1969. J. Chem. Phys. 51, 1324
- Cruikshank et al. (1984) Cruikshank, D.P., Brown, R. H., and Clark, R.N. 1984, Icarus, 58, 293
- Cruikshank et al. (1993) Cruikshank, D.P., Roush, T.L., Owen, T.C. et al. 1993, Science, 261, 742
- Grundy & Fink (1991) Grundy, W.M., Fink, U. 1991, Icarus, 93, 169
- Grundy et al. (1993) Grundy, W.M., Schmitt, B., Quirico, E. 1993, Icarus, 105, 254
- Grundy et al. (2010) Grundy, W.M., Young, L.A., Stansberry, J.A. et al. 2010, Icarus, 205, 594
- Grundy et al. (2011) Grundy, W.M., Morrison, S.J., Bovyn, et al. 2011, Icarus, 212, 941
- Grundy et al. (2016) Grundy, W.M., Binzel, R.P., Buratti, B.J. et al. 2016, Science, 351, 9189
- Horne (1986) Horne, K. 1986, PASP, 98, 609
- Ida et al. (2010) Ida, A, Furui, E., Akai, N. et al. 2010. Chem Phys Lett, 488, 130
- Landau et al. (1962) Landau, A., Allin, E.J., and Welsh, H.L. 1962. Spectrochimica Acta, 18, 1
- Lee & Gullikson (2017) Lee, J., Gullikson, K. 2017, https://doi.org/10.5281/zenodo.438353
- Mace et al. (2018) Mace, G., Sokal, K., Lee, J. 2018, Proc. SPIE, 10702, 18pp
- Merlin et al. (2018) Merlin, F., Lellouch, E., Quirico, E. et al. 2018, Icarus, 314, 274
- Minenko & Jodl (2006) Minenko, M. & Jodl, H. J. 2006, Low Temp. Phys., 32, 1050
- Owen et al. (1993) Owen, T.C., Roush, T.L., Cruikshank, D.P. et al. 1993, Science, 261, 7
- Park et al. (2014) Park, C., Jaffe, D.T., Yuk, In-Soo, et al. 2014, SPIE, 9147, 12
- Piscitelli et al. (1988) Piscitelli, J.R., Cruikshank, D.P, Bell, J.F. 1988. Icarus, 76, 118
- Quirico & Schmitt (1997) Quirico, E. & Schmitt, B. 1997, Icarus, 128, 181
- Scott (1976) Scott, T.A. 1976, Phys. Rep. 27, 89
- Shapiro & Gush (1966) Shapiro, M.M., & Gush, H.P. 1966. Can. J. Phys. 44, 949
- Sheng & Ewing (1971) Sheng, D.T., & Ewing, G.E. 1971. J. Chem. Phys. 55, 5425
- Spencer & Calvin (2002) Spencer, J.R., & Calvin, W.M. 2002. AJ. 124, 3400
- Tajti et al. (2017) Tajti, A., Lendvay, G., & Szalay, P. 2017, J. Phys. Chem. Lett., 8, 3356
- Tegler et al. (2010) Tegler, S.C., Cornelison, D.M., Grundy, W.M., et al. 2010, ApJ, 725, 1296
- Tryka et al. (1993) Tryka, K.A., Brown, R.H., Anicich, V., Cruikshank, D.P., Owen, T.C. 1993, Science, 261, 751
- Tryka et al. (1995) Tryka, K.A., Brown, R.H., & Anicich, V. 1995, Icarus, 116, 409
- Vetter & Jodl (2007) Vetter, M., Jodl, H.J. Brodyanski, A. 2007, Low Temp. Phys. 33, 1052