ALMA unveils widespread molecular gas clumps in the ram pressure stripped tail of the Norma jellyfish galaxy
Abstract
We present the first high-resolution map of the cold molecular gas distribution, as traced by CO(2-1) emission with ALMA, in a prominent ram pressure stripped tail. The Norma cluster galaxy ESO 137-001 is undergoing a strong interaction with the surrounding intra-cluster medium and is one of the nearest jellyfish galaxies with a long multi-phase tail. We have mapped the full extent of the tail at (350 pc) angular resolution and found a rich distribution of mostly compact CO regions extending to nearly 60 kpc in length and 25 kpc in width. In total about of molecular gas was detected. The CO features are found predominantly at the heads of numerous small-scale ( kpc) fireballs (i.e., star-forming clouds with linear streams of young stars extending toward the galaxy) but also of large-scale ( kpc) super-fireballs, and double-sided fireballs that have additional diffuse ionized gas tails extending in the direction opposite to the stellar tails. The new data help to shed light on the origin of the molecular tail – CO filaments oriented in the direction of the tail with only diffuse associated H emission are likely young molecular features formed in situ, whereas other large CO features tilted with respect to the tail may have originated from the densest gas complexes that were pushed gradually away from the disk. The ALMA observations of ESO 137-001, together with observations from HST, Chandra and VLT/MUSE, offer the most complete view of a spectacular ram pressure stripped tail to date.
1 Introduction
In recent years, numerous cluster galaxies with tails of ram pressure stripped (RPS) gas have been discovered, many containing young stars (e.g. Cortese et al., 2006; Sun et al., 2007; Yoshida et al., 2008; Smith et al., 2010; Hester et al., 2010; Yagi et al., 2013; Ebeling et al., 2014; Poggianti et al., 2017; Gullieuszik et al., 2017; Boselli et al., 2018). These are dramatic examples of galaxy evolution driven by the cluster environment in which ram pressure of the intracluster medium (ICM) efficiently strips star-forming cool interstellar matter (ISM) from infalling galaxies (Gunn & Gott, 1972; Köppen et al., 2018). This causes star formation quenching of the main bodies of the galaxies (van Gorkom, 2004; Koopmann & Kenney, 2004) and their subsequent transformation towards early-types.
Another aspect of ram pressure stripping of galaxies is the production of new young stellar components in the stripped ISM which join galaxy halos or intracluster space (Sun et al., 2007; Fumagalli et al., 2011; Abramson et al., 2011; Yagi et al., 2013; Kenney et al., 2014; George et al., 2018; Poggianti et al., 2019; Cramer et al., 2019). Young stars (ages Myr) are found in the RPS tails at distances of up to several tens of kpc, indicating they have formed in-situ in the tails. Star formation in RPS tails provides a great opportunity to study the star formation process in a different environment from that in galaxy disks, something that is not sufficiently well understood in galaxy evolution.
Tails of ’jellyfish’ galaxies are multiphase, containing gas with a wide range of densities and temperatures. They have been detected in X-rays (via bremstrahlung from hot ionized gas; Finoguenov et al., 2004; Wang et al., 2004; Machacek et al., 2005; Sun & Vikhlinin, 2005; Sun et al., 2006, 2010), H (both from compact HII regions photoionized by young stars, and from warm diffuse gas ionized by some other mechanism; Gavazzi et al., 2001; Yoshida et al., 2004, 2008; Cortese et al., 2006, 2007; Sun et al., 2007; Yagi et al., 2007; Yagi et al., 2010; Fossati et al., 2012; Fumagalli et al., 2014; Boselli et al., 2016; Poggianti et al., 2017), and HI (emitted by cooler neutral gas; Kenney et al., 2004; Oosterloo & van Gorkom, 2005; Chung et al., 2007, 2009; Abramson et al., 2011; Scott et al., 2010, 2012; Scott et al., 2018).
Recently a cold molecular gas component has been detected in several tails (Jáchym et al., 2014; Verdugo et al., 2015; Jáchym et al., 2017; Moretti et al., 2018), in some cases forming an important fraction of the tail gas mass. In one sense, this is unsurprising given that stars are forming in the tails. On the other hand, explaining the presence of molecular clouds in ram pressure stripped tails is not trivial, since molecular clouds, tracing the densest parts of the ISM, resist direct stripping more than any other constituent of the ISM. Moreover, the survival of molecular clouds in the intra-cluster environment is poorly understood.
We would like to understand the formation and evolution of star-forming molecular clouds in RPS tails. What are the roles of in-situ formation versus direct stripping? Can stripped low density gas cool sufficiently in the tails to produce dense gas and stars or does ram pressure need to be strong enough to directly strip dense gas? How do molecular gas complexes in tails (their mass distribution, lifetimes, SF efficiencies) compare to those in the disks of star-forming galaxies? How do star-forming molecular clouds evolve within the diverging gas flow of RPS tails? In order to make progress towards addressing these questions we need high resolution observations of molecular gas in the tails, a task that until now has not been possible.
We have obtained ALMA CO(2-1) observations of ESO 137-001, a textbook example of a galaxy that is undergoing stripping by ram pressure. This is the first time that a full map at sub-kpc resolution of the cold molecular gas distribution in a ram pressure stripped tail has been acquired. To date, only off-center or off-disk regions of CO emission have been detected in maps of the RPS galaxies NGC 4848 and NGC 4522 and their close vicinity with the IRAM PdB and ALMA telescopes (Vollmer et al., 2001a; Lee & Chung, 2018).
1.1 ESO 137-001
ESO 137-001 galaxy in the Norma cluster (A3627, , km s-1) is one of the nearest ’jellyfish galaxies’ (), with a long X-ray, H, warm H2, and CO tail, including young stars (Sun et al., 2006, 2010, 2007; Sivanandam et al., 2010; Fumagalli et al., 2014; Jáchym et al., 2014; Fossati et al., 2016). The presence of the one-sided gas tail, a strong HI-deficiency of the main galaxy (Vollmer et al., 2001b), and an undisturbed stellar disk are clear characteristics of a ram pressure stripping interaction. The galaxy is projected at only kpc from the cluster center (assuming km s-1 Mpc-1, , kpc). The tail is observed in its full extent thanks to a favorable projection on the sky – the galaxy’s radial velocity relative to the cluster mean is only about km s-1, so its motion is mostly in the plane of the sky.
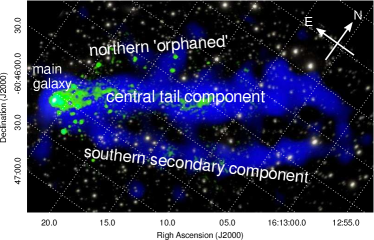
The multi-phase ESO 137-001 tail is also a multi-component system with a complex morphology – see a composite X-ray/H image in Fig. 1. The central tail component which is brightest and longest in X-ray and H emission, connects to the main body of the galaxy. It is rather narrow with a width of kpc and a length of kpc, and a slightly bent shape. In addition there is also emission laterally beyond this central tail component. To the south there is a secondary X-ray and H tail, which appears to originate outside the main body of the galaxy, above the stellar disk. To the north, there are some compact H sources (’orphan HII regions’ with no associated diffuse X-ray emission) and some patches of X-ray and H emission. This part of the tail shows no gaseous emission connecting it to the stellar disk and there is also less diffuse (H and X-ray) emission between the sources than in the southern tail component. Since RPS generally acts from the outside in (see Sec. 3.4), the different parts are likely at different evolutionary stages of stripping.
We used ALMA to observe all three tail components and nearly the full length of the (X-ray) tail - see the maps in Fig. 2. In the present paper we first describe the ALMA observations in Section 2 and compare them with CO(2-1) single-dish observations. We present in Section 3 maps of CO emission in ESO 137-001 and their comparison with ancillary data. We identify signatures of direct stripping and those indicating in-situ formation in Section 4 and describe “fireball” features that are distinctive of ram pressure stripping in Section 5. Our conclusions are given in Section 6.

2 Observations
The observations were carried out with ALMA from January to July, 2016 (Cycle 3 project 2015.1.01520.S; PI: Jáchym). Using Band 6 in dual polarization mode, a spectral window was centered at the CO(2-1) line at a sky frequency of 227.955 GHz in frequency division mode (FDM) mode. The corresponding velocity resolution is km s-1. Three spectral windows were set to observe the continuum, centered at sky frequencies of GHz, 240.268 GHz, and 241.942 GHz. At GHz, the HPBW of the primary beam of the telescope was about .
The main 12m array observations were completed in six sessions, with the number of antennas varying in the range . The antennas were arranged in compact configurations with baselines in the range m. To cover the main galaxy and most of the spectacular tail, a rectangular mosaic of 131 pointings was set. An average on-source time per pointing was min. The median of the average system temperatures was 94 K.
Additional 7m ACA array observations were obtained to increase the maximum recoverable spatial scale. In 15 observing sessions, 7m antennas were used, with minimum and maximum baselines of 8.9 m and 48.9 m, respectively. The largest recoverable scale is (calculated using the criterion of measuring 10% of the total flux density of a uniform disk; see the ALMA Cycle 3 Technical Handbook, Table 7.1). An average min of on-source time was spent in each of 52 pointings covering the galaxy and its tail. The median of the average system temperatures was 75 K.
Flux calibration was based on observations of Titan, J1617-5848 (12m and ACA) and J1427-4206 (ACA only). Bandpass calibration used J1427-4206 (12m only), and J1924-2914 & J1517-2422 (ACA only), and the phase calibrator was J1617-5848.
The 12m array and ACA datasets were calibrated separately with the ALMA pipeline. Using the CASA software package (v.4.5.3; McMullin et al., 2007), the continuum was subtracted in the uv-plane using the task uvcontsub first, followed by Briggs cleaning with a robust parameter of 0.5, and spectral smoothing to 5 km s-1. The resulting synthesized beam in the ACA and ALMA image datacubes is (PA of ) and (), respectively. The two datacubes were concatenated in a standard manner (after checking the ratio of the weights), using the CASA task concatenate. The RMS noise levels in the line-free regions of the resulting datacube are mJy beam-1 in 5 km s-1 channels. The final cube measures pixels of per pixel and 64 channels of 5 km s-1 width. The maps are corrected for primary beam attenuation.
In order to search for weak features, the maps presented in this paper were produced with a robust parameter of 2.0, thus close to natural weighting, which results in the lowest noise (highest signal-to-noise ratio). The resulting RMS level is mJy beam-1, and the synthesized angular resolution (). In order to create an integrated brightness CO(2-1) map, we explored different moment maps but due to the high dynamic range of the data many faint features stayed hidden in the noise. We therefore manually identified channels with maximum brightness in each pixel of the mosaic and integrated the spectrum only over a limited range of channels centered around the maximum channels (using the astropy python package; Astropy Collaboration et al., 2013). To determine the number of integrated channels we identified velocity widths of individual CO features and adapted the number of integrating channels accordingly. With this procedure we were able to reach better results than with the standard moment maps. The velocity field map was constructed using an analogous method.
The uncertainties in the CO flux are estimated to be about . These include calibration uncertainties, CO flux errors arising from manually selecting the areas of the CO features, as well as the channels included in their integrated spectra.
2.1 Compact-to-extended molecular ratio
We use our previously obtained single-dish observations of ESO 137-001 with APEX (Jáchym et al., 2014) to make a direct comparison of the CO fluxes detected with APEX and ALMA in a number of common apertures. While in the main body of the galaxy the APEX and ALMA fluxes are consistent (flux ratio of ), in the tail regions the APEX-to-ALMA ratio increases to values of . This suggests that while in the main body of the galaxy both telescopes reveal about the same amount of CO emitting gas, in the tail regions the ALMA observations (which included ACA) resolve out of the CO emission. This is mainly due to missing total power observations and short-spacings leading to loss of extended, low surface brightness emission in the ALMA data. The RPS tail thus may be dominated by a diffuse, possibly warmer, subthermally excited molecular component (e.g. Pety et al., 2013) distributed on spatial scales larger than kpc, which is the largest recoverable scale in our ALMA observations. Moreover, the ratio of the APEX-to-ALMA fluxes increases with distance along the tail, implying that the fraction due to an extended component becomes larger further out in the tail.
We assume that for the compact features visible in the ALMA map and discussed further in this paper, the standard (Galactic) CO-to-H2 conversion factor is applicable, while in the extended diffuse CO emitting component, it may be by a factor of a few lower (e.g., Bolatto et al., 2013). The uncertainty in the value of the conversion factor does not affect our conclusions. Assuming that the extended CO emission is distributed smoothly along the tail, it is likely that locally the fraction of retrieved (compact) emission by ALMA is much larger, possibly near 90%. Spitzer IRS showed warm H2 in the inner tail (Sivanandam et al., 2010). What is the origin of the diffuse molecular component, and why it supposedly is stable against (gravitational) instabilities and thus does not form stars will be a matter for future studies.
3 Results
3.1 Overall CO distribution and kinematics and relation to tail morphology
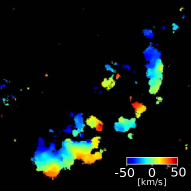
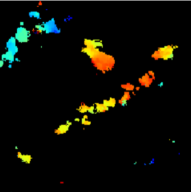
In Fig. 2 we show the total CO(2-1) intensity and velocity maps of ESO 137-001 and its tail, and in Fig. 3 we show the CO intensity overlaid on HST and H images. In Fig. 2 the maps are rotated (see the arrows indicating North and East directions). The RPS tail extends toward the right-hand side of the mosaic, in a NW direction on the sky. Besides the bright CO-emitting molecular gas in the main body of the galaxy, the map reveals a rich distribution of mostly compact CO emission regions detected in the tail out to nearly 60 kpc distance from the disk, and over a lateral extent of about 24 kpc. CO clumps are associated with all three tail components – the northern ’orphaned’ regions, the central tail, as well as the secondary southern tail.
The CO emission in the main body of the galaxy is confined to the central region out to a radius of about kpc (S-N). This is the region of the galaxy disk where stripping is currently active. The stellar disk beyond this radius has already been stripped (except in the north where there is a CO clump at from the disk center). The amount of CO flux in the disk area (within a area centered along the disk) is Jy km s-1. The integrated flux corresponds to an H2 mass111We follow the standard relation for the CO(1-0) luminosity of Solomon & Vanden Bout (2005), and assume the ratio of CO(2-1)-to-CO(1-0) of 0.8 (e.g., Leroy et al., 2009), and a CO/H2 conversion factor of cm-2(K km s that is standard under the Milky Way disk conditions (e.g., Bolatto et al., 2013). A factor of 1.36 is included to account for helium. of , and an average face-on gas surface density within the central kpc of about pc-2. Such a surface density is typical for the center of gas-rich spirals, and high enough to make the gas resistant to rapid ram pressure stripping.
Outside the main body, the brightest part of the tail is the central component with a total CO integrated flux of Jy km s-1, which corresponds to . It extends to kpc from the disk. It is brightest in its innermost parts – within a mere 2.5 kpc adjacent to the disk, about 40% of the total CO flux is encompassed. By contrast, the lateral components of the tail contain much less molecular gas: the southern tail registers about Jy km s-1, which is of H2, whereas the northern ’orphaned’ regions contain Jy km s-1, i.e. . Thus, about 80% of the detected total tail CO flux is in the central component, while small fractions of are in the southern and northern regions. This indicates that the most imporant contribution to the molecular tail component comes from the relatively dense ISM most recently stripped from the central disk regions.
The total mass of the detected dense molecular gas in the tail is comparable to the total estimated X-ray gas mass of about , but larger than the upper limit estimate for neutral atomic gas of (Sun et al., 2006; Vollmer et al., 2001b; Jáchym et al., 2014).
The velocity structure shown in the bottom panel of Fig. 2 is dominated by the galaxy’s rotation that is imprinted into the stripped gas: most of the northern emission regions are blue-shifted relative to the tail centroid while those in the south are mostly red-shifted. Due to the galaxy’s orbital motion that is mostly in the plane of the sky, a velocity gradient along the tail is absent. A similar velocity structure was reported also from the early H observations (Sun et al., 2010) and later confirmed from the detailed MUSE H map (Fumagalli et al., 2014). The CO velocity dispersion is typically km s-1 in most clumps but larger ( km s-1) in the galaxy and the brightest regions of the inner tail.
3.2 Compact molecular component of the tail
The spatial resolution of the present ALMA observations of pc does not allow us to resolve individual GMCs that in galaxies have typical sizes of the order of pc. Besides some unresolved clumps, most of the detected CO emission regions in the tail of ESO 137-001 are larger structures, some with a clear substructure. Typical CO clumps have masses characteristic of GMCs or giant molecular associations (GMAs) of , but their sizes (and also velocity dispersion) are larger ( pc). This suggests that the clumps are not gravitationally bound and will likely disperse with time. For the selection of the CO clumps described in the present work, we can estimate their virial parameter . Following Bertoldi & McKee (1992),
| (1) |
where , , and are a clump’s velocity dispersion, radius and mass, respectively (see the CO spectra in Fig. 5). The parameter spans a range of which indicates subcritical structures (non-magnetized clouds are expected to have critical virial parameters ; e.g., Kauffmann et al., 2013). This supports the above mentioned suggestion that molecular clumps will dissolve with time, however the uncertainty of these estimates may be large. A detailed study of the molecular clump population detected in the ALMA data in the tail and its relationship to the star-forming regions will be the subject of a future paper. Also in the narrow RPS tail of the Coma galaxy D100, stellar sources were measured to be much larger than single gravitationally bound star clusters, indicating they are likely to be unbound and disperse (Cramer et al., 2019).
3.3 Multi-phase view of the RPS tail
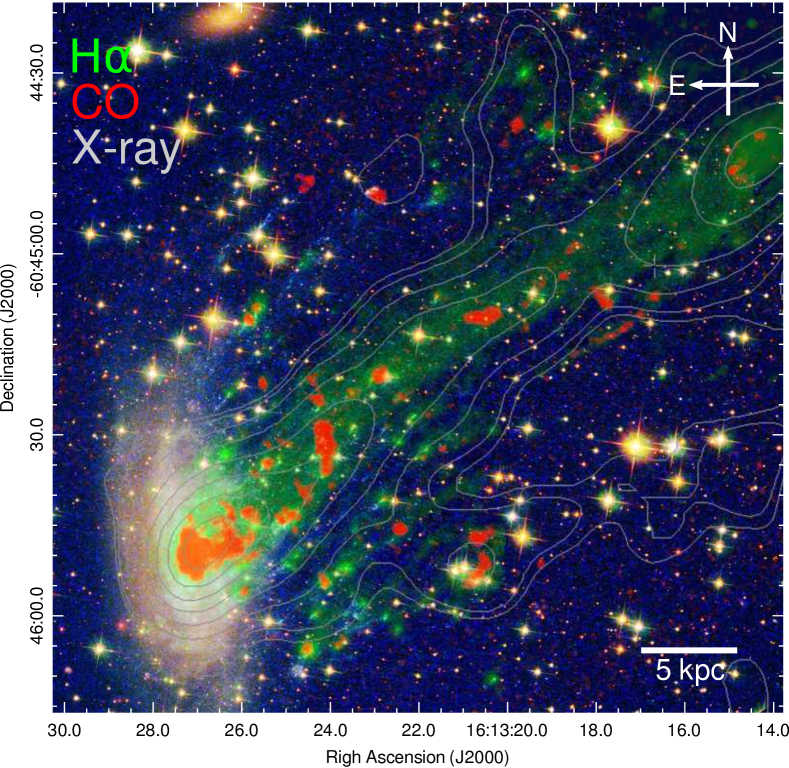
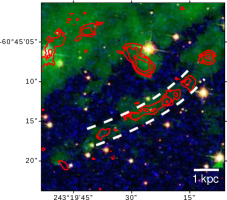
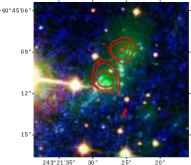
In Fig. 3, the CO(2-1) intensity map (red) is overlaid with H (green) and HST UV-visible-nearIR composite images, covering about the inner half of the length of the (X-ray) tail. Contours of X-ray emission are added into the overlay (Sun et al., 2010). The image indicates various levels of correlation between the CO, H and young stars. It also clearly shows that the narrow central tail is connected to the CO-emitting molecular gas still in the central parts of the main body of the galaxy. The CO clumps detected outside the main body of the galaxy are associated with all tail components, but in comparison to the more extended H distribution, the CO emission comes from more compact regions. Given that the CO emission traces a relatively dense gas phase (see Sec. 2.1), the ALMA CO observations reveal for the first time the dense ”skeleton” of the multi-phase gaseous tail, as well as the component that forms the stars that are visible in the HST image. The overlay image in Fig. 3 offers the most complete view of the spectacular RPS tail up to now, with the CO, H, and X-ray emitting gas components, as well as the regions of young star formation.
3.4 Molecular gas tail morphology and RPS history
The overall molecular gas distribution in the tail roughly follows the distribution of the other gas phases and reflects the stripping history of the disk. The lateral extent of CO in the tail is much broader than the lateral extent of CO in the disk. This is because RPS generally acts from the outside in, and outer disk gas is generally stripped earlier and forms the broadest parts of the tail. The broadest parts of the tail (the northern and southern components) originated from outer disk regions that were fully stripped some time ago. The kinematics support this with red- and blue-shifted velocities in the parts of the tail furthest from the tail centroid (Fig. 2).
The complex morphology of the multi-component tail of ESO 137-001 is not consistent with the simple outside-in stripping. The continuous central long component of the tail that is also bright in CO and that connects to the CO in the main body of the galaxy, extends much further out than the innermost northern tail component, and it is also spatially separated from both the northern and southern components. This indicates that the central few kpc of the galaxy has been experiencing stripping at the same time as the outer disk. In a galaxy with ISM substructure, the ICM wind may penetrate through low density parts of the disk, and multiple radii may be stripped simultaneously (e.g., Quilis et al., 2000). This is what we think is likely happening in ESO 137-001.
The timescale of gas stripping depends on the galaxy’s orbit in the cluster, as well as on the gas column density. Semi-analytic modeling indicates that ESO 137-001 is currently only Myr before pericenter along a highly radial orbit with a large orbital speed km s-1 and the corresponding peaked ram pressure time profile having a FWHM Myr (Jáchym et al., 2014). For the range of column densities corresponding to the mean values of the typical CO clumps detected in the tail, we can calculate the distances along the tail which stripped disk gas parcels have reached and their corresponding travel times: from e.g. 2 kpc radius in the disk, a gas clump with the column density of 10 (20 or 30) pc-2 was pushed to 80 (20 or 7) kpc distance along the tail in the last 200 (90 or 50) Myr. From outer disk radii, stripping has started much earlier along the orbit and the stripped gas reaches much larger distances. These calculations neglect all hydrodynamic effects as well as the internal structure of gas clouds. It is interesting to compare the above estimates with the travel times if a constant value of the current RP ( dyne cm-2) is applied instead of the time-evolving RP and the restoring force of the galaxy is neglected: 83 (58 or 42) Myr, respectively.
The new observations also show the asymmetry between the northern and southern tail components. There are prominent isolated CO clumps in the northern tail occurring to nearly 40 kpc from the main galaxy, whereas in the southern tail clumps are found only out to kpc (with some marginal detections at larger distances). The asymmetry of the tail is likely caused by the effects of disk inclination with respect to the ram pressure direction. The interaction with the ICM wind is not face-on but tilted222The wind angle, i.e., the angle between the disk plane and the direction of the wind, has a value of , following from the disk position angle (), the disk inclination angle (, HyperLEDA), the position angle of the tail () and an assumption that the tail follows the past orbital path. The wind angle is thus a complementary angle between the wind vector and the normal vector to the disk plane . by which means that the rotation of the galaxy affects the trajectories of the stripped gas in an asymmetric manner, depending on whether the gas rotates with or against the ICM wind.
Thus different parts of the tail are at different evolutionary stages of stripping: the central component is still being fed by the galaxy, while the outer, northern and southern components represent later evolutionary stages, since these parts of the tail are no longer being fed from the galaxy. The northern tail component appears to be at later evolutionary stage than the southern component, as it has less diffuse H and X-ray emission with isolated (’orphaned’) dense CO and H clumps apparently left behind the more diffuse gas. Despite their different ages, all three tail components are found to host molecular gas and also young stars.
4 Origin of large molecular structures detected in the tail
In the following section we focus on several distinct features that may prompt a new perspective on the origin and evolution of dense gas in the stripped ISM. Two physical scenarios are usually considered, either the molecular gas has formed in situ out of stripped atomic gas (in-situ formation), or some pre-existing molecular gas contributed to it (direct stripping). The central tail component is in the earliest evolutionary stage, in the sense that gas is still being fed to it from the main galaxy. We therefore might expect to find within it molecular gas concentrations at relatively early evoelutionary stages, including some that have recently formed. We describe two distinct CO complexes in the central tail, one of which may have formed from a large gas structure originating in the galaxy disk, and another which may have formed in situ.
4.1 Large feature tilted from the tail axis
At about 9.5 kpc from the galaxy, we find an extended bright CO feature that is tilted from the tail axis (see the CO velocity field and integrated CO spectrum in Fig. 4, top panel), nearly parallel to the main disk. It is about long and wide ( kpc). Its total integrated flux is Jy km s-1, corresponding to . The velocity of the structure ranges from to 20 km s-1, with a gradient along its length in the N-S direction.
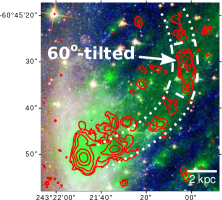
The feature may be part of a longer structure that extends through the inner tail and bends upwards (see dotted lines in Fig. 4). The fact that it is tilted at a large angle with respect to the main tail direction, and is possibly connected to the gas in the galaxy, strongly suggests it originated from a large dense gas complex in the galaxy, such as a spiral arm, that was gradually removed from the disk by ram pressure. The reason is that the flow in the downstream direction naturally makes elongated gas features in the tail direction, but does not naturally create structures oriented at an angle to the tail direction. To directly entrain dense, large clumps, dynamical effects can help. In a tilted ram pressure orientation, some larger structures may have a rotation velocity component in the direction of the wind, and in combination with a locally enhanced gravitational potential (e.g., by overdensities in spiral arms), they may be pushed gradually by the wind instead of being disrupted.
The -tilted feature is an example of a dense structure of the RPS tail that remained hidden in the previous observations – neither H, nor X-rays show an associated coherent structure, and there is also no excess of young stars. In Sec. 3.4 we estimated that a gas clump with the column density of pc-2 at 2 kpc disk radius has been pushed to kpc from the disk in the last 50 Myr. Despite the simplicity of the model, it matches well the mean column density ( pc-2) and location of the -tilted feature, and thus indicates that the (stripping) age of the feature is Myr. This time also corresponds to (less than) one half of the galaxy rotation period (for the galaxy rotation velocity of km s-1; Jáchym et al., 2014). The observed shape of the CO structure connecting the -tilted feature to the main galaxy that is not twisted but forms a single arc, is consistent with this evolutionary path.
The main issue for the direct stripping scenario is the survival of molecular clouds in the presence of the disruptive effects of the hot ICM wind, notably to the Kelvin-Helmholtz (KH) and Rayleigh-Taylor instabilities. The crushing time of a cloud with a radius in a wind with a speed can be approximated by the time it takes for a shock to propagate through the cloud (Klein et al., 1994):
| (2) |
where is the density contrast between the cloud and the wind. For clouds with parameters of typical GMCs the crushing time due to a km s-1 wind is rather short, yr. For larger clumps it is longer, yr, which is comparable to their travel (drag) time to the inner regions of the tail by ram pressure. Some physical processes may protect the clouds and prolonge their lifetime, such as magnetic fields which reduce the growth rate of the KH instability (e.g., Kauffmann et al., 2013). Also radiative cooling effectively extends the lifetime of dense clouds by replenishing the cold gas and preventing complete mixing with the hot wind (e.g., Cooper et al., 2009). Since the cooling time is shortest for the densest gas, it will be the densest gas clouds that are stripped that will form most of the extraplanar molecular clouds, such as the -tilted feature. It is thus possible that direct stripping is a viable scenario for the origin of the CO-bright large features observed in the inner parts of the tail, close to the main galaxy.
4.2 Large feature parallel to the main tail, with clumpy substructure
Another large CO feature in the central tail component is a linear structure located at nearly 30 kpc from the galaxy, somewhat south of the central tail (Fig. 4, bottom panel). It is longer, thinner, with more substructure than the -tilted feature, and, most substantially, it is parallel to the main tail direction. Along its length of kpc, at least 8 clumps are identified. Some of the clumps are resolved but the width of the feature is mostly unresolved at . The total CO flux of nearly 2 Jy km s-1 corresponds to . The masses of individual clumps are typically . Their characteristic separation in the filament is kpc. The radial velocity range of the structure is to km s-1 with no apparent velocity gradient along its length (although the inner half is at somewhat lower velocity than the outer half).
While there is diffuse H observed along the entire feature, there are virtually no young stars or associated compact H peaks. This implies that the CO filament is relatively young, unevolved with respect to star formation. Moreover, it is located far from the galaxy and is oriented parallel to the main tail. These characteristics make it consistent with a dense gas filament formed recently in situ in the tail from a less dense gas. It then fragments via a gravitational instability, forming a regular substructure of molecular clumps, which may eventually form new stars. Thanks to the offset location from the main part of the central tail, the CO filament is a particularly clear example of a possible in-situ formation.
From the theory of fragmentation of self-gravitating isothermal, hydrostatic cylinders, following the analysis in e.g., Mattern et al. (2018), we can estimate the most unstable scale:
| (3) |
where is the central density of a filament in virial equilibrium, is the sound speed, and , , and represent the isothermal temperature, the mean molecular weight and the mass of hydrogen atom, respectively. For the mean density calculated for individual clumps from their masses () and sizes ( pc), and assuming K to calculate the sound speed, the corresponding fragmentation lengthscale is pc, which is within a factor of consistent with the observed clump separation in the filament. The predicted value would be higher and thus match better the observed separation when a turbulent medium is assumed, in which the velocity dispersion is higher than the sound speed. While these estimates are strongly simplified by neglecting the presence of an external pressure, rotation, magnetic fields, as well as by using mean densities, they suggest that fragmentation due to self-gravity is taking place in the stripped gas.
In addition to the central filamentary structure, the most distant CO emission region detected at about 58 kpc from the galaxy also has a linear morphology. It is shorter, composed of at least three clumps with total integrated flux of Jy km s-1, thus about , and is oriented roughly along the tail direction (see Fig. 2). The flow of matter in the downstream direction naturally creates elongated gas features in the tail direction that may eventually cool down, condense and fragment. The two CO filamentary structures may provide the first direct evidence for molecular gas formation in-situ in RPS tails.
The importance of the scenario of molecular gas formation in the tail is supported also by the large total amount of molecular gas revealed in the tail in the present observations (plus taking into account the more extended component; see Sec. 2.1). Following the scaling relations of e.g., Catinella et al. (2018), for an unperturbed galaxy with a stellar mass , the expected total gas fraction is , and the molecular-to-atomic gas mass ratio , thus the estimated pre-stripping H2 content of ESO 137-001 is . While such estimates may vary by almost an order of magnitude at fixed stellar mass, this value is well consistent with the detected amount of . This suggests that the galaxy is not H2-deficient. But it is strongly HI-deficient, following an expected pre-stripping HI content of and a weak upper limit obtained from ATCA (the Australia Telescope Compact Array) observations of (Vollmer et al., 2001b). Thus, there was in principle enough stripped HI to account for the observed H2 content.
Recent simulations of the evolution of cold ( K) gas in a hot galactic wind have shown that if the cooling is fast () and if the clouds are sufficiently large, they can withstand longer mixing times due to the KH instability, and new cold gas may form far downstream from the clouds from a “warm” mixture of the cold gas and hot wind (Gronke & Oh, 2018). Moreover, in the simulations the amount of the newly formed cold gas may exceed the original cold gas in the clouds. Assuming that the K gas in the simulations can cool further down to reach typical temperatures of molecular gas, this process could help to understand the origin of the large total H2 content of ESO 137-001.
In order to turn the stripped cold gas (HI) into a molecular phase, the presence of dust is crucial. HST imaging of the galaxy clearly shows prominent dust features in the W side of the disk and the inner tail. In addition, Herschel SPIRE imaging (S. Sivanandam et al., in preparation) reveals a dust trail emanating from the galaxy in the direction of the gas tail. Other optical observations (e.g. HST) of RPS galaxies show clearly dust being stripped from the galaxies along with the gas (Elmegreen et al., 2000; Abramson et al., 2016; Cramer et al., 2019).
Interestingly, the physical scenarios of direct stripping and in-situ formation are also relevant for galactic winds, which can have a cold gas component associated with the hot gas in outflows (see e.g., Banda-Barragán et al., 2019), and for brightest cluster galaxies, which can have molecular gas filaments extending radially from the galaxies (e.g., Vantyghem et al., 2019).
5 Dynamical separation of gas from newly-formed stars in the tail
Within the tail the degree of correlation between individual gas phases and star formation varies (Fig. 3). One can find examples of CO clumps with and without young stars or HII regions, and vice versa. Much of this variety is likely due to different evolutionary stages of star formation. While a similar large range in CO/young-star ratios can be found in normal galaxies, the distribution of the features in the tail and their morphology are particular and characteristic to RPS tails. This is caused by dynamical separation – denser, more compact (molecular) clumps are less accelerated by ram pressure and lag behind more diffuse gas. Newly formed stars decouple from the surrounding gas and if they have not reached the escape velocity, they fall back toward the galaxy. Effects of differential acceleration of individual phases of the stripped ISM by ram pressure were indicated previously from observations (e.g., Vollmer et al., 2008; Jáchym et al., 2017).
Numerous linear streams of young blue stars of different lengths parallel with the tail direction which are distributed in all three tail components are visible in the HST image (see Fig. 3). The ages of the young star clusters range from a few Myr to Myr and are consistent with formation in the tail after stripping. The details will be discussed in Waldron, Sun et al. (in prep.). Some stellar and gaseous features are physically linked, forming fireballs: a star-forming cloud with a linear stream of young stars extending toward the galaxy. Fireballs were previously observed in several RPS galaxies (Cortese et al., 2007; Yoshida et al., 2008, 2012; Kenney et al., 2014). A simple model of fireballs was introduced by Kenney et al. (2014).
5.1 Fireballs – linear streams of young stars with molecular clouds at heads
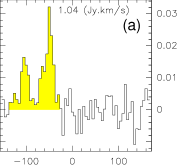

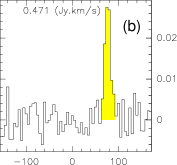
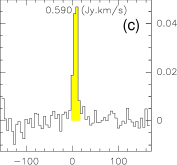
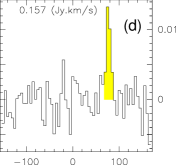
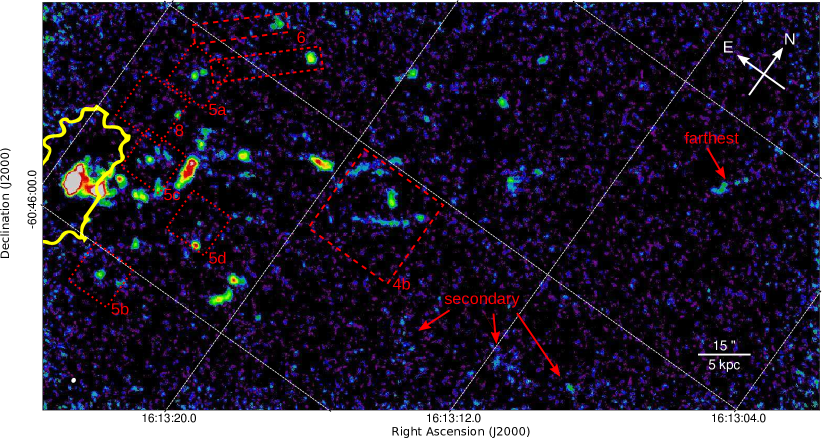
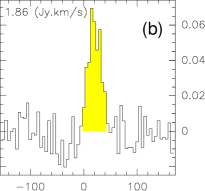
CO clumps with offset small streams of young stars extending towards the galaxy are found in all three tail components. Four examples of fireballs are shown in Fig. 5. The stellar streams have lengths of arcsec, i.e., kpc and are all oriented roughly parallel to the tail direction. The CO clumps at the heads of the fireballs are associated with compact H (HII) regions. Some components of fireballs (H and young stars) have previously been observed, but this is the first time the important molecular component has been detected.
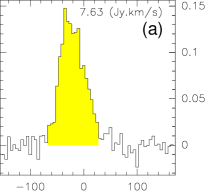
Fig. 5 also shows integrated CO spectra of the clumps at the heads of fireballs. The integrated CO fluxes are typically Jy km s-1, thus about , but some are fainter with an integrated CO flux of Jy km s-1, i.e., . The typical sizes of the CO clumps are pc, but some are smaller, pc. Linewidths are km s-1. Many other fireballs in the tail have compact H clumps at their heads but no detected CO emission, similar to fireballs observed previously in other galaxies. This may indicate a different evolutionary stage in which molecular gas has already been consumed by star formation.
While we cannot measure the velocity structure of the fireballs due to the orientation of the orbit of ESO 137-001 in the plane of the sky, it is clear that their kinematics evolves with time. It depends on the timescales of RP acceleration, gravitational acceleration from the galaxy, cloud condensation and star formation. The newly formed stars gradually decouple from the gas clump and may eventually start falling back toward the galaxy if they have not reached the escape speed. Simple modeling with a realistic time-varying ram pressure and a galactic potential (adopted from Jáchym et al., 2014) shows that a separation of kpc between the parent gas cloud and a decoupled star (modeled as a high-column-density parcel) establishes within typically (a few) 10 Myr. Thus the observed fireballs (including those shown in Fig. 5) are most likely dynamically young structures with molecular clumps at their head that have been actively forming new stars over the past Myr.
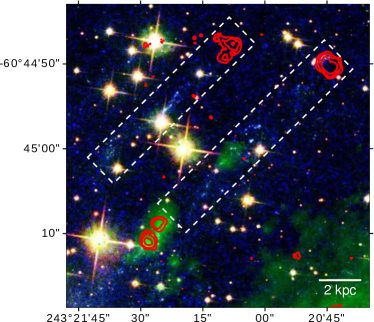
5.2 Superfireballs
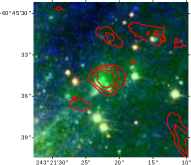
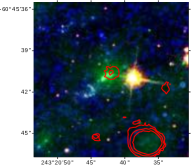
In the northern component of the tail, close to the disk, we find possible examples of much larger fireballs. In this part of the tail, which likely is in a later evolutionary stage of stripping, there is no diffuse X-ray or H emission, but distinct streams of young stars, HII regions (compact H sources), and bright CO clouds. Most of the young stars seen in the HST image in this region fall within two linear streams kpc in length, parallel to the main tail (see a closeup in Fig. 6).
Each of these streams have CO clouds coincident with or somewhat beyond the outermost stars (in the downstream direction). This is consistent with the fireball scenario. The CO clouds have diameters of and , i.e., pc and pc (but with possible substructure); their linewidths are and km s-1, and H2 masses and , respectively for the E and W structures. The long streams do not have young stars extending continuously to the CO cloud or along the length of the streams. This indicates that molecular clouds in tails may survive after a period of active star formation ends, and possibly go through several more phases of star formation activity. For example, the western fireball shows an H compact feature (with no detected associated CO emission) in its inner half. If not simply due to the effects of projection, this could correspond to a previous episode of condensation when denser (pre-stellar) fragments decoupled from a parental clump. The latter continued to be accelerated further by ram pressure in the downstream direction and condensed again only recently. The multiple features are then parts of one large-scale structure. In this picture small-scale fireballs in fact can be part of large-scale fireballs. We note that the locations of the two CO clumps at the heads of the large fireballs lay outside the MUSE area but previous SOAR observations show bright compact H emission associated with at least the western CO clump (Sun et al., 2007).
Superfireballs, due to their lengths, are expected to be dynamically older structures than the small-scale fireballs. This is consistent with their location in the northern outer tail component. Our modeling shows that Myr is needed to develop a separation of kpc between the parent cloud and decoupled stars. We may also be seeing superfireballs in the process of formation in the southern tail component. There the sensitive MUSE H observations reveal many elongated structures (see Fig. 3), some of which show a head-tail morphology – with diffuse tails extening away from the galaxy and compact clumps at the heads situated closer to the galaxy (sometimes associated with CO emission). Some are aligned into long coherent structures, encompassing other H compact clumps. It is possible that with ongoing ram pressure the diffuse component will be cleared out of the structures and moved downstream along the tail, leaving behind ’nude’ structures of denser clumps and stellar streams, i.e., superfireballs.
5.3 Double-sided fireballs
Some of the H head-tail features in the tail are identified to be interconnected with fireballs. In addition to the Kenney et al. (2014) model, the tail of ESO 137-001 indicates that the fireballs may be double-tail features, with a second, gaseous tail of diffuse (H) gas that is ablated from the dense star-forming clump that extends in the opposite direction to the stellar tail - away from the galaxy. The central dense clump of a fireball is bright in H and possibly also in CO emission. A cartoon of the model of the double-sided fireballs is shown Fig. 7. Similar features of considerable lengths were previously found in the RPS tail of the Coma galaxy RB199 (Yoshida et al., 2008), although without any associated molecular component yet observed.
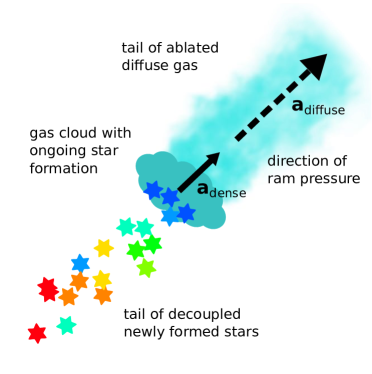
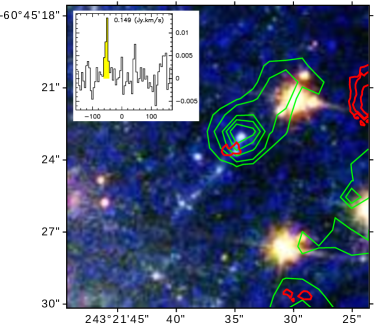
An example of a double-sided fireball is given in Fig. 8 which shows a compact HII region associated with a (slightly offset) weak CO clump at the head of a small fireball with a diffuse tail extending along the direction of the wind. It is located in the northern component of the tail, close to the main galaxy. The associated CO emission region has an H2 mass of . More similar structures (though less clear and without detected associated CO clumps) may be found mainly in the southern tail component.
6 Conclusions
We observed with ALMA in CO(2-1) the ram pressure stripped tail of the Norma cluster galaxy ESO 137-001, one of the nearest jellyfish galaxies. The observations covered at pc resolution nearly the full extent of the multi-component H and X-ray tail - the central tail, the northern ’orphaned’ regions, as well as the southern tail component. It is the first time that a high-resolution map of cold molecular gas in a ram pressure stripped tail has been acquired and together with observations at other wavelengths it offers the most complete view of the spectacular RPS tail to date. The main results of a first analysis of the CO map and a comparison with observations at other wavelengths are:
CO emission arises from a rich distribution of mostly compact clumps detected in the tail out to nearly 60 kpc distance from the disk, and over a lateral extent of about 24 kpc. The CO clumps are associated with all three components of the tail that are likely in different evolutionary stripping stages.
Most of the detected CO clumps in the tail are larger structures with masses of Galactic GMCs and GMAs, but with sizes and linewidths that are larger than is typical of those found in the Galaxy. Estimates of their virial parameters indicate that the molecular clumps are not gravitationally bound and will disperse with time. The CO velocity field in the tail is dominated by the galaxy’s rotation that is imprinted into the stripped gas – most of the northern regions are blue-shifted, while those in the southern tail component are mostly red-shifted, relative to the tail centroid.
In total of H2 was revealed in the tail, assuming the standard Galactic CO-to-H2 conversion factor. Comparison of fluxes of the ALMA+ACA observations with previous single-dish (APEX) observations indicate that in addition to the compact CO features there is a substantial component of extended (scales ) molecular gas in the tail. Its fraction increases with distance from the parent galaxy. ESO 137-001 is molecular rich – the total amount of H2 detected in the galaxy and the tail likely exceeds the pre-stripping molecular content of the galaxy.
From the morphology of some CO features we can infer their origin in the tail. For example, filamentary structures oriented parallel to the tail direction and located at large distances from the disk have likely formed in-situ, through fragmentation via gravitational instability. Other CO features, such as the large clump in the inner central tail, tilted from the tail axis, may have formed from dense gas clumps, such as a spiral arm, stripped gradually from the disk. These CO features do not form distinct structures in H or X-ray emisison, and there is also no associated excess of young star formation. Simple analysis estimates their ages to Myr.
The overall CO distribution in the tail roughly follows the distribution of the other gas phases and the regions of young star formation, but at small scales the degree of correlation varies. It is the distribution of the features and their morphology that are particular and characteristic to RPS tails. Numerous ’fireball’ features with CO clumps at their heads and tails of young stars (typically kpc) pointing towards the main galaxy are found in all three tail components. Newly formed stars decouple from the surrounding gas – those in the outer tail probably escape from the galaxy but the inner tail stars fall back onto the galaxy leading to halo stellar streams. Several much longer fireballs (lengths of kpc) are also observed, especially in the northern regions of the tail, that may be in an older evolutionary stripping phase. The small fireballs are likely dynamically young structures ( Myr) while their larger relatives have ages of Myr.
We found that some linear H features, compact H emitting clumps, and young star regions may be interconnected into double-sided fireballs. We propose a simple scenario based on dynamical separation of gas phases in which denser gas clumps pushed by ram pressure form stars that decouple from the clumps and create inward-pointing stellar tails, while at the same time the clumps are ablated by the strong ram pressure and tails of diffuse gas are formed in the opposite direction to the stellar tails.
References
- Abramson et al. (2011) Abramson, A., Kenney, J. D. P., Crowl, H. H., et al. 2011, AJ, 141, 164
- Abramson et al. (2016) Abramson, A., Kenney, J., Crowl, H., & Tal, T. 2016, AJ, 152, 32
- Astropy Collaboration et al. (2013) Astropy Collaboration, Robitaille, T. P., Tollerud, E. J., et al. 2013, A&A, 558, A33
- Banda-Barragán et al. (2019) Banda-Barragán, W. E., Zertuche, F. J., Federrath, C., et al. 2019, arXiv:1901.06924
- Bertoldi & McKee (1992) Bertoldi, F., & McKee, C. F. 1992, ApJ, 395, 140
- Bolatto et al. (2013) Bolatto, A. D., Wolfire, M., & Leroy, A. K. 2013, ARA&A, 51, 207
- Boselli et al. (2018) Boselli, A., Fossati, M., Ferrarese, L., et al. 2018, A&A, 614, A56
- Boselli et al. (2016) Boselli, A., Cuillandre, J. C., Fossati, M., et al. 2016, A&A, 587, A68
- Catinella et al. (2018) Catinella, B., Saintonge, A., Janowiecki, S., et al. 2018, MNRAS, 476, 875
- Chung et al. (2009) Chung, A., van Gorkom, J. H., Kenney, J. D. P., Crowl, H., & Vollmer, B. 2009, AJ, 138, 1741
- Chung et al. (2007) Chung, A., van Gorkom, J. H., Kenney, J. D. P., & Vollmer, B. 2007, ApJ, 659, L115
- Cooper et al. (2009) Cooper, J. L., Bicknell, G. V., Sutherland, R. S., & Bland-Hawthorn, J. 2009, ApJ, 703, 330
- Cortese et al. (2006) Cortese, L., Gavazzi, G., Boselli, A., et al. 2006, A&A, 453, 847
- Cortese et al. (2007) Cortese, L., Marcillac, D., Richard, J., et al. 2007, MNRAS, 376, 157
- Cramer et al. (2019) Cramer, W. J., Kenney, J. D. P., Sun, M., et al. 2019, ApJ, 870, 63
- Ebeling et al. (2014) Ebeling, H., Stephenson, L. N., & Edge, A. C. 2014, ApJ, 781, L40
- Elmegreen et al. (2000) Elmegreen, D. M., Elmegreen, B. G., Chromey, F. R., & Fine, M. S. 2000, AJ, 120, 733
- Finoguenov et al. (2004) Finoguenov, A., Briel, U. G., Henry, J. P., et al. 2004, A&A, 419, 47
- Fossati et al. (2012) Fossati, M., Gavazzi, G., Boselli, A., & Fumagalli, M. 2012, A&A, 544, A128
- Fossati et al. (2016) Fossati, M., Fumagalli, M., Boselli, A., et al. 2016, MNRAS, 455, 2028
- Fumagalli et al. (2011) Fumagalli, M., Gavazzi, G., Scaramella, R., & Franzetti, P. 2011, A&A, 528, A46
- Fumagalli et al. (2014) Fumagalli, M., Fossati, M., Hau, G. K. T., et al. 2014, MNRAS, 445, 4335
- Gavazzi et al. (2001) Gavazzi, G., Boselli, A., Mayer, L., et al. 2001, ApJ, 563, L23
- George et al. (2018) George, K., Poggianti, B. M., Gullieuszik, M., et al. 2018, MNRAS, 479, 4126
- Gronke & Oh (2018) Gronke, M., & Oh, S. P. 2018, MNRAS, 480, L111
- Gullieuszik et al. (2017) Gullieuszik, M., Poggianti, B. M., Moretti, A., et al. 2017, ApJ, 846, 27
- Gunn & Gott (1972) Gunn, J. E., & Gott, III, J. R. 1972, ApJ, 176, 1
- Guilloteau & Lucas (2000) Guilloteau, S., & Lucas, R. 2000, Imaging at Radio through Submillimeter Wavelengths, 217, 299
- Hester et al. (2010) Hester, J. A., Seibert, M., Neill, J. D., et al. 2010, ApJ, 716, L14
- Jáchym et al. (2014) Jáchym, P., Combes, F., Cortese, L., Sun, M., & Kenney, J. D. P. 2014, ApJ, 792, 11
- Jáchym et al. (2017) Jáchym, P., Sun, M., Kenney, J. D. P., et al. 2017, ApJ, 839, 114
- Kauffmann et al. (2013) Kauffmann, J., Pillai, T., & Goldsmith, P. F. 2013, ApJ, 779, 185
- Kenney et al. (2004) Kenney, J. D. P., van Gorkom, J. H., & Vollmer, B. 2004, AJ, 127, 3361
- Kenney et al. (2014) Kenney, J. D. P., Geha, M., Jáchym, P., et al. 2014, ApJ, 780, 119
- Klein et al. (1994) Klein, R. I., McKee, C. F., & Colella, P. 1994, ApJ, 420, 213
- Koopmann & Kenney (2004) Koopmann, R. A., & Kenney, J. D. P. 2004, ApJ, 613, 866
- Köppen et al. (2018) Köppen, J., Jáchym, P., Taylor, R., & Palouš, J. 2018, MNRAS, 479, 4367
- Lee & Chung (2018) Lee, B., & Chung, A. 2018, ApJ, 866, L10
- Leroy et al. (2009) Leroy, A. K., Walter, F., Bigiel, F., et al. 2009, AJ, 137, 4670
- Machacek et al. (2005) Machacek, M., Dosaj, A., Forman, W., et al. 2005, ApJ, 621, 663
- Mattern et al. (2018) Mattern, M., Kainulainen, J., Zhang, M., & Beuther, H. 2018, A&A, 616, A78
- McMullin et al. (2007) McMullin, J. P., Waters, B., Schiebel, D., Young, W., & Golap, K. 2007, Astronomical Data Analysis Software and Systems XVI, 376, 127
- Moretti et al. (2018) Moretti, A., Paladino, R., Poggianti, B. M., et al. 2018, MNRAS, 480, 2508
- Oosterloo & van Gorkom (2005) Oosterloo, T., & van Gorkom, J. 2005, A&A, 437, L19
- Pety et al. (2013) Pety, J., Schinnerer, E., Leroy, A. K., et al. 2013, ApJ, 779, 43
- Poggianti et al. (2017) Poggianti, B. M., Moretti, A., Gullieuszik, M., et al. 2017, ApJ, 844, 48
- Poggianti et al. (2019) Poggianti, B. M., Gullieuszik, M., Tonnesen, S., et al. 2019, MNRAS, 482, 4466
- Quilis et al. (2000) Quilis, V., Moore, B., & Bower, R. 2000, Science, 288, 1617
- Scott et al. (2018) Scott, T. C., Brinks, E., Cortese, L., Boselli, A., & Bravo-Alfaro, H. 2018, MNRAS, 475, 4648
- Scott et al. (2012) Scott, T. C., Cortese, L., Brinks, E., et al. 2012, MNRAS, 419, L19
- Scott et al. (2010) Scott, T. C., Bravo-Alfaro, H., Brinks, E., et al. 2010, MNRAS, 403, 1175
- Sivanandam et al. (2010) Sivanandam, S., Rieke, M. J., & Rieke, G. H. 2010, ApJ, 717, 147
- Smith et al. (2010) Smith, R. J., Lucey, J. R., Hammer, D., et al. 2010, MNRAS, 408, 1417
- Solomon & Vanden Bout (2005) Solomon, P. M., & Vanden Bout, P. A. 2005, ARA&A, 43, 677
- Sun et al. (2010) Sun, M., Donahue, M., Roediger, E., et al. 2010, ApJ, 708, 946
- Sun et al. (2007) Sun, M., Donahue, M., & Voit, G. M. 2007, ApJ, 671, 190
- Sun et al. (2006) Sun, M., Jones, C., Forman, W., et al. 2006, ApJ, 637, L81
- Sun & Vikhlinin (2005) Sun, M., & Vikhlinin, A. 2005, ApJ, 621, 718
- van Gorkom (2004) van Gorkom, J. H. 2004, Clusters of Galaxies: Probes of Cosmological Structure and Galaxy Evolution, 305
- Vantyghem et al. (2019) Vantyghem, A. N., McNamara, B. R., Russell, H. R., et al. 2019, ApJ, 870, 57
- Verdugo et al. (2015) Verdugo, C., Combes, F., Dasyra, K., Salomé, P., & Braine, J. 2015, A&A, 582, A6
- Vollmer et al. (2001a) Vollmer, B., Braine, J., Balkowski, C., Cayatte, V., & Duschl, W. J. 2001a, A&A, 374, 824
- Vollmer et al. (2001b) Vollmer, B., Cayatte, V., van Driel, W., et al. 2001b, A&A, 369, 432
- Vollmer et al. (2008) Vollmer, B., Braine, J., Pappalardo, C., & Hily-Blant, P. 2008, A&A, 491, 455
- Wang et al. (2004) Wang, Q. D., Owen, F., & Ledlow, M. 2004, ApJ, 611, 821
- Yagi et al. (2007) Yagi, M., Komiyama, Y., Yoshida, M., et al. 2007, ApJ, 660, 1209
- Yagi et al. (2010) Yagi, M., Yoshida, M., Komiyama, Y., et al. 2010, AJ, 140, 1814
- Yagi et al. (2013) Yagi, M., Gu, L., Fujita, Y., et al. 2013, ApJ, 778, 91
- Yoshida et al. (2008) Yoshida, M., Yagi, M., Komiyama, Y., et al. 2008, ApJ, 688, 918
- Yoshida et al. (2004) Yoshida, M., Ohyama, Y., Iye, M., et al. 2004, AJ, 127, 90
- Yoshida et al. (2012) Yoshida, M., Yagi, M., Komiyama, Y., et al. 2012, ApJ, 749, 43