PICO Collaboration
Data-Driven Modeling of Electron Recoil Nucleation in PICO C3F8 Bubble Chambers
Abstract
The primary advantage of moderately superheated bubble chamber detectors is their simultaneous sensitivity to nuclear recoils from WIMP dark matter and insensitivity to electron recoil backgrounds. A comprehensive analysis of PICO gamma calibration data demonstrates for the first time that electron recoils in C3F8 scale in accordance with a new nucleation mechanism, rather than one driven by a hot-spike as previously supposed. Using this semi-empirical model, bubble chamber nucleation thresholds may be tuned to be sensitive to lower energy nuclear recoils while maintaining excellent electron recoil rejection. The PICO-40L detector will exploit this model to achieve thermodynamic thresholds as low as 2.8 keV while being dominated by single-scatter events from coherent elastic neutrino-nucleus scattering of solar neutrinos. In one year of operation, PICO-40L can improve existing leading limits from PICO on spin-dependent WIMP-proton coupling by nearly an order of magnitude for WIMP masses greater than 3 GeV c-2 and will have the ability to surpass all existing non-xenon bounds on spin-independent WIMP-nucleon coupling for WIMP masses from 3 to 40 GeV c-2.
I Introduction
The search for direct evidence of dark matter interactions has led to the development of several technologies for dark matter detection pico60full ; lz ; supercdms_snolab ; cresstIII ; deap3600 ; newsg ; damic ; darkside20k . Such detectors are designed to be sensitive to keV-scale energy depositions coming from elastically-scattered nuclei following interaction with dark matter particles jungman ; bertone ; feng . Dark matter detectors searching for weakly interacting massive particles (WIMPs) are designed to be sensitive to rates ranging from events per kg-year to events per ton-year (depending on the probed dark matter mass) snomass . Excellent background controls and modeling are required to both operate such a detector and establish confidence that all detector backgrounds are well understood. To mitigate large rates from cosmic-induced backgrounds, these detectors are operated deep underground snolab . Remaining sources of background, including neutrons and alpha particles, come from natural radioactivity. The flux of neutrons incident on a detector must be reduced with shielding due to their ability to scatter off nuclei, mimicking a dark matter signal coupp4 . Alpha decays, which have MeV-scale energies and come from hard-to-remove decay chains like radon, must be rejected through some form of calorimetry picassoAP . This leaves beta, gamma, and neutrino radiation which primarily scatters off the electrons in the detector, unlike WIMP dark matter, in what are broadly categorized as electron recoil backgrounds. These are the subject of this work.
The PICO Collaboration uses superheated bubble chamber detectors to search for dark matter zacek ; pico60full ; pico60cf3i ; pico60c3f8 ; pico2lrun2 ; pico2lrun1 . A superheated state is achieved in liquid freon, typically C3F8 or CF3I, by lowering the system pressure below the vapor pressure of the fluid at constant temperature. An energy deposition in this metastable state will cause fluid to boil locally, nucleating a bubble that can grow to macroscopic scales to be optically detected. The bubble chamber technology is well-established in particle physics and has historically led to significant discoveries in beam experiments, most notably the weak neutral current weak1 ; weak2 . However, a dark matter search has an unknown signal arrival time, and thus requires a large cumulative exposure (kg-years). To accomplish this, the bubble chamber technology has been evolved by PICO to operate at increased energy thresholds where electron recoils are highly inefficient at nucleating bubbles. This results in a substantially higher live-fraction (on the order of 75), as is necessary for a dark matter search.
The nucleation energy threshold is traditionally determined by assuming a “hot-spike” of energy in the detector, and thus is referred to as a thermodynamic (Seitz) threshold, as is discussed in Section II. The calculated hot-spike threshold approximates the recoil energy turn-on measured in nuclear recoil calibration data from PICO cirte ; picoNR . At low (eV-scale) thresholds, it has been found to agree with charged particle nucleation as well tenner . Sufficient study had not been performed to justify the assumption that, in the more moderately superheated regime used for a dark matter search (keV-scale thresholds), the hot-spike nucleation process dominates for electron recoils.
Gamma calibration data from PICO, summarized in Section III, indicates that electron recoils in C3F8 are better explained by a new nucleation mechanism through production of secondary electrons, also known as -electrons. This new mechanism, presented in Section IV, does not follow traditional hot-spike nucleation models, as nuclear recoils in C3F8 appear to do. Meanwhile, gamma calibrations in CF3I are in better agreement with hot-spike nucleation, indicating a dominant nucleation mechanism otherwise absent (or suppressed) in C3F8. Even C3F8 chambers with residual iodine concentrations appear to follow a similar hot-spike nucleation curve as pure CF3I, indicating that this nucleation channel is much more efficient if available. In Section V, we discuss how this can be explained by Auger cascades in atoms with large atomic numbers (high-Z), a nucleation mechanism postulated by Tenner tenner . We use this mechanism to quantitatively explain (for the first time) the superior electron recoil rejection capabilities of C3F8 as compared to CF3I.
We apply these nucleation mechanisms to the simulated flux of external photons incident on the PICO-2L and PICO-60 dark matter detectors and compare the predicted electron recoil backgrounds against data in Section VI. Based on agreement between data and this model, we predict the backgrounds due to external gammas for the upcoming PICO-40L dark matter search. As a consequence of the presented model, we choose the thermodynamic operating conditions of future chambers to reduce electron recoil backgrounds without losing nuclear recoil sensitivity. This is achieved by operating at the lowest allowed pressure and tuning the temperature to the threshold desired. Incidentally, operation at lower pressures also has the advantage of improved acoustic signal, used in particle identification pico60cf3i ; acoustic_sims .
II Bubble Nucleation Threshold
Any fluid can be superheated if the pressure is smoothly lowered below the vapor pressure at constant temperature. This puts the fluid in a metastable (superheated) state, in which energy deposition will boil local pockets of fluid to nucleate bubbles. A higher degree of superheat corresponds to a lower energy threshold for bubble nucleation. In order to discuss the physics of bubble nucleation, we must first define this threshold, established by the Seitz model for “hot-spike” bubble nucleation seitz .
The condition for bubble growth is defined by the forces while the bubble is at the nanoscale. Specifically, there exists a critical vapor bubble size at which the bubble gas pressure (which acts to grow the bubble) balances the surface tension and liquid pressure (which act to suppress the bubble). Thus, the condition under which a bubble will continue to grow is defined as
| (1) |
where is the radius of a critically sized bubble. Note that is the pressure inside of the bubble, which is slightly lower than the saturated vapor pressure of the fluid at the operating temperature . This follows from the requirement that the bubble vapor and surrounding liquid be in chemical equilibrium. From the the relation , where is chemical potential and is density, one obtains for a gas state with constant compressibility and an incompressible liquid state
| (2) |
where and are the saturated vapor and liquid densities of the fluid. We can thus consider the critical radius beyond which a bubble will continue to grow to be
| (3) |
For typical PICO operating conditions with C3F8, the critical radius is on the order of 20 nm.
Having defined the size of a critical bubble, we define several thermodynamic quantities related to the energy required to create a critically sized bubble. The minimum external work needed to create a bubble of critical size in a pocket of fluid is given by
| (4) |
This quantity, originally derived by Gibbs Gibbs , can be seen as the free energy of the surface, , minus the work done by the boiling superheated fluid as the bubble grows . The work done by boiling draws its energy from the thermal reservoir of the surrounding fluid, and so this quantity clearly does not apply when the nucleation site is warmer than the surroundings, as in Seitz’s so-called “hot-spike”. In this case, the appropriate quantity is the total energy (heat) required to create the critically-sized bubble, given by
| (5) |
Here, and are the specific enthalpies of the gaseous and liquid states, and is the density of the bubble. The (positive) term is added to capture the total energy of the surface, rather than just the free energy. A more detailed derivation of this threshold can be found in Appendix A. Notably, is found to describe the nuclear recoil energy threshold very well, indicating that the hot-spike is a good approximation for nucleation following a nuclear recoil cirte ; picoNR .
For the first time, we also consider a nucleation model wherein the heat required to vaporize the bubble interior may be supplied by the surrounding fluid, but the heat required to form the bubble surface comes from the particle interaction. In this scenario, described in more detail in Appendix B, we find the energy threshold to be
| (6) |
We will refer to this as the ionization energy threshold . It is worth pointing out that this is the total surface energy of the bubble plus the work done by the expanding liquid reservoir. For C3F8 operating conditions of 25 psia and 13.5∘C, we calculate to be 22.6 nm and , , and to be 0.07, 1.43, and 2.81 keV respectively. All fluid parameters used in this analysis are obtained using the NIST REFPROP database for a given set of pressure and temperature conditions refprop .
In order to explore the topic of electron recoil nucleation thresholds further, we find it convenient to write the probability of nucleation per “trial” as the negative exponential of some function of pressure and temperature
| (7) |
In the analysis presented here, and are unknown free parameters (with containing implicit assumptions about what constitutes a trial), and a functional scaling with pressure and temperature is imposed. Because the lowest level nucleation mechanism underlying each event is unknown, the definition of a nucleation trial is not clear. The COUPP Collaboration proposed a model wherein each photon scattering vertex was considered one trial, having a fixed nucleation probability coupp2 . In Section IV, we motivate that in C3F8 the number of nucleation trials for a single scattering vertex is proportional to the energy deposited, matching observations by PICASSO in C4F10 that nucleation probability scales with energy deposited picasso2005 .
Prior to this work, it has been assumed that coupp2 , but it can in principle depend on other thermodynamic quantities including any of the energy thresholds defined above and the critical radius . Including the latter in is motivated by the fact that superheated fluids are uniquely sensitive to the locality of energy deposition, or stopping power . Even for nuclear recoils, the total energy is deposited on a length scale roughly twice the critical radius SRIM , and as a result, the true efficiency turn-on for nuclear recoil events is slightly higher than picoNR . By comparison, electron recoils have more non-local energy deposition (much lower ) and are extremely inefficient at nucleating bubbles. Thus, instead of discussing the threshold for electron recoils purely in terms of energy, we discuss candidates for with units of .
For such a discussion, it is crucial to define the correct length scale. If we consider the detector immediately before nucleation, the radius of the liquid which contains the molecules of the fluid that will form the critically sized gas bubble can be written as
| (8) |
We will consider to be the length scale (5–10 nm) over which the threshold amount of energy must be locally deposited. To reflect that stopping powers are generally proportional to density, we additionally divide by the density of the liquid to compare the density-independent stopping power of the fluid. Thus,
| (9) |
and from Eq. (7) now carries information about the underlying stopping power of a nucleation trial in units of MeV cm2 g-1.
III Bubble Chamber Gamma Calibration
| Dataset | Detector | Fluid | Year Operated | Calibration Sources | Reference |
|---|---|---|---|---|---|
| 1 | PICO-0.1 FNAL | C3F8 | 2012-2013 | 137Cs | - |
| 2 | PICO-0.1 MINOS | C3F8 | 2013 | 137Cs | - |
| 3 | PICO-0.1 UdeM | C3F8 | 2014-2015 | 60Co,124Sb,137Cs,241Am | laurin |
| 4 | PICO-2L Run 2 | C3F8 | 2016 | 133Ba | pico2lrun2 |
| 5 | Gunter (UofC) | C3F8 | 2018 | 124Sb,133Ba | - |
| 6 | Drexel | C3F8 | 2018 | 137Cs | drexel |
| 7 | U. of Chicago | C3F8 (+ I+) | 2013-2014 | 57Co,88Y | alan |
| 8 | CYRTE | C3F8 (+ I+) | 2013-2015 | 88Y, 124Sb | alan ; baxter |
| 9 | PICO-60 | C3F8 (+ I+) | 2016-2017 | 60Co,133Ba, ambient | pico60c3f8 ; pico60full |
| 10 | PICO-2L Run 3 | C3F8 (+ I+) | 2017 | 60Co,133Ba, ambient | - |
| 11 | COUPP-2kg | CF3I | 2008 | 137Cs | coupp2 |
| 12 | COUPP-4kg | CF3I | 2012 | 60Co,133Ba | coupp4 ; fustin |
| 13 | U. of Chicago | CF3I | 2012-2013 | 88Y | alan |
The response of a bubble chamber to electron recoils is characterized using external gamma sources. A gamma calibration is performed for a single calibration source and pressure-temperature combination, which defines the thermodynamic state of a detector. Each dataset may contain multiple such calibrations, often for different superheated pressures at constant temperature. A summary of all such calibrations performed by PICO over the last decade is given in Table 1. A more detailed discussion of each experiment can be found in Appendix C. The rate of bubble nucleation when exposed to a gamma source is measured for each dataset. In order to remove subdominant nucleation rates from ambient radiation and the surfaces of the detector, the background rate without the source is subtracted. Only calibration data containing rates at least double the corresponding measured background rate are considered here.
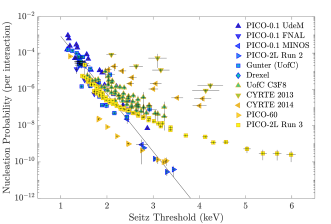
Simulations of different source and detector geometries are constructed to compare rates between calibrations. These simulations are performed in either GEANT4 GEANT or MCNPX-PoliMi MCNP such that, for each simulated photon scatter, the type of interaction and total energy deposited are recorded. Traditionally, measured rates have been normalized by the simulated rate of photon interactions and compared as a function of Seitz threshold, as shown in Figure 1. It was previously assumed that differences in electron recoil energy between interactions do not play a significant role as long as the total energy deposited was over the energy threshold. This model, which well describes bubble nucleation due to electron recoils in CF3I coupp2 (as per its original motivation), fails to describe bubble nucleation in C3F8, in some cases by many orders of magnitude. This failure points to an incorrect electron recoil nucleation model in C3F8. Without the ability to simulate inefficient electron recoil nucleation physics, we turn to data to help constrain a new nucleation model.
Some C3F8 calibration data were taken in chambers (U. of Chicago, CYRTE, PICO-60, and PICO-2L Run 3) that were previously filled with or exposed to CF3I, as noted in Table 1. Assays of the gasses from two of these chambers show residual iodine cross-contamination at levels too low to significantly affect the fluid properties of C3F8. However, the presence of residual, high-Z contamination can have an effect on photon attenuation in the fluid, and thus is included in each simulation at one part-per-thousand by molecular fraction (1 ppk = one iodine atom per thousand C3F8 molecules). We assume that simulated photoabsorption rates will scale linearly with iodine concentration below 1 ppk. As such, the simulated iodine photoabsorption rate (and by extension the iodine concentration) in each contaminated chamber is scaled by a free parameter in this analysis. Three published CF3I datasets (with known iodine concentration) are included from COUPP bubble chambers to provide leverage on the amount of residual iodine in the contaminated C3F8 data. These have been re-simulated with MCNPX-PoliMi MCNP to account for secondary x-rays produced by iodine photoabsorption that travel sufficiently far on the critical scale to be considered a separate vertex. In addition, the thresholds have been recalculated to include second-order corrections discussed in Appendix A.
IV Delta-Electron Bubble Nucleation
Because electron recoils in C3F8 are non-local on the scale of the critical radius, unlike nuclear recoils, we can consider that each -electron produced over an ionization track acts as a nucleation trial, rather than each photon scattering vertex. In fact, data from PICASSO has previously shown that electron recoil nucleation probability scales with -electron production in C4F10 picasso2011 . We approximate the probability of a single -electron to nucleate a bubble by considering instead the probability of bubble nucleation per total energy deposited. This is justified by the fact that the -electron spectrum is independent of incident particle energy picasso2005 .
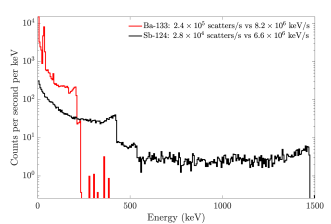
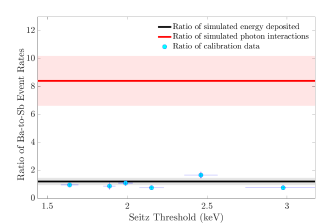
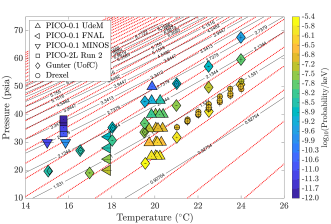
We directly probe this assumption using the Gunter bubble chamber at the University of Chicago (see Table 1) by comparing the observed rates from 124Sb and 133Ba calibration sources. We place the two sources such that simulations predict approximately the same rate of energy deposited and a factor of 8 difference in the rate of photon scatters. This difference is a consequence of the different energy spectra of the two sources, shown in Figure 2. The observed ratio of Ba-to-Sb rates (combined value of ), shown in Figure 3, favors nucleation probability scaling with energy deposited (p-value ) and rejects the original hypothesis of nucleation probability scaling with the number of scattering vertices (p-value ). The measured nucleation probability per keV of energy deposited through electron recoils is shown in Figure 4 for all pure C3F8 calibration data.
In this section, we consider two possible models for bubble nucleation by -electrons wherein the probability of nucleation scales with a stopping power “threshold” according to Eq. (9): nucleation by heat () and nucleation by ionization (). While motivation for these mechanisms is included in the following paragraphs, the reader should consult seitz ; tenner ; glaserCavitation ; peyrou for a more detailed historical discussion of bubble nucleation.
IV.1 Nucleation by Heat
The accepted model for charged particle bubble nucleation has historically been through heating by -electrons seitz ; peyrou . This model predicts measured nucleation rates in early hydrogen bubble chambers, which operated with thermodynamic thresholds of 20–60 eV fabian_1963 . Heating in this way can be explained through a combination of direct heating by -electrons and indirect heating through ionization and excitation caused by -electrons tenner . Alternatively, early molecular bubble chambers with propane and freon targets indicate a more efficient heating mechanism of nucleation through ionization and excitation of the medium by the incident particle willis_1957 . Consequently, freon chambers operated with significantly higher thresholds on the order of 100 eV to establish mean superheat times of seconds hahn_1960 .
One of the strongest historical motivations for the hot-spike (heat) nucleation model comes from the absence of electron recoil nucleation in superheated xenon glaserXe , as was recently verified in xebc . In a pure xenon bubble chamber, Glaser was unable to observe nucleation in the presence of a photon source unless ethylene quenching agent was added, thus giving access to an efficient heating mechanism. In the absence of the ethylene quenching agent, either the lack of molecular bonds in a noble liquid does not allow any efficient direct heating mechanism or the de-excitation energy is lost through scintillation instead of being transformed into heat.
Bubble chambers used for dark matter detection are not nearly as superheated as historical bubble chambers. Above keV Seitz thresholds, the theory of electron recoil bubble nucleation by heat has not been well tested and may not be the dominant nucleation mechanism. Experiments using C4F10 droplet detectors, such as PICASSO, have shown consistency with nucleation by heat at these thresholds picasso2011 . However, these detectors were operated at atmospheric pressure by varying temperature to set the threshold. Without the ability to span many pressure-temperature options (as in Figure 4), it is extremely challenging to distinguish between nucleation by heat and nucleation by ionization.
IV.2 Nucleation by Ionization
We present an alternate method of bubble nucleation through ionization. This resembles the case of nucleation by heat, except that a significant fraction of the energy needed to create a bubble is drawn from the fluid. At very low thresholds (sub-keV for molecular fluids), this would be a sub-dominant nucleation channel to heating by -electrons, which becomes efficient as the nucleation threshold decreases. Nucleation by ionization of the fluid could dominate as the thermodynamic threshold increases and directly heat-driven nucleation mechanisms become unavailable tenner , possibly at the energy thresholds considered for a dark matter search.
It is important to emphasize that the data presented here have no power to constrain the underlying physics driving ionization nucleation. However, it is instructive to consider what mechanisms could exist. One of the oldest mechanisms of nucleation by ionization was presented by Glaser glaserCavitation . In this case, Glaser considered a mechanism wherein electrostatic repulsion could drive cavitation on the critical length scale, beyond which the pressure inside the bubble would take over. Such a nucleation mechanism would scale with the minimum work , not the ionization threshold defined here. This idea was discarded in part because the charge density needed to propel bubble growth is higher than plausible from -electrons alone. However, in the case of ionization in a molecular fluid (such as C3F8), there is the added component of molecular breakdown which could yield a much higher local charge density than from the -electrons themselves. It is plausible that this charge density is able to provide sufficient energy to assist bubble growth in the ionization nucleation model presented here. In such a case, this ionization nucleation model would be dependent on molecular stability and absent (or highly suppressed) in atomic fluids.
IV.3 Comparing Models
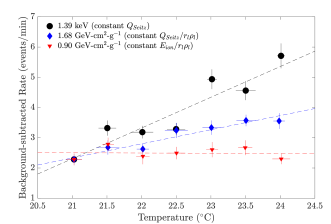
In order to test these two models, we perform a scan at constant stopping power [Eq. (9)] for each nucleation energy threshold . In scanning these contours for each energy threshold, we are able to probe the different nucleation models independent of simulation by looking at the stability of the observed nucleation rate in each scenario. Measured rates in the presence of a 137Cs source from each of these scans in the Drexel bubble chamber (see Table 1) are shown in Figure 5, as well as a scan at constant for comparison. The measured slopes per ∘C are (constant ), (constant stopping power with ), and (constant stopping power with ). Of the attempted threshold models, the only one consistent with a flat rate is the model of electron recoil bubble nucleation by ionization rather than heat.
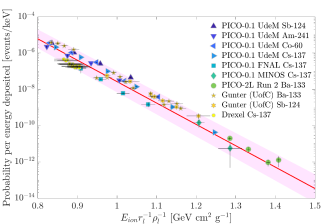
Following this test, we choose to perform a maximum likelihood fit on all calibrations in pure C3F8 using an exponential nucleation model [Eq. (7)] scaling with stopping power [Eq. (9)] and [Eq. (6)]. We treat each measurement as a separate trial of a Poisson process, and calculate the likelihood of obtaining the observed number of events in a calibration given some expectation from the nucleation model. Additionally, the individual pressures and temperatures are allowed to fluctuate according to their measured uncertainties with a Gaussian penalty to the likelihood. Correlated systematic uncertainties in pressure, temperature, background rate, and simulation are included and discussed further in Appendix C. The best fit model for the probability of nucleation () is shown in Figure 6, with best fit values for the exponential parameters of
| (10) |
Within the range of probed (0.63–1.67 keV), the stopping power of an electron is 100 MeV cm2 g-1 ESTAR . The best fit value for is roughly half of this value, indicating that our model may only have one free parameter if the nucleation length scale is some factor times . This semi-empirical model, which spans seven orders of magnitude in nucleation probability, is primarily constrained by the Gunter data, which has the largest coverage in pressure-temperature space of the C3F8 calibrations.
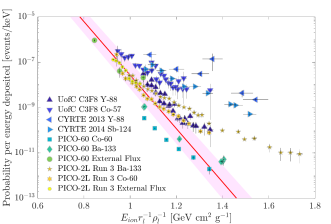
If we attempt to apply this model to C3F8 calibration data from chambers previously exposed to CF3I, we observe a plateauing away from the best fit (shown in Figure 7), which requires an additional mechanism to explain.
V Photoabsorption Bubble Nucleation
In Section IV, we state that C3F8 calibration data is in good agreement with a new ionization nucleation model driven by -electron production. Calibrations in CF3I coupp2 favor models like the one previously shown in Figure 1, namely that nucleation probability scales with the number of photon scatters. This can be explained by an additional nucleation mechanism in CF3I that does not depend on -electron production, but instead on the primary interaction vertex. Such a mechanism could be dominant in CF3I over the ionization nucleation mechanism presented in Section IV. Furthermore, such a model differs from highly superheated classical bubble chambers which could be described by nucleation from heating through -electrons tenner .
V.1 Nucleation by Auger Cascades
In the case of high-Z atomic targets with many electron shells, such as iodine, the binding energy release following an inner shell electron recoil, typically from photoabsoprtion, can have a far more local profile of energy deposition than a single ionization track. This is a consequence of Auger cascades, which contain energy significantly above the Seitz threshold divided into numerous low-energy x-rays and Auger electrons originating from the same atom. The energy deposition around the parent atom has a higher effective than a single ionization track, resulting in a dramatically (up to many orders of magnitude) larger probability of bubble nucleation. The cascade resulting from any vacancy will be local compared to an ionization track, but the effect will be most significant following a K-shell vacancy in a high-Z element due to the larger average number of charges ejected. In addition to the localized cascade, the parent atom is multiply ionized, and causes a local breakdown of the nearby molecules of the fluid durup . This molecular breakdown releases a significant amount of energy (on the scale of the Seitz energy threshold) and should be largely available as heat tenner . Thus, it is not surprising that electron recoil calibration data from CF3I is well-described by a hot-spike nucleation model.
The most efficient way to probe nucleation by photoabsorption is to alter the photon energy spectrum incident on the superheated fluid. This can be done by exploiting numerous calibration sources, as is presented in this work (see Table 1). Alternatively, a small amount of absorber material can be used to remove the low energy portion of a radioactive source’s photon energy spectrum. At Northwestern University, calibrations with a 133Ba source incident on a tungsten-doped C3F8 bubble chamber favor photoabsorption on residual tungsten as the primary driver of nucleation baxter . At this time, no comparable experiment has been performed for iodine contamination in C3F8, but the effect is expected to be similar.
Previous publications showing that the probability of nucleation in CF3I for a single photon scatter scales with Seitz threshold coupp2 are not in conflict with this photoabsorption model since the fraction of interactions attributed to K-shell photoabsorptions (40) varies within the systematic differences between these data. The scaling of this mechanism with Seitz threshold also explains the lack of bubble nucleation from Auger cascades in xenon glaserXe ; xebc , since pure xenon lacks an efficient heating mechanism through ionization.
V.2 Iodine-Contaminated Bubble Chambers
All C3F8 chambers which were previously exposed to CF3I observe a deviation from the model presented in Section IV. With the exception of the PICO-60 data (see Appendix C), this is visible in Figure 7 as an additional contribution to nucleation probability (of seemingly constant slope) added to the ionization nucleation probability from Section IV. This can be explained by an efficient nucleation mechanism through photoabsorption on residual iodine. Each C3F8 dataset with some iodine exposure has been simulated with 1 ppk iodine in the C3F8. We then compare the excess rates over the -electron nucleation model from Section IV by floating the simulated photoabsorption rate in each detector (analogous to floating the amount of iodine contamination).
In order to constrain a nucleation mechanism by photoabsorption on iodine, we use a subset of COUPP CF3I gamma calibration data, in which the iodine concentration is defined to be one iodine atom per molecule of fluid. For this analysis, we consider only K-shell photoabsorptions on iodine, which should dominate any Auger cascade nucleation mechanism. The rate of K-shell photoabsorptions is crudely obtained from MCNP simulation by counting the number of iodine photoabsorptions with incident photon energy greater than 33.5 keV iodine .
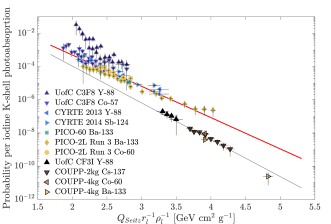
We analyze the iodine-contaminated C3F8 data using a similar fit as in Section IV, but with and an additional nuisance parameter per detector for the number of events expected through ionization nucleation, which are treated as background. Furthermore, we allow different parameters for the iodine-contaminated C3F8 and CF3I fits, since the underlying stopping powers may be slightly different. With only eight free parameters (three from the exponential forms and five from individual detector iodine concentrations), we find remarkable agreement between the iodine-contaminated C3F8 data and the pure CF3I calibrations, shown in Figure 8. There is significant amount of degeneracy among the free parameters, resulting in large uncertainties in the overall normalization. Regardless, strong conclusions about the underlying stopping power can still be made. The best fit values to the fit parameters are
| (11) |
According to the best fit values of , the effective stopping power of an iodine K-shell Auger cascade in both fluids is roughly five times that of ionization nucleation in pure C3F8 [Eq. (10)]. As such, the Auger nucleation process should dominate over ionization nucleation when available. The best fit values for iodine concentration in each chamber are shown in Table 2, converted to more conventional units of parts-per-million iodine by mass fraction (to return to simulated molecular fraction, multiply values in the Table by 1.5, the mass ratio of C3F8 to iodine).
| Detector | GC-MS | ICP-MS | Best Fit | |
|---|---|---|---|---|
| U. of Chicago | - | - | 100 | 0.04 |
| CYRTE 2013 | - | - | 200 | 80 |
| CYRTE 2014 | - | - | 20 | 8 |
| PICO-60 | 0.06 | 0.01 | 0.3 | 1 |
| PICO-2L Run 3 | 0.7 | 0.4 | 50 | 0.02 |
| Source Bottle | 0.07 | 5 | - | - |
Above 1 ppk iodine, the assumption that concentration scales linearly with the rate of photoabsorptions breaks down, and the photoabsorption rate saturates as concentration increases. As a result, best fit values for iodine concentration greater than 1 ppk (in the CYRTE detector) should be used only to make relative statements. The large (three orders of magnitude) uncertainty in these numbers easily encompasses plausible values, and no attempt has been made to put a physical bound on the upper concentration range of the fit.
We assayed the C3F8 gas removed from the cross-contaminated dark matter detectors, PICO-2L Run 3 and PICO-60, for iodine concentration. These assays were performed at Pacific Northwest National Laboratory (PNNL) using both a standard gas chromatography mass spectrometry (GC-MS) and an experimental, gas inductively coupled plasma mass spectrometry (ICP-MS) analysis. The GC-MS analysis explicitly looks for iodine in the form of CF3I under the assumption that CF3I behaves as an ideal gas. The resulting measured iodine concentrations are shown in Table 2 and compared against the best-fit values. No uncertainty is given for the assays because the transfer efficiency was not calibrated, so the same transfer efficiency is assumed for both C3F8 and I. Both assay techniques measure iodine concentrations slightly lower than the unconstrained best fit values. This likely indicates an inefficiency in the storage and transfer of iodine-contaminated C3F8. We suspect that much of the iodine is leached out of the C3F8 during storage in plastic sample bags prior to analysis. The PICO-2L Run 3 sample spent far longer (almost a year) in a sample bag compared to the PICO-60 sample (a few months) which is consistent with the relative discrepancy between the best fit and assayed values. We assume these chambers to be pure C3F8 with only residual iodine, but contamination by more common heavy metals like lead could be contributing to the best fit values. Studying the effects of contaminants other than iodine would require a dedicated calibration and is outside the scope of this work.
VI Dark Matter Search Backgrounds
Bubble chamber detectors are used to search for dark matter via nuclear recoils, which are well described by the Seitz nucleation model cirte ; picoNR . The analysis of calibration data presented here allows for the minimization and understanding of electron recoil backgrounds in future bubble chamber dark matter detectors. These detectors should be designed to operate at as low a pressure as possible in order to minimize the nuclear recoil threshold while maximizing the electron recoil threshold. Effort must be taken to avoid any exposure to contaminants containing high-Z elements that cannot be easily removed, in order to avoid the nucleation mechanism presented in Section V. This is most easily achieved by no longer filling bubble chambers with C3F8 which previously used CF3I.
| Eγ [MeV] | ||
|---|---|---|
| 0.10-0.66 | 25100 | 44800 |
| 0.66-1.32 | 8650 | 13100 |
| 1.32-1.66 | 5440 | 16000 |
| 1.55-2.47 | 1540 | 1670 |
| 2.47-2.91 | 1760 | 4000 |
| 2.91-3.00 | 0.273 | 3.03 |
| 3.00-4.00 | 6.660 | 6.66 |
| 4.00-5.00 | 6.18 | 6.18 |
| 5.00-6.00 | 1.46 | 1.46 |
| 6.00-7.00 | 1.08 | 1.08 |
| 7.00-8.00 | 1.65 | 1.65 |
| 8.00-9.00 | 4.19 | 4.19 |
| 9.00-10.00 | 2.03 | 2.03 |
| 10.00-11.00 | 2.25 | 2.25 |
| 11.00-13.00 | 3.81 | 1.91 |
| 13.00-60.00 | 6.34 | 1.35 |
| Total | 42500 | - |
Low threshold data taken in PICO-60 and PICO-2L Run 3 is also included in this analysis using the simulated external gamma flux as a proxy for the entire electron recoil background. The ambient gamma flux at SNOLAB has been measured previously alan ; fustin and is included here in Table 3 for convenience. The 2.91–3.00 MeV energy bin has been determined from alan by subtracting the measured flux between 3–60 MeV from the measured flux MeV. As can be seen in Figure 7, these data are in agreement with the ionization model for bubble nucleation in C3F8 and are taken at thresholds low enough that the ionization mechanism (Section IV) should dominate over the iodine photoabsorption mechanism (Section V). We thus conclude that simulations of the external gamma flux approximate the overall electron recoil backgrounds in our dark matter detectors reasonably well.
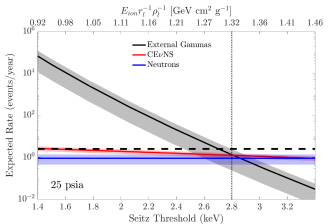
The PICO-40L detector, currently being commissioned at SNOLAB, has never been exposed to CF3I (or other contaminants containing high-Z elements) and should be able to expand down to a superheated pressure of 25 psia with no modifications. The hydraulic system could further expand down to 18 psia (ambient pressure in SNOLAB) if the temperature in the cold region can be lowered below -25∘C. Future modifications to the hydraulic system could allow the possibility of expansion below ambient pressure. The detector’s thermal design should be able to achieve temperatures as low as -40∘C, allowing stable operation down to 12.7 psia, and possibly further. The expected backgrounds for 25 psia as a function of Seitz threshold are shown in Figure 9, along with the expected nuclear recoil backgrounds from neutron single-scatters and coherent elastic neutrino-nucleus scattering (CENS). Exposures of kg-days (56 kg C3F8, 1 live-year, and 80 analysis efficiency) are possible with no modifications down to a threshold of 2.8 keV. The 8B solar neutrino CENS background is calculated according to strigari and should be the dominant background contribution between 2.8 and 3.2 keV.
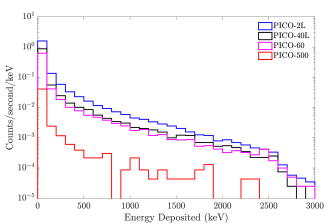
PICO-500, the next iteration of PICO bubble chambers, should be able to probe even further, exploiting this model to achieve a background-free, ton-year exposure with C3F8 at nuclear recoil thresholds as low as 2 keV. This improvement comes from a combination of over ten times the mass of PICO-40L and a significant improvement in the shielding of ambient external backgrounds, shown in Figure 10. Simulations of the predicted energy deposition rate due to the external flux at SNOLAB for each of these chambers are produced in GEANT4 GEANT using the photon flux in Table 3.
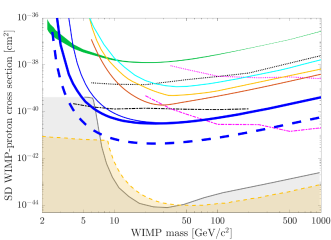
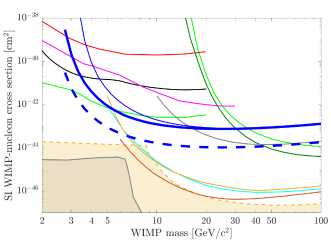
Projected spin-dependent and spin-independent WIMP exclusion curves are presented in Figures 11 and 12, respectively, for an exposure of kg-days at a 2.8 keV Seitz threshold accepting 2 background events. All projections are calculated using nuclear recoil efficiencies from picoNR , scaled linearly down to a 2.8 keV threshold. In calculating these limits, we adopt the standard halo parametrization lewinandsmith with GeV c-2 cm-3, km/s, km/s, and km/s. We incorporate the effective field theory treatment and nuclear form factors described in spindependentcouplings ; Anand ; Gresham ; Gluscevic . From Table 1 of spindependentcouplings , the response is used for the spin-independent calculation and the sum of the and terms is used for the spin-dependent calculation. We implement these interactions and form factors using the publicly available dmdd code package Gluscevic ; Gluscevic2 .
The CENS scattering floors for each target are taken from cevns . For the spin-dependent case (Figure 11), we choose to compare the proton coupling floor for C3F8 against the neutron coupling floor for xenon as this gives the most generous comparison for xenon while still showing the unique reach of C3F8. If dark matter preferentially couples to the proton, the floor for xenon will be higher. For both the spin-dependent and spin-independent couplings, we choose to show the C3F8 floor in the case of no energy resolution, as this indicates when the CENS rate begins to limit the statistical significance of a potential dark matter discovery. If keV-scale energy resolution can be established, the C3F8 floor moves down from what is shown.
VII Discussion
We have experimentally established a new model for nucleation of bubbles by gammas in light element fluids like C3F8 driven by ionization through -electron production and not, as previously thought, a hot-spike of energy. This model explains all pure C3F8 PICO calibration datasets to within an order of magnitude. These same data disfavor the old model of electron recoil bubble nucleation that scales with Seitz threshold, as in the case of nuclear recoils. This differentiation gives a new degree of freedom which can be used to further reduce the nuclear recoil threshold of bubble chamber dark matter detectors without introducing electron recoil backgrounds.
Additional data from C3F8 bubble chambers previously exposed to iodine in the form of CF3I indicate a second nucleation mechanism through Auger cascades. Even residual contamination of high-Z elements will produce Auger cascades that have a substantially larger effective stopping power, and are thus more efficient than ionization nucleation at creating bubbles. Auger cascade nucleation is driven by heat, thus explaining the effectiveness of the old nucleation model when applied to CF3I. This nucleation channel can be eliminated in future detectors by limiting their exposure to contaminants containing high-Z elements, like iodine. The absence of this mechanism in C3F8 explains (for the first time) the lower achievable WIMP thresholds compared to CF3I detectors.
The combination of these two models is able to simultaneously explain all existing PICO C3F8 calibration data, despite nucleation probabilities spanning almost ten orders of magnitude. Measurements of ambient electron recoil backgrounds in PICO dark matter detectors at SNOLAB are consistent with this model when external gammas are assumed to be the primary contribution to electron recoil backgrounds. We apply this background model to the predicted external gamma backgrounds in PICO-40L for various thresholds. We choose the optimal target run conditions of 25 psia and 13.5∘C to project limits for the PICO-40L detector with kg-days of exposure at 2.8 keV and 2 background events. By exploiting the different nucleation mechanisms of electron and nuclear recoils, bubble chambers are thus able to maximize sensitivity to dark matter through lower thresholds while maintaining the excellent electron recoil rejection previously shown in PICO dark matter detectors.
VIII Acknowledgements
The PICO Collaboration wishes to thank SNOLAB and its staff for support through underground space, logistical and technical services. SNOLAB operations are supported by the Canada Foundation for Innovation and the Province of Ontario Ministry of Research and Innovation, with underground access provided by Vale at the Creighton mine site. We wish to acknowledge the support of the Natural Sciences and Engineering Research Council of Canada (NSERC) and the Canada Foundation for Innovation (CFI) for funding. We acknowledge the support from National Science Foundation (NSF) (Grants No. 0919526, No. 1506337, No. 1242637, No. 1205987, and No. 1806722). We acknowledge that this work is supported by the U.S. Department of Energy (DOE) Office of Science, Office of High Energy Physics (under Award No. DE-SC-0012161), by DGAPA-UNAM (PAPIIT No. IA100118) and Consejo Nacional de Ciencia y Tecnología (CONACyT, México, Grants No. 252167 and No. A1-S-8960), by the Department of Atomic Energy (DAE), Government of India, under the Centre for AstroParticle Physics II project (CAPP-II) at the Saha Institute of Nuclear Physics (SINP), European Regional Development Fund-Project “Engineering Applications of Microworld Physics” (Project No. CZ.02.1.01/0.0/0.0/16_019/0000766), and the Spanish Ministerio de Ciencia, Innovación y Universidades (Red Consolider MultiDark, Grant No. FPA2017-90566-REDC). This work is partially supported by the Kavli Institute for Cosmological Physics at the University of Chicago through NSF Grant No. 1125897, and an endowment from the Kavli Foundation and its founder Fred Kavli. We also wish to acknowledge the support from Fermi National Accelerator Laboratory under Contract No. DE-AC02-07CH11359, and Pacific Northwest National Laboratory, which is operated by Battelle for the U.S. Department of Energy under Contract No. DE-AC05-76RL01830. We also thank Compute Canada computecanada and the Center for Advanced Computing, ACENET, Calcul Québec, Compute Ontario and WestGrid for computational support.
References
- (1) C. Amole et al. (PICO Collaboration), Phys. Rev. D 100, 022001 (2019).
- (2) D. S. Akerib et al. (LZ Collaboration), arXiv:1802.06039 (2018).
- (3) R. Agnese et al. (SuperCDMS Collaboration), Phys. Rev. D 95, 082002 (2017).
- (4) A. H. Abdelhameed et al. (CRESST-III Collaboration), arXiv:1904.00498 (2019).
- (5) P.-A. Amaudruz et al. (DEAP-3600 Collaboration), Phys. Rev. Lett. 121, 071801 (2018).
- (6) Q. Arnaud et al. (NEWS-G Collaboration), Astroparticle Physics 97, 54 (2018).
- (7) A. Aguilar-Arevalo et al. (DAMIC Collaboration), Phys. Rev. D 94, 082006 (2016).
- (8) C. E. Aalseth et al. (DarkSide Collaboration), Eur. Phys. J. Plus 133, 131 (2018).
- (9) G. Jungman, M. Kamionkowski, and K. Griest, Physics Reports 267, 195 (1996).
- (10) G. Bertone, D. Hooper, and J. Silk, Phys. Rep. 405, 279 (2005).
- (11) J. L. Feng, Annual Review of Astronomy and Astrophysics 48, 495 (2010).
- (12) P. Cushman et al., Snowmass CF1 Summary: WIMP Dark Matter Direct Detection, arXiv:1310.8327 (2013).
- (13) F. Duncan, A. J. Noble, and D. Sinclair, Annual Review of Nuclear and Particle Science 60, 163 (2010).
- (14) E. Behnke et al. (COUPP Collaboration), Phys. Rev. D 86, 052001 (2012), Erratum Phys. Rev. D 90, 079902(E) (2014).
- (15) F. Aubin et al. (PICASSO Collaboration), New Journal of Physics 10, 103017 (2008).
- (16) V. Zacek, Il Nuovo Cimento A 107, 291 (1994).
- (17) C. Amole et al. (PICO Collaboration), Phys. Rev. D 93, 052014 (2016).
- (18) C. Amole et al. (PICO Collaboration), Phys. Rev. Lett. 118, 251301 (2017).
- (19) C. Amole et al. (PICO Collaboration), Phys. Rev. D 93, 061101 (2016).
- (20) C. Amole et al. (PICO Collaboration), Phys. Rev. 114, 231302 (2015).
- (21) F. Hasert et al., Physics Letters B 46, 121 (1973).
- (22) F. Hasert et al., Physics Letters B 46, 138 (1973).
- (23) E. Behnke et al. (COUPP Collaboration), Phys. Rev. D 88, 021101(R) (2013).
- (24) C. Amole et al. (PICO Collaboration), in preparation.
- (25) A. G. Tenner, Nuclear Instruments and Methods 22, 1 (1963).
- (26) T. Kozynets, S. Fallows, and C. B. Krauss, Phys. Rev. D 100, 052001 (2019).
- (27) F. Seitz, The Physics of Fluids 1, 2 (1958).
- (28) J. W. Gibbs, Collected Works, Vol. I, Longmans, Green, and Co, New York (1928).
- (29) E. W. Lemmon, M. L. Huber, and M. O. McLinden, NIST Standard Reference Database 23: Reference Fluid Thermodynamic and Transport Properties-REFPROP, Version 9.0, National Institute of Standards and Technology, Standard Reference Data Program, Gaithersburg (2010).
- (30) E. Behnke et al. (COUPP Collaboration), Science 319, 933 (2008).
- (31) M. Barnabé-Heider et al. (PICASSO Collaboration), Nucl. Instr. and Meth. A 555, 184 (2005).
- (32) J. F. Ziegler, M. D. Ziegler, and J. P. Biersack, Nucl. Instr. and Meth. B 268, 1818 (2010).
- (33) M. Laurin, Ph.D. thesis, Université de Montréal (2016).
- (34) M. Bressler et al., JINST 14 P08019 (2019).
- (35) A. E. Robinson, Ph.D. thesis, University of Chicago (2015).
- (36) D. Baxter, Ph.D. thesis, Northwestern University (2018).
- (37) D. Fustin, Ph.D. thesis, University of Chicago (2012).
- (38) S. Agostinelli et al., Nucl. Instr. and Meth. A 506, 250 (2003).
- (39) S. A. Pozzi, E. Padovani and M. Marseguerra, Nucl. Instr. and Meth. A 513 550 (2003).
- (40) S. Archambault et al. (PICASSO Collaboration), New Journal of Physics 13, 043006 (2011).
- (41) D. A. Glaser, Il Nuovo Cimento 11, 361 (1954).
- (42) C. Peyrou, in R. P. Shutt, ed., Bubbles and Spark Chambers, Academic Press, New York, pp. 19-58 (1967).
- (43) B. N. Fabian, R. L. Place, W. A. Riley, W. H. Sims, and V. P. Kenney, Review of Scientific Instrumentst 34, 484 (1963).
- (44) W. J. Willis, E. C. Fowler, and D. C. Rahm, Phys. Rev. 108, 1046 (1957).
- (45) B. Hahn and E. Hugentobler, Il Nuovo Cimento 17, 983 (1960).
- (46) J. L. Brown, D. A. Glaser, and M. L. Perl, Phys. Rev. 102, 586 (1956).
- (47) D. Baxter et al., Phys. Rev. Lett. 118, 231301 (2017).
- (48) M. J. Berger, J. S. Coursey, M. A. Zucker, and J. Chang, Stopping-Power Range Tables for Electrons, Protons, and Helium Ions, NIST Standard Reference Database 124 (2017).
- (49) J. Durup and R. L. Platzman, Discuss. Faraday Soc. 31, 156 (1961).
- (50) E. Schönfeld and H. Janßen, Applied Radiation and Isotopes 52, 595 (2000).
- (51) L. E. Strigari, New Journal of Physics 11, 105011 (2009).
- (52) J. Lewin and P. Smith, Astroparticle Physics 6, 87 (1996).
- (53) A. L. Fitzpatrick, W. Haxton, E. Katz, N. Lubbers, and Y. Xu, J. Cosmol. Astropart. Phys. 02 (2013) 004.
- (54) N. Anand, A. L. Fitzpatrick, and W. C. Haxton, Phys. Rev. C 89, 065501 (2014).
- (55) M. I. Gresham and K. M. Zurek, Phys. Rev. D 89, 123521 (2014).
- (56) V. Gluscevic, M. I. Gresham, S. D. McDermott, A. H. G. Peter, and K. M. Zurek, J. Cosmol. Astropart. Phys. 12 (2015) 057.
- (57) V. Gluscevic and S. D. McDermott, dmdd: Dark matter direct detection, Astrophysics Source Code Library, record ascl:1506.002 (2015).
- (58) E. Aprile et al. (XENON Collaboration), Phys. Rev. Lett. 122, 141301 (2019).
- (59) D. S. Akerib et al. (LUX Collaboration), Phys. Rev. Lett. 118, 251302 (2017).
- (60) C. Fu et al. (PandaX-II Collaboration), Phys. Rev. Lett. 118, 071301 (2017).
- (61) E. Behnke et al. (PICASSO Collaboration), Astroparticle Physics 90, 85 (2017).
- (62) M. G. Aartsen et al. (IceCube Collaboration), European Physical Journal C 77, 146 (2017).
- (63) K. Choi et al. (Super-Kamiokande Collaboration), Phys. Rev. Lett. 114, 141301 (2015).
- (64) F. Ruppin, J. Billard, E. Figueroa-Feliciano, and L. Strigari, Phys. Rev. D 90, 083510 (2014).
- (65) M. Felizardo et al. (SIMPLE Collaboration), Phys. Rev. D 89, 072013 (2014).
- (66) S. Adrián-Martínez et al. (ANTARES Collaboration), Physics Letters B 759, 69 (2016).
- (67) S. Adrián-Martínez et al. (ANTARES Collaboration), J. Cosmol. Astropart. Phys. 05 (2016) 016.
- (68) E. Aprile et al. (XENON Collaboration), Phys. Rev. Lett. 121, 111302 (2018).
- (69) D. S. Akerib et al. (LUX Collaboration), Phys. Rev. Lett. 118, 021303 (2017).
- (70) P. Agnes et al. (DarkSide Collaboration), Phys. Rev. Lett. 121, 081307 (2018).
- (71) P. Agnes et al. (DarkSide Collaboration), Phys. Rev. D 98, 102006 (2018).
- (72) R. Agnese et al. (SuperCDMS Collaboration), Phys. Rev. D 97, 022002 (2018).
- (73) R. Agnese et al. (SuperCDMS Collaboration), Phys. Rev. Lett. 120, 061802 (2018).
- (74) L. Hehn et al. (EDELWEISS Collaboration), The European Physical Journal C 76, 548 (2016).
- (75) See http://www.computecanada.ca.
- (76) R. C. Tolman, J. Chem. Phys. 17, 333 (1949).
- (77) J. G. Kirkwood and F. P. Buff, J. Chem. Phys. 17, 338 (1949).
- (78) Y.-Q. Xue, X.-C. Yang, Z.-X. Cui, and W.-P. Lai, J. Phys. Chem. B 115, 109 (2011).
Appendix A Hot-Spike Threshold Derivation
In this section, we present a derivation of the Seitz hot-spike threshold based on first principles from Gibbs Gibbs . This derivation takes as given Gibbs’ original derivations of the critical nucleation radius and minimum work required to create a nucleation site , described in Eq.’s (3) and (4).
The Seitz hot-spike threshold describes the heat input required to form a critically sized bubble, i.e., the heat required to take the system from an initial state of uniform superheated fluid to a final state of superheated fluid containing a vapor bubble of radius . Beginning from the first law of thermodynamics, the change in total internal energy in the system between these two states must equal the heat input to the system minus the work done by the system on the outside world
| (12) |
where is the quantity we will identify as Seitz’s hot-spike threshold , and . Here, we adopt Gibbs’ notation for labeling intensive properties such that ′′ refers to the superheated liquid (in both the initial and final configurations), and ′ refers to the vapor inside the bubble in the final state.
To relate to Gibbs’ original derivation of , we define a fixed volume inside the superheated fluid that contains the bubble in the final configuration. This volume is large compared to the bubble size, so that the fluid outside this volume is entirely in the ′′ state in both the initial and final configurations. The excess energy , entropy , and mass inside this volume in the final state can be written as
| (13) |
| (14) |
| (15) |
where is the radius of the bubble, and subscripts s and v denote quantities normalized by the bubble surface area and volume respectively. and are the more familiar notations for surface and volume densities. A subscript m will indicate a quantity normalized by mass, e.g., . In terms of these quantities, Gibbs derives
| (16) |
where the temperature and chemical potential require no primes because equilibrium requires that they be identical in the liquid and vapor states.
To relate to Gibbs’ , we note that the total change in internal energy for the system is the sum of the change in energy inside our fixed volume plus the change in energy outside the volume, or
| (17) |
keeping in mind that is negative (mass has moved from inside the fixed volume to outside, displaced by the vapor bubble). Given the fundamental relation
| (18) |
we can rewrite the heat input as
| (19) |
Writing this instead in terms of specific enthalpies
| (20) |
we obtain
| (21) |
To express the surface terms in Eq. (21) in terms of the normal surface tension, we begin with Gibbs’ fundamental relations for the surface tension
| (22) |
where in the second line (for example, when traveling along the coexistance curve where , we have ). The quantity is known as the Tolman length tolman , and is given by Gibbs ; tolman
| (23) |
The Tolman length describes how surface tension changes with curvature (or equivalently with ), and is expected to be on the order of the intermolecular spacing.
| 10∘C | 12∘C | 14∘C | 16∘C | 18∘C | 20∘C | 22∘C | 24∘C | |
|---|---|---|---|---|---|---|---|---|
| 0 psia | 1.85 (2.04) | 1.49 (1.79) | 1.2 (1.57) | 0.97 (1.37) | 0.78 (1.2) | 0.63 (1.06) | 0.5 (0.93) | 0.4 (0.81) |
| 5 psia | 2.16 (2.23) | 1.72 (1.94) | 1.38 (1.69) | 1.1 (1.48) | 0.88 (1.29) | 0.7 (1.13) | 0.56 (0.98) | 0.45 (0.86) |
| 10 psia | 2.55 (2.46) | 2.01 (2.13) | 1.59 (1.84) | 1.26 (1.6) | 0.99 (1.39) | 0.79 (1.2) | 0.62 (1.05) | 0.49 (0.91) |
| 15 psia | 3.05 (2.74) | 2.38 (2.35) | 1.86 (2.02) | 1.45 (1.74) | 1.14 (1.5) | 0.89 (1.29) | 0.7 (1.12) | 0.55 (0.97) |
| 20 psia | 3.71 (3.08) | 2.85 (2.61) | 2.19 (2.23) | 1.69 (1.9) | 1.31 (1.63) | 1.02 (1.39) | 0.79 (1.2) | 0.62 (1.03) |
| 25 psia | 4.6 (3.51) | 3.46 (2.94) | 2.62 (2.48) | 2.0 (2.09) | 1.53 (1.78) | 1.17 (1.51) | 0.9 (1.29) | 0.69 (1.1) |
| 30 psia | 5.82 (4.04) | 4.29 (3.34) | 3.18 (2.78) | 2.38 (2.33) | 1.8 (1.96) | 1.36 (1.65) | 1.03 (1.4) | 0.79 (1.19) |
| 35 psia | 7.56 (4.75) | 5.43 (3.86) | 3.94 (3.16) | 2.89 (2.61) | 2.14 (2.17) | 1.6 (1.81) | 1.2 (1.52) | 0.9 (1.28) |
| 40 psia | 10.15 (5.69) | 7.05 (4.53) | 4.98 (3.65) | 3.57 (2.97) | 2.59 (2.43) | 1.9 (2.01) | 1.4 (1.67) | 1.04 (1.4) |
| 45 psia | 14.2 (7.0) | 9.46 (5.42) | 6.47 (4.27) | 4.51 (3.41) | 3.19 (2.76) | 2.29 (2.25) | 1.66 (1.85) | 1.22 (1.53) |
| 50 psia | 20.94 (8.92) | 13.23 (6.68) | 8.67 (5.12) | 5.83 (4.0) | 4.01 (3.17) | 2.81 (2.54) | 2.0 (2.06) | 1.44 (1.69) |
Because the Tolman length is small (and unknown), it is useful to expand quantities in powers of . We define and as the surface tension and critical radius when (i.e., surface tension unaffected by curvature of the bubble), so that
| (24) |
and
| (25) |
Similarly, we will define , , etc. such that
| (26) |
Combining all of the above, we find expressions for and of
| (27) |
and
| (28) |
Eq. (5) in the text is thus the first order term above with some reorganization. When calculating values for thresholds (, , and ) and estimating theoretical uncertainties on those values, we choose , where is the intermolecular spacing in the fluid tolman2 ; tolman_Xue , leading typically to 0.1–0.2 keV uncertainties on pico60full . Example values of for C3F8 over typical pressure and temperature ranges of interest can be found in Table 4.
Appendix B Ionization Threshold Derivation
The hot-spike nucleation threshold is based on the assumption that none of the energy required for bubble nucleation is taken from the surrounding thermal reservoir, while the minimum-work threshold draws the maximal heat from the reservoir. We consider here a well-defined intermediate case which translates to the threshold in the text.
We begin again with the overall energy balance, written now as
| (29) |
where is the heat deposited by the interaction (which we will interpret as ), and is the heat drawn from the reservoir. In this scenario, we imagine that the drawing of heat from the reservoir is a slow process, and is the heat required to reach some intermediate, quasi-equilibrium state.
We define this intermediate state as containing a spherical void with radius , and assume the surface and outside liquid properties in this state are the same as in the hot-spike calculation except that the bubble simply contains no vapor. In this condition, the mechanical dis-equilibrium works to collapse the bubble, while the chemical dis-equilibrium will fill the bubble with vapor. If an additional force, e.g. Coulomb repulsion, stabilizes the void long enough for chemical equilibrium to be reached, the void becomes a gas-filled bubble, reaching the same final state as in the previous discussion.
| 10∘C | 12∘C | 14∘C | 16∘C | 18∘C | 20∘C | 22∘C | 24∘C | |
|---|---|---|---|---|---|---|---|---|
| 0 psia | 1.03 (1.14) | 0.84 (1.01) | 0.69 (0.9) | 0.56 (0.8) | 0.46 (0.71) | 0.38 (0.63) | 0.31 (0.56) | 0.25 (0.5) |
| 5 psia | 1.18 (1.22) | 0.96 (1.08) | 0.78 (0.96) | 0.63 (0.85) | 0.51 (0.75) | 0.41 (0.66) | 0.33 (0.59) | 0.27 (0.52) |
| 10 psia | 1.36 (1.31) | 1.09 (1.16) | 0.88 (1.02) | 0.71 (0.9) | 0.57 (0.79) | 0.46 (0.7) | 0.37 (0.62) | 0.3 (0.55) |
| 15 psia | 1.58 (1.42) | 1.26 (1.24) | 1.0 (1.09) | 0.8 (0.96) | 0.64 (0.84) | 0.51 (0.74) | 0.41 (0.65) | 0.33 (0.57) |
| 20 psia | 1.86 (1.55) | 1.47 (1.35) | 1.16 (1.17) | 0.91 (1.03) | 0.72 (0.9) | 0.57 (0.78) | 0.45 (0.69) | 0.36 (0.6) |
| 25 psia | 2.23 (1.7) | 1.73 (1.47) | 1.35 (1.27) | 1.05 (1.1) | 0.82 (0.96) | 0.65 (0.84) | 0.51 (0.73) | 0.4 (0.64) |
| 30 psia | 2.72 (1.89) | 2.07 (1.61) | 1.59 (1.39) | 1.22 (1.19) | 0.95 (1.03) | 0.74 (0.89) | 0.57 (0.77) | 0.45 (0.67) |
| 35 psia | 3.38 (2.12) | 2.52 (1.79) | 1.9 (1.52) | 1.44 (1.3) | 1.1 (1.12) | 0.84 (0.96) | 0.65 (0.83) | 0.5 (0.71) |
| 40 psia | 4.31 (2.42) | 3.13 (2.01) | 2.31 (1.69) | 1.72 (1.43) | 1.29 (1.21) | 0.98 (1.04) | 0.74 (0.89) | 0.57 (0.76) |
| 45 psia | 5.69 (2.81) | 4.0 (2.29) | 2.87 (1.9) | 2.09 (1.58) | 1.54 (1.33) | 1.15 (1.13) | 0.86 (0.96) | 0.65 (0.82) |
| 50 psia | 7.85 (3.34) | 5.28 (2.67) | 3.66 (2.16) | 2.59 (1.78) | 1.87 (1.47) | 1.36 (1.23) | 1.01 (1.04) | 0.75 (0.88) |
The calculation of in this scenario proceeds exactly as in the previous one, except that in Eq.’s (13–15), we drop the , , and terms. From Eq. (19) this gives
| (30) |
or, using ,
| (31) |
Expanding again in powers of , so that , this simplifies to
| (32) |
or Eq. (6) in the text. and higher order terms may also be calculated. Example values of for C3F8 over typical pressure and temperature ranges of interest can be found in Table 5.
Appendix C Experimental Overview
Calibration data is taken with our surface calibration chambers at relatively low Seitz thresholds, and with our dark matter detectors at comparatively high Seitz thresholds. The surface chambers typically cannot probe up in threshold because the rates due to the calibration source drop below the ambient backgrounds. Unless otherwise stated, this analysis assumes a detector-correlated systematic uncertainty in pressure (temperature) of 0.3 psi (0.1∘C), which is propagated into the calculation of all thermodynamic parameters. We allow fluctuation of the measured background rate for each detector according to its measured precision.
Each source is simulated for all positions used for a given detector. The resulting interaction and energy deposition rates per decay are recorded and multiplied by the activity of the simulated source (adjusted for the date of measurement). Unless otherwise specified, we assume a correlated 10 uncertainty for each simulated source and detector.
C.1 PICO-0.1
There are three datasets taken with the 30 mL PICO-0.1 detector. The first of these was taken on the surface at Fermilab National Accelerator Laboratory (FNAL) with a 0.75 mCi 137Cs wand source between 2012-2013, and probed very low thresholds in C3F8 for the first time. The second dataset was taken in late-2013 with the same chamber and source in the MINOS tunnel at FNAL (approximately 300 ft below surface) after a source tube was added to the water tank for the purpose of increasing the gamma flux from the 137Cs source which, in combination with reduced backgrounds from the rock overburden, allowed higher threshold calibration. The third dataset comes after the chamber was moved to the Université de Montréal (UdeM). Here it was given an improved source tube and water bath and a full set of calibrations were performed using multiple strong gamma sources laurin . Notably, the data taken at UdeM when normalized by simulated interaction rate (instead of energy deposition rate) tend to disagree in nucleation probability by up to an order of magnitude when comparing the different gamma sources. This disagreement originally motivated a re-assessment of the normalization from simulation later confirmed by Gunter in Figure 3. The FNAL and MINOS detectors are simulated in MCNP, and the UdeM setup is simulated in GEANT4 GEANT . For each calibration, no fiducial cut is attempted and the background rate without the source is subtracted.
C.2 Gunter
The Gunter calibration chamber at the University of Chicago was designed to simultaneously test the new buffer-free, thermal-gradient style bubble chamber and improve on the preliminary C3F8 electron recoil nucleation model presented in baxter . Gunter also acts as a test-bed for new high-frequency piezos sampling at 50 MS/s with a flat pre-amp response up to 25 MHz, allowing acoustic response in frequencies of MHz. Most prior gamma calibrations had been performed by choosing a temperature and scanning in pressure. Instead, Gunter was used to map out the rate due to 124Sb and 133Ba gamma sources non-linearly in pressure-temperature space, allowing for a more complete probe into the model. This different approach is visible in Figure 4. The choice of 124Sb and 133Ba sources was made to isolate information about a nucleation trial, specifically whether the probability of nucleation scaled with energy deposited or number of photon scatters, as shown in Figure 3. Consequently, the model presented here is primarily constrained by the Gunter calibrations, which are shown to be consistent with the other calibrations from PICO. All source simulations of Gunter were done in MCNPX-PoliMi MCNP , with the 124Sb source activity adjusted for the day of each individual measurement. For Gunter, the assumed systematic uncertainty on the temperature is 0.25∘C.
C.3 Drexel Bubble Chamber
Simultaneously to the operation of Gunter, another buffer-free bubble chamber was being operated at Drexel University drexel . The measurements from Gunter allowed predictions of some possible contours of constant nucleation in pressure-temperature space. The Drexel bubble chamber (DBC) used a 137Cs calibration source to take data along these contours, as presented in Figure 5. The agreement between calibrations in the DBC and Gunter across different sources and detector geometries provides sound footing for the electron recoil nucleation model of ionization by -electrons presented here. All source simulations of the DBC were done in MCNPX-PoliMi MCNP . For the DBC, the assumed systematic uncertainties on the temperature and simulations are 0.25∘C and 25 respectively.
C.4 PICO-2L
PICO-2L, the first dark matter detector operated with C3F8, was calibrated using a 1 mCi 133Ba source lowered 130.5 cm from the top shielding during its second run in 2016 pico2lrun2 . There were also calibrations during its first run in 2015 pico2lrun1 , but they yielded upper limits, and so are not included in this analysis. Counts and livetimes from the second run are extracted using a similar analysis to pico2lrun2 . Because acoustic and fiducial cuts are applied, a 67 analysis efficiency is applied to the livetime before comparing against simulation. The 133Ba source was simulated in MCNPX-PoliMi MCNP .
The third run of PICO-2L in 2017, published here for the first time, was calibrated using both the 133Ba source and an additional 0.1 mCi 60Co source in various positions, as well as an ambient scan down to low thresholds. This run strongly exhibited plateauing away from C3F8 nucleation models, as had previously only been observed in calibration chambers and attributed to contamination by high-Z elements alan ; baxter . For PICO-2L, this was traced to iodine cross-contamination coming from an empty CF3I storage cylinder that had been used to store the C3F8 boil-off between PICO-2L Runs 2 and 3. The run plan was subsequently modified to study the effect in greater detail, allowing the analysis in Section V, and to arrange for a sample of the boil-off from the detector to be sent to PNNL for analysis of iodine concentration, as presented in Table 2. For all background sources (calibration and ambient), the PICO-2L detector was simulated using the same MCNP geometry as Run 2, but with one part-per-thousand iodine.
C.5 PICO-60
PICO-60 C3F8 was calibrated using both 60Co and 133Ba sources at SNOLAB, as well as a low threshold background scan to measure the ambient rates due to gamma backgrounds pico60c3f8 ; pico60full . This analysis did include a fiducial cut removing all events within 5 mm of the detector wall. To ensure proper normalization, the same fiducial cut is applied to simulation. No efficiency is applied to the exposure, since no acoustic cuts are used in the event selection and since the data quality cuts applied are nearly 100 efficient pico60c3f8 . Additionally, a short (14 hour) time window was removed from the April 2017 ambient low threshold scan due to significant rate spike lasting a few hours, which cannot be attributed to the underlying nucleation physics of electron recoils. High-statistics source simulations were done in GEANT with all electronic sub-processes turned on. These simulations were used to cross-validate our MCNP simulations, which agreed on the energy deposition rate to within a few percent. While great care was taken during commissioning to ensure the purity of PICO-60, previous operation with CF3I was expected to contribute some iodine cross-contamination, as mentioned in the text. Thus, we use the MCNP simulations in this analysis to keep the comparison of iodine contamination consistent with the other detectors. PICO-60 source calibrations are the most significant outliers to the presented model (at 2), for which we are not able to offer an explanation. Calibrations from the first run of PICO-60 with CF3I pico60cf3i are not used in this analysis.
C.6 CYRTE
The discovery that contamination has a significant effect on C3F8 electron recoil nucleation was made in the CYRTE chamber, following its original run as a CF3I nuclear recoil calibration chamber cirte . After operation with CF3I, the detector was refilled with C3F8 and operated in 2013. After measuring extremely high rates in the presence of a gamma source, the detector was partially disassembled and cleaned, before being operated again in 2014. For this analysis, we treat the CYRTE detector before and after cleaning as two different experiments, since the concentration of iodine cross-contamination is expected to drop between the runs. This is consistent with the fit, which prefers an order of magnitude less contamination in the 2014 run. CYRTE calibration data is extracted from Tables 4.10 and 4.11 of alan . The MCNP simulation input files are modified to include one part-per-thousand iodine, to compare directly with the other chambers. The effect of contamination was confirmed after the chamber was moved to Northwestern University using injected tungsten dust baxter . However, this measurement was highly time dependent, and thus excluded from this analysis.
C.7 CF3I Calibrations
We make the assumption that the dominant nucleation mechanism in iodine-contaminated C3F8 is identical to the mechanism in pure CF3I. As such, we can use pure CF3I calibration data to better constrain this mechanism. All CF3I thresholds have been recalculated according to Appendix A. The MCNP simulation input files for each detector have been updated and rerun using MCNPX-PoliMi MCNP and current physics processes to be consistent with the more recent C3F8 calibrations.
CF3I calibration data at the University of Chicago was taken at temperatures of 37∘C and 39∘C using a 88Y source. This measurement scanned downward in threshold until a rate turn-on was observed, and thus only contains a few points of data above background. Notably, this same chamber was then filled with C3F8 and calibrated using both 57Co and 88Y sources. One issue with these iodine-contaminated C3F8 data is that the source is extremely close to the chamber, so small errors in the simulation geometry can result in large errors in the normalization. In addition, the strength of the 88Y source is not known to better than 50, which is accounted for as a systematic uncertainty in the source strength. This systematic is not shown in the figures here, making these data appear as an outlier, whereas in actuality they are in good agreement with the presented model.
The original calibration of electron recoil nucleation probability in a COUPP bubble chamber comes from COUPP-2kg coupp2 . Unfortunately, only rates and rough pressure-temperature combinations are reported. In order to extract the number of observed events for our analysis, we crudely assume that the error bars are statistically dominated and that ten events were observed in each measurement. This assumption acts to de-weight the measurements taken with this chamber while still allowing them to provide a useful lever arm in the model. We assume large uncertainties in the individual pressures (0.3 psi) and temperatures (0.1∘C).