Lattice dynamics and phase stability of rhombohedral antimony under high pressure
Abstract
The high pressure lattice dynamics of rhombohedral antimony have been studied by a combination of diffuse scattering and inelastic x-ray scattering. The evolution of the phonon behavior as function of pressure was analyzed by means of two theoretical approaches: density functional perturbation theory and symmetry-based phenomenological phase transition analysis. This paper focuses on the first structural phase transition, SbI-SbIV, and the role of vibrations in leading the transition. The phonon dispersion exhibits complex behaviour as one approaches the structural transition, with the branches, corresponding to the two transitions happening at high pressure in the Va elements (A7-to-BCC and A7-to-PC) both showing softening.
pacs:
00000I I. INTRODUCTION
Antimony, like the other group Va elements arsenic, bismuth and pressurized phosphorus, crystallizes under ambient conditions in an A7 rhombohedral structure. Under pressure it undergoes a sequence of structural phase transitions, adopting high pressure structures, which in many cases are common to those of other group Va elements (for a review see Ref. Katzke and Tolédano (2008)), some of which have a surprising complexity as elemental solid structures. At the highest pressures, all Va elements, excluding molecular nitrogen, adopt a BCC structure. While the sequential details vary within the group, what remains unclear in all cases is if the lattice dynamics p a significant role in driving the transitions through these complex structures.
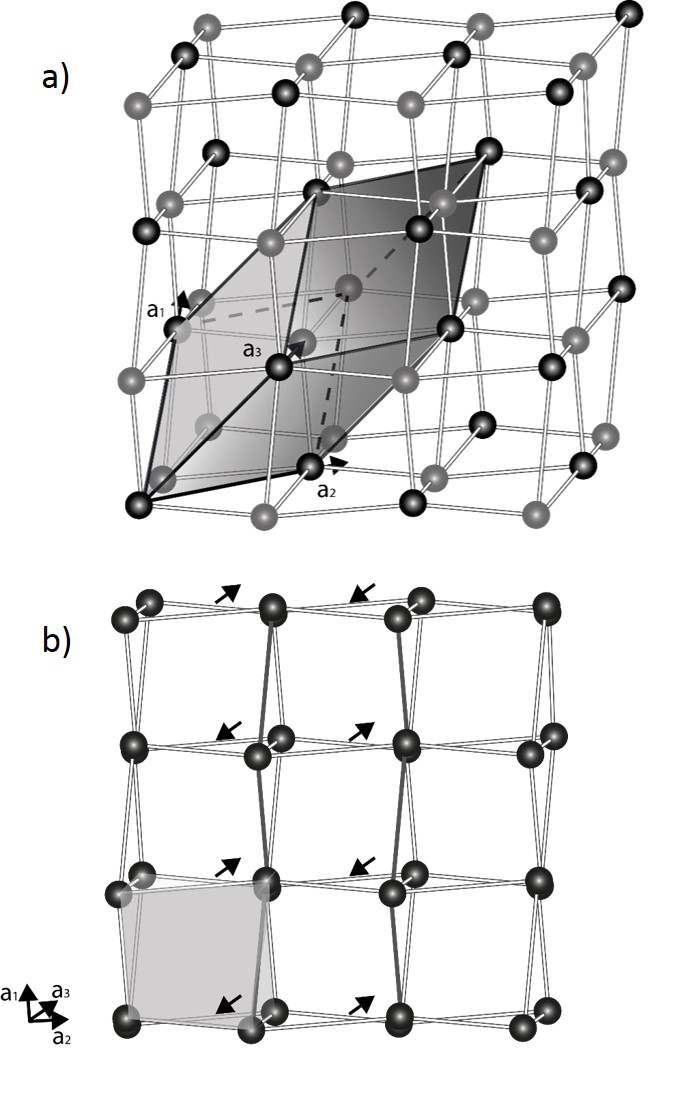
More specifically, in the case of elemental antimony the ambient pressure A7 structure (Rm) known as SbI, emerges from a simple primitive cubic (PC) structure subjected to two displacements, shown in figure 1a. Firstly, an internal-displacement of the two inter-penetrating cubic lattices along a common axis, and secondly, a stretching on the 3-fold axis. The above mechanism lowers the energy of the system while doubling the unit cell size and opening an energy gap in the electronic density of states, hence the rhombohedral distortion of SbI is often referred as Peierls distortion.
Early x-ray diffraction experiments showed that the Peierls distortion decreases at high pressure Iwasaki and Kikegawa (1986), in agreement with ab initio total energy calculations Chang and Cohen (1986); Shick et al. (1999). However, the simple cubic structure, even though continuously approached under pressure, is never stabilized in Sb. Instead, at 10 GPa antimony adopts a host-guest structure (SbII) where both host and guest have body centered tetragonal lattices (BCT) but the latter is incommensurate with the former along the tetragonal c-axis McMahon et al. (2000); Schwarz et al. (2003). At higher pressures (28 GPa), a first-order phase transition takes place towards a BCC structure (SbIII), which is stable up to at least 43 GPa Aoki et al. (1983). The phase diagram of antimony is further enriched by a second incommensurate monoclinic host-guest structure, known as SbIV, which appears in the narrow pressure range from 8 to 9 GPa Degtyareva et al. (2004a).
Clear fingerprints of the above transitions have been identified in the high pressure Raman spectra of antimony. Continuous softening of the zone-center optical phonons was observed over the entire stability range of SbI up to the first transition towards the SbIV phase Wang et al. (2006); Olijnyk et al. (2007); Degtyareva et al. (2007). This effect has been observed in other A7 Va elements, such as As and Bi Beister et al. (1990); Olijnyk et al. (2007), and has been linked to the pressure-induced reduction of the Peierls-like distortion Chang and Cohen (1986); Degtyareva et al. (2007). In addition to this pronounced softening, a large broadening of the Raman peaks was found under pressure, in agreement with ab initio calculations Serrano and Romero (2008). Two potential contributors have been suggested: anharmonic decay channels and a pressure-induced changes in the electron-phonon coupling.
While these investigations have demonstrated the sensitivity of the zone center phonons to both structural and electronic changes under pressure, the role ped by lattice excitations in driving the phase transformations remains unclear. In particular, the phononic contribution in the Peierls distortion reduction and in the ultimate stabilization of the BCC structure needs to be clarified. Momentum-resolved phonon measurements focused on the A7 to PC and A7 to BCC phase transitions are needed to resolve this issue. Phonon dispersion curves along certain high symmetry directions have been obtained via earlier inelastic neutron scattering experiments Sharp and Warming (1971). Nevertheless, up to date a pressure-dependent, momentum-resolved lattice dynamical study has not been reported. Here we address this open issue through a comprehensive study, combining x-ray diffuse scattering (DS) and high pressure inelastic x-ray scattering (IXS), in conjunction with ab initio calculations and a phenomenological analysis of the displacive transformation.
II II. EXPERIMENTAL METHODS
Commercially available, high quality, single crystals of antimony were obtained from SurfaceNet GMBH Sur . A platelet of 50 m thickness was used for ambient pressure measurements while cylinders of 150 m diameter and 50 m thickness were laser cut for the high pressure study. In both cases the samples were etched using a HCl/HNO3 mixture to remove surface damages. Rocking curves of 0.1∘ confirmed the high crystalline quality of the samples.
High pressures were obtained using a gasketed diamond anvil cell (DAC). All measurements were performed at room temperature with compressed helium used as a pressure transmitting medium and the pressure calibration was performed using the ruby luminescence Syassen (2008). The samples were oriented with the rhombohedral [111] axis (hexagonal -axis) perpendicular to the diamond facets. Both crystallographic settings will be used to describe the SbI structure, denoted as HKLR and HKLH for the rhombohedral and hexagonal systems respectively.
The DS and IXS experiments were conducted at beamlines ID23 and ID28 of the European Synchrotron Radiation Facility (ESRF) respectively. A monochromatic beam of with =0.689 Å, corresponding to 17.994 keV of energy, was used for all the DS measurements. The sample was rotated through 360∘ orthogonal to the incoming beam and diffuse scattering frames were collected with an angular slicing of 0.1∘. A Pilatus 6M (Dectris) detector with a pixel size of 172 x 172 m2 was used in single photon counting mode Pil . The CrysAlis software package was used to obtain the orientation matrix and to perform a preliminary data evaluation Cry (2014). All IXS measurements were performed using a 17.794 keV beam (with =0.06968 Å), corresponding to an energy resolution of 3 meV, with a 15 x 13 m2 spot size on the sample surface. Further details about the experimental setup can be found in reference Krisch and Sette (2007).
Additional experiments on a single crystal bismuth sample (SurfaceNet GMBH Sur ) were performed using Pilatus 300K with CdTe sensor material at ID15 ESRF beamline, employing 0.178 Å wavelength and 0.1∘ angular slicing.
III III. Ab-initio CALCULATIONS
Density functional theory ab initio calculations of the lattice dynamics were performed in order to complement and interpret the experiments using the ABINIT software package Gonze et al. (2002, 2016, 2009); Gonze (2005). The antimony electronic structure in the A7 phase was calculated using the Fritz-Haber pseudopotentials by following the description in reference Fuchs and Scheffler (1999)111The readers can ask to the authors for the pseudopotentials used in this work. A grid of 8x8x8 k-points was used to integrate quantities within the Brillouin zone and obtain any electronic property. An energy cutoff of 50 Ha was employed to guarantee energy convergence to less than 10-5 eV/atom and stresses less than 10-3 GPa. The local density approximation was applied to the exchange and correlation energy Kohn and Sham (1965) and the preconditioning method discussed in Ref. Anglade and Gonze (2008) was used to improve the density convergence. The crystal cell optimization and the interatomic force minimization were performed by following the conjugate gradient algorithm as described in Ref. Gonze (1997). The atomic coordinates, lattice vectors, and lattice parameters were fully relaxed under the constraint of constant pressures between 0 and 7 GPa. Additional calculations were performed at a constant volume of 53.5 Å, in order to compare the quality of the calculations with Ref. Serrano and Romero (2008).
The calculated maps are given by direct calculation in one-phonon scattering where the harmonic approximation is considered. Phonon dispersion relations along selected high symmetry directions were obtained by interpolation of the dynamical matrices corresponding to a q-mesh grid of 8x8x8 at each pressure point. These matrices were calculated within the framework of density functional perturbation theory and the linear response method Gonze and Lee (1997); Baroni et al. (2001).
IV V. RESULTS AND DISCUSSION
IV.1 a. Ambient pressure

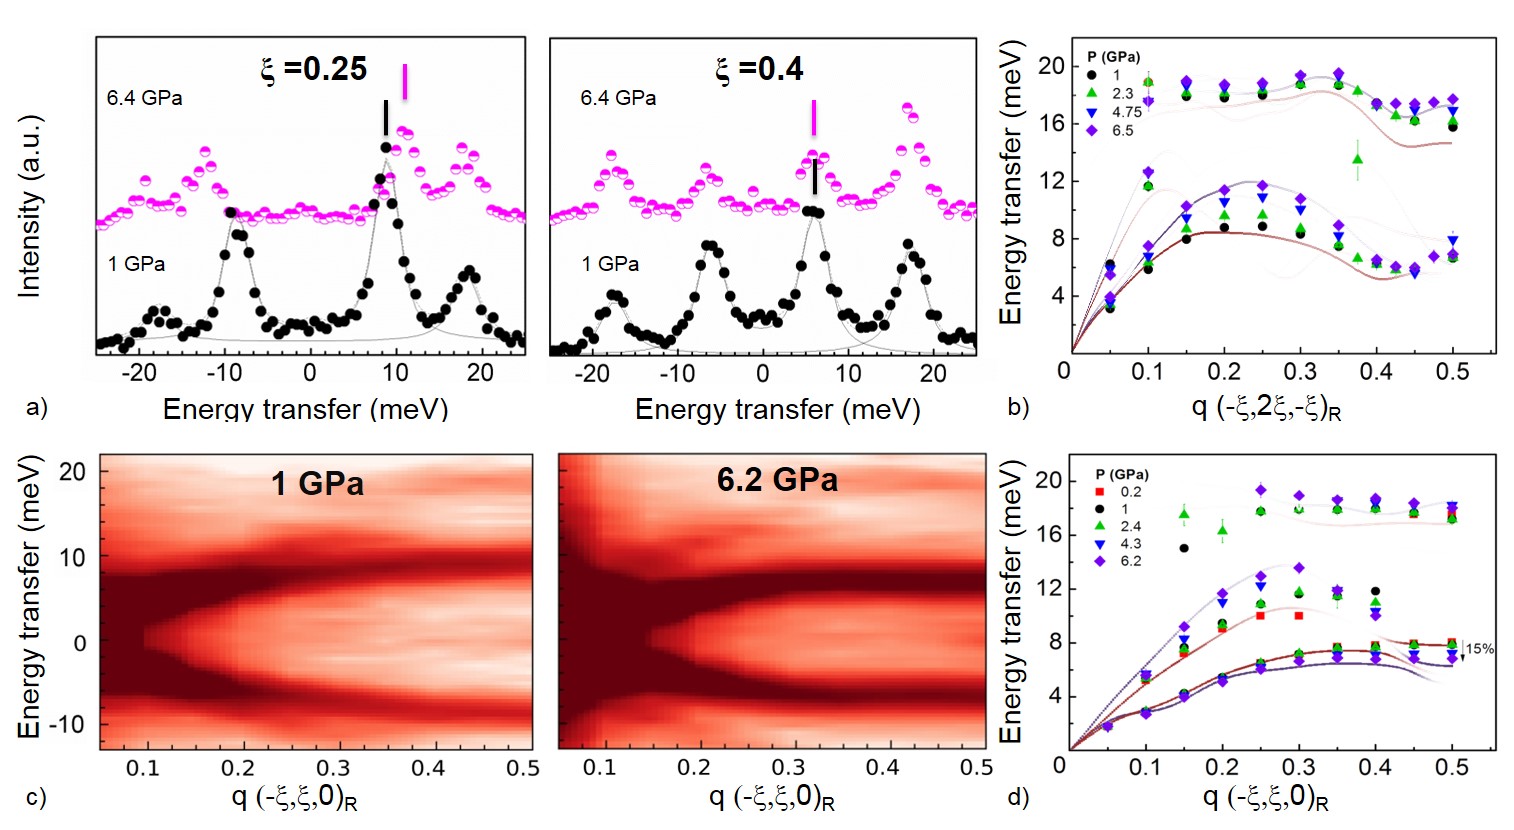
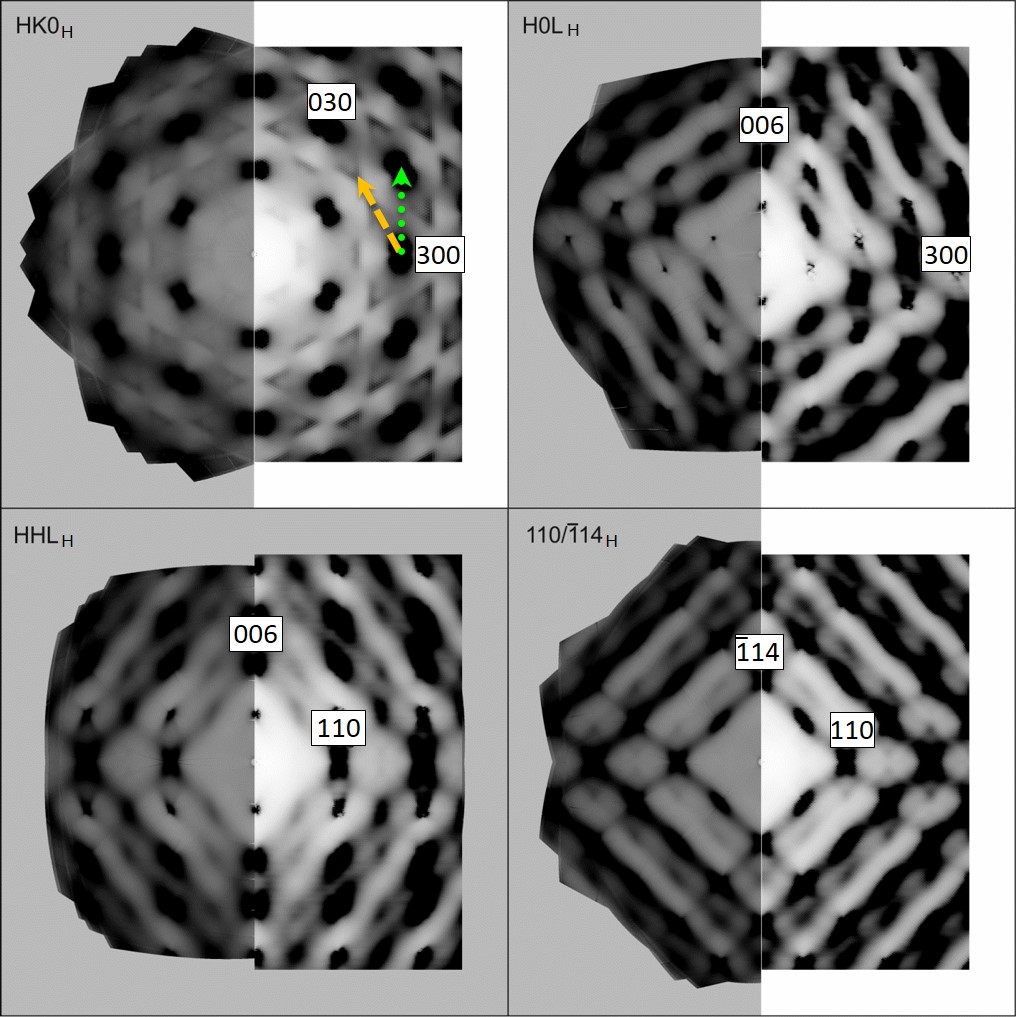
Figure 2 shows the experimental diffuse scattering patterns of antimony, at ambient conditions as reconstructed reciprocal space planes compared with the calculated maps. From the plethora of complex diffuse patterns present in the maps of figure 2, we focus on those most significant to the approaching phase transition. The first notable feature is the diffuse planes in the map, that resembles 4-fold axis symmetry. The planes are identified by the direction normal to the plane or by the direction of the pseudo-cubic structure. They seem to be connected to the chains displacement present as intrinsic distortion in the A7 structure, shown in the figure 1b in which the black arrows help to visualize the displacement with respect to the non-distorted PC structure. Other notable features in the HK0H plane: (1) lines in the direction from the diffuse planes that intersect the HK0H; (2) v-shapes in the direction, shown in figure 2.
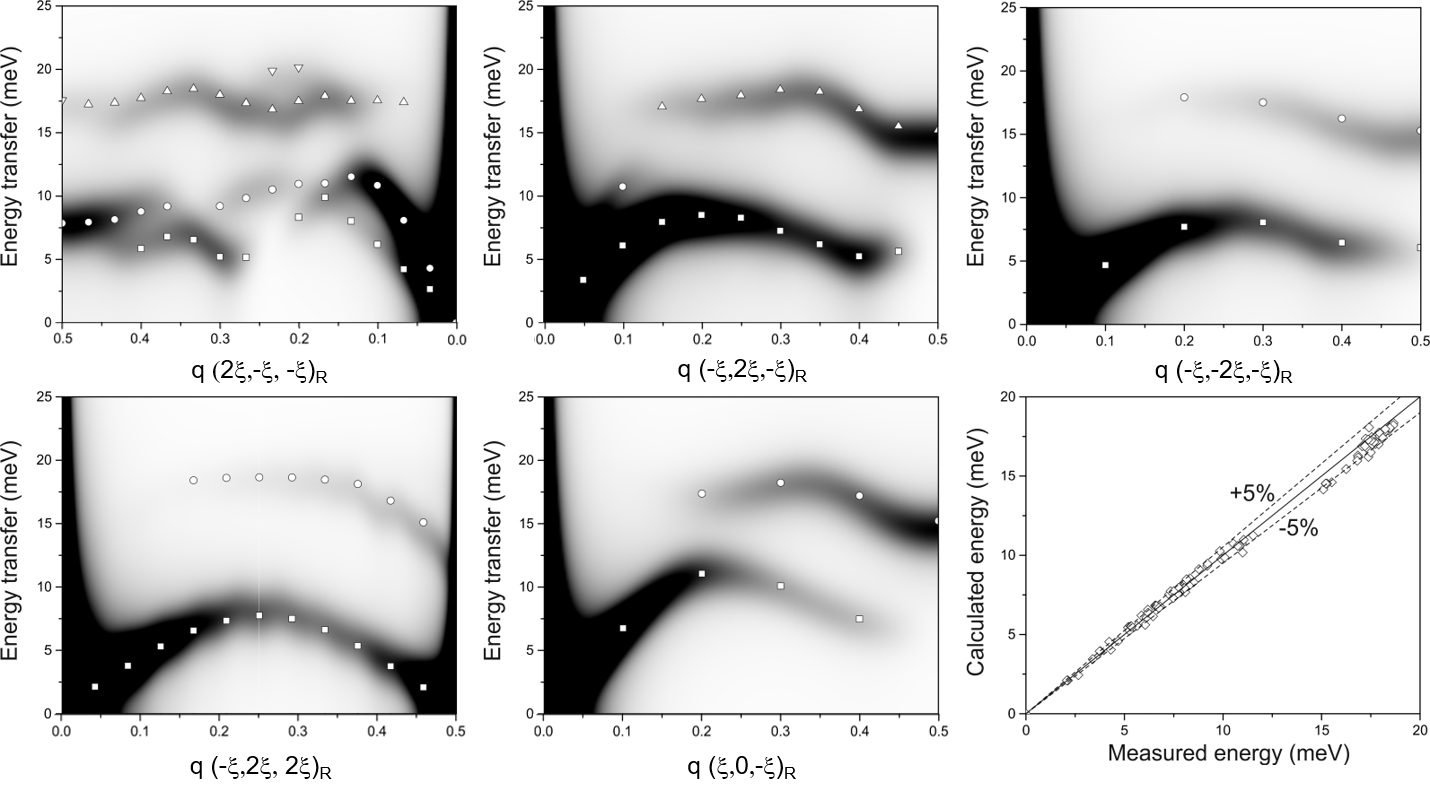
The remarkable agreement between the experimental and calculated maps adds considerable credence to the accuracy of the calculations. However, the experimental intensities on the map are not resolved in energy, showing just a particular sensitivity for low energy features. For this reason, IXS measurements at ambient conditions were performed in order to demonstrate and confirm the liability of the calculations. Figure 3 summarizes the ambient pressure IXS dispersion relations showing a discrepancy of less than observed between experiment and theory results.
Focusing on the phonon dispersions, most directions show a low energy phonon near the zone boundary. One example is in the direction, that corresponds to the v-shape diffuse features. In order to further investigate the nature of such diffuse components which have a dynamic nature, we turned to pressure dependent IXS measurements.
IV.2 b. High pressure
The calculated maps of the HK0H plane at pressures up to 4.7 GPa are shown in figure 4. The diffuse planes visible in the directions are increasing in intensity under pressure. On the contrary, the v-shaped patterns appear not to show any pressure dependence. Figure 5 summarizes the high pressure IXS results along the two directions depicted by green and yellow arrows in figure 4.
In figure 5b, the phonon dispersion curves in the direction () disp the general trend of phonon hardening with increasing pressure. The IXS scans at =0.25 at 1 GPa and 6.5 GPa provide an example of this behaviour, fig. 5a. The optical phonon also shows hardening across the BZ, an effect which is enhanced at the zone boundary. However a softening, or a ”relative softening”, meaning an absence of hardening, is observed for the acoustic branch near the BZ boundary. This is shown in detail in the 1 and 6.5 GPa scans at =0.4 where the acoustic phonon is unchanged in energy (6 meV), see vertical lines in the figure 5a on the right.
In the () direction, the LA (longitudinal acoustic) and TA (transverse acoustic) phonons behave differently under pressure, fig. 5c,d. According to the theory there should be an anticrossing between LA and TA around =0.43. The intensity of the longitudinal phonon almost disappears while the transverse one remains measurable. The LA softens by , whereas the TA behaves similarly to the phonon in the direction: from to =0.3 there is a pressure-induced hardening and post =0.4 until the zone boundary a softening of , fig. 5d.
While the calculations are generally in good agreement with the experimental results, two main differences are found. Firstly, the calculated optical phonons in the direction indicate a greater pressure induced hardening and a shift to lower energies than what was observed experimentally. Secondly, theory predicts a greater softening of the TA than the one observed in the IXS experiment ( compared to the 15 ).


| Phase transition | Critical vector (k) | Point or direction in the BZ 22footnotemark: 2 |
|---|---|---|
| k=2/5 (b-b)-1/5 b | ||
| SbIII - SbII (SbIV) | and | and |
| k= 2/5 (b-b- b) | ||
| PC - SbI | k=1/2 (b+b+b) | RPC |
| SbIII - PC | k=1/2 (b+b-b) | HBCC |
a) Direction in the Brillouin zones referred to fig. 7.
IV.3 c. Phase transitions mechanisms and reciprocal space critical vectors
In order to understand and classify the dynamical behaviour at high pressure, we analyze the corresponding phase transition mechanisms using and completing existing data Katzke and Tolédano (2008). To this purpose we integrate all the structural data in a unified scheme of a single parent structure, not in direct but in reciprocal space. As already mentioned in the introduction, the logical choice of a parent structure for the group Va elements is the high-pressure BCC [SbIII, space group Imm(Z=1), A2 structure type], as it is present in the P-T phase diagrams of all elements belonging to the group. Another structure common to all Va group elements is the low pressure rhombohedral Rm(Z=2) (SbI, A7) phase. However, SbI has been shown to be a slightly distorted version of the simple cubic structure [(pseudo)SbI, Pmm(ZpI=1)] stabilized at higher pressure in some of the group Va elements (for instance, PVI or AsII) Degtyareva et al. (2004b); Degtyareva (2010). Since SbI under pressure relaxes toward PC and this last structure is reached by other Va group elements, such as arsenic and phosphorus, the phase transition between the two has been included in the discussion. The corresponding critical vector for the A7 to PC transition, k13=1/2(b1+b2+b3)P, ends at the R-point of the PC Brillouin zone (BZ), see figure 6. In order to simplify the discussion, the pseudo-cubic structure will substitute the distorted A7 for the following part. Thus, without loss of generality, one may consider the quartet of phases “ (pseudo)SbI - SbIV - SbII - SbIII “ as representative not only for Sb but for other Va group elements. Such a scheme becomes even better justified if one notes that the intermediate, incommensurate, tetragonal and monoclinic structures (SbII and SbIV) are very similar in all studied elements Degtyareva et al. (2004b, a) and structurally interlinked by negligible distortions.
Analysing the ferrodistorsive (ZpI=ZIII) transformation between the pseudo-PC and SbIII one finds that a “group-subgroup” relationship is broken for their space groups Pmm(ZpI=1) and Imm(ZIII=1). The latter conclusion is also valid for the R - Imm(1) transformation. A phenomenological scheme for such reconstructive phase transitions should contain an intermediate phase whose space group is a common subgroup, normally maximal, for both high-symmetry phases Tolédano and Dmitriev (1996). A relevant geometrically optimal pathway for Sb would occur via antiparallel shifts of alternating (001)BCC atomic planes in the [110]BCC directions. The shifts reduce the crystal symmetry from cubic to orthorhombic Cmcm(2) for general magnitude displacements, then restore it to cubic for special shifts. The corresponding dynamic instability ( “ soft mode “) develops at the HBCC-point [k=1/2(b+b-b)], see figure 7. However, energy minimization criteria, due to the deviation of the atomic interaction character from the simplest spherical, can produce an alternative pathway and this is the case in Sb. It has been shown in earlier DFT calculations Haussermann et al. (2002), that the complex interp between electrostatic (Madelung) energy EMad and the band energy Eband stabilizes the pressure controlled structural sequence in Sb: Eband governs the structural stability at low pressure while EMad dominates at high pressure, stabilizing the densely packed BCC, giving rise to the complex intermediate, incommensurate, structures and directing atoms along a non-trivial pathway from PC to BCC.
Moreover, a universal trend to stabilize intermediate, incommensurate, structures in the vicinity of reconstructive phase transitions was recently predicted in the framework of more general approach Korzhenevskii and Dmitriev (2015). A model-free, symmetry based theory introduces a universal mechanism for the formation and stabilisation of such inhomogeneous states. The mechanism accounts for elastic properties of the crystal lattice via a bi-linear coupling between critical displacement gradients (possible non-uniform order-parameter distribution) and secondary strains. The importance of the latter in reconstructive mechanisms is widely recognized.
Propagation of distortion in the intermediate SbII and SbIV structures is defined by two reciprocal space vectors: (i) the long-periodic but commensurate k1=2/5(b1-b2)-1/5b3 which lies in the NBCC- -HBCC plane, and (ii) the incommensurate k8=(b1+b2-b3), which belongs to the - -HBCC line perpendicular to this plane. Remarkably, the k varies towards the HBCC-point, and BCC (SbIII), therefore, could be considered as a ”lock-in” phase or vice versa. Figure 7 and table 1 summarise the set of critical points, lines and planes in the BCC reciprocal space.
IV.4 d. Phase stability
The measurements presented in this work, together with previously reported experimental data (Degtyareva et al., 2007; Wang et al., 2006), allow us to conclude that antimony follows the general trend of group Va elements: the rhombohedral A7 structure seeks to increase its symmetry and stabilize the PC phase. The two main observations supporting this conclusion are as follow. First, the Raman results on SbI Degtyareva et al. (2007); Wang et al. (2006) revealed simultaneous softening of two modes, (Ag) and (Eg), as one increases pressure. These modes originate from the BZ folding which transfers the critical, triply degenerated, R phonon mode from the PC BZ R-node to the A7 BZ centre (-point, Fig. 6 ), splitting it into two Raman active modes and . Second, the phonon dispersion branches observed by IXS in the direction, highlighted as orange arrow in figure 7. It lies near the direction and exhibits a ”relative softening” under pressure. The partial mode softening seen in Raman study Degtyareva et al. (2007); Wang et al. (2006) combined with the current results and analysis indicate one is approaching the stability limit of the rhombohedral phase with respect to cubic one. In both cases, only partial softening is observed.
Instead, antimony follows a pathway containing monoclinic and tetragonal incommensurate phases that is favoured energetically prior to stabilise the BCC phase. To quantify this, we measured by IXS the direction (green arrow in figure 7). It is near the BCC-SbII critical vector and in plane with the BCC-pseudo-PC(A7) critical vector. A more intense softening is found, with a decrease in energy of the 15 .
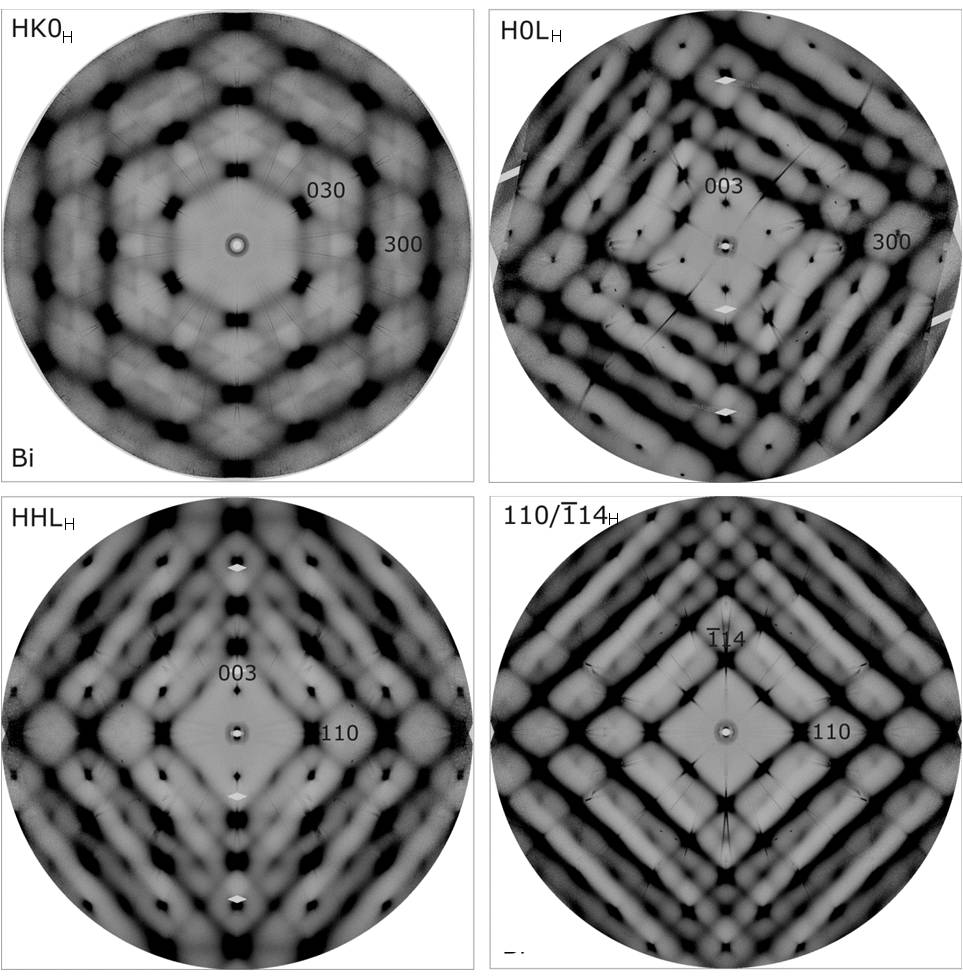
We conclude our work by reporting the diffuse scattering maps collected on other element of the Va group, bismuth. In figure 8, the measured maps did not reveal any qualitative features different from those of antimony, therefore, we expect a similar pressure trend for this element. Indeed, according to earlier studies, bismuth follows a similar structural path to antimony Katzke and Tolédano (2008); McMahon et al. (2000); Degtyareva et al. (2004b); Aoki et al. (1982).
V Conclusion
The lattice dynamics of antimony at both ambient and high pressure conditions show anomalies that are understood by means of ab initio calculations and phase transition mechanisms analysis. This study focused on the pressure dependence of the phonon dispersions along two critical directions in the reciprocal space corresponding to the canonical Va group phase transitions. The reconstructive phase transition analysis was employed with a focus on those two mechanisms: I) the A7-PC transition, which describes the relaxation of the rhombohedral distorted structure that is never reached in this particular system and II) the A7-BCC transition, which passes through two incommensurate structures. In the first case, the relevant phonon dispersion shows a relative softening under pressure, while for the second one, a bigger pressure-induced softening of is observed along the direction. While both transition mechanisms are mirrored in the phonon dispersions of antimony, the strongest phonon softening is related to A7-BCC transition, which is also the more energetically favorable. The competition of those two mechanisms induces the observed complex behavior of antimony under pressure.
This paper is part of the PhD project of A.Minelli. For more information and supplementary data, please consult the online version Minelli (2018).
VI Acknowledgement
The authors would like to thank Karl Syassen for the fruitful discussions and encouragement. Denis Gambetti and Jeroen Jacobs are also thanked for technical support during the experiment in ID28 and Sasha Popov for the scientific support in the preliminary diffuse scattering experiment at ID23. A. H. R. acknowledge the support of NSF under grants 1434897, 1740111 and DOE under grant DOE DE-SC0016176. This work used the Extreme Science and Engineering Discovery Environment (XSEDE), supported by National Science Foundation grant number OCI-1053575. Additionally, the authors acknowledge the computing support from Texas Advances Computer Center (TACC) with the Stampede 2 and Bridges supercomputer at Pittsburgh Supercomputer Center.
References
- Katzke and Tolédano (2008) H. Katzke and P. Tolédano, Phys. Rev. B 77, 024109 (2008).
- Iwasaki and Kikegawa (1986) H. Iwasaki and T. Kikegawa, Physica B+C 139-140, 259 (1986).
- Chang and Cohen (1986) K. J. Chang and M. L. Cohen, Phys. Rev. B 33, 7371 (1986).
- Shick et al. (1999) A. B. Shick, J. B. Ketterson, D. L. Novikov, and A. J. Freeman, Phys. Rev. B 60, 15484 (1999).
- McMahon et al. (2000) M. I. McMahon, O. Degtyareva, and R. J. Nelmes, Phys. Rev. Lett. 85, 4896 (2000).
- Schwarz et al. (2003) U. Schwarz, L. Akselrud, H. Rosner, A. Ormeci, Y. Grin, and M. Hanfland, Phys. Rev. B 67, 214101 (2003).
- Aoki et al. (1983) K. Aoki, S. Fujiwara, and M. Kusakabe, Solid State Commun. 45, 161 (1983).
- Degtyareva et al. (2004a) O. Degtyareva, M. I. McMahon, and R. J. Nelmes, Phys. Rev. B 70, 184119 (2004a).
- Wang et al. (2006) X. Wang, K. Kunc, I. Loa, U. Schwarz, and K. Syassen, Phys. Rev. B 74, 134305 (2006).
- Olijnyk et al. (2007) H. Olijnyk, S. Nakano, and K. Takemura, Phys. Status Solidi B 244, 3572 (2007).
- Degtyareva et al. (2007) O. Degtyareva, V. V. Struzhkin, and R. J. Hemley, Solid State Commun. 141, 164 (2007).
- Beister et al. (1990) H. J. Beister, K. Strössner, and K. Syassen, Phys. Rev. B 41, 5535 (1990).
- Serrano and Romero (2008) J. Serrano and A. H. Romero, High Press Res 28, 477 (2008).
- Sharp and Warming (1971) R. I. Sharp and E. Warming, J. Phys. F: Met. Phys. 1, 570 (1971).
- (15) http://www.surfacenet.de .
- Syassen (2008) K. Syassen, High Pressure Research 28, 75 (2008).
- (17) https://www.dectris.com/ .
- Cry (2014) Agilent. CrysAlis PRO.Agilent Technologies Ltd, Yarnton, Oxfordshire, England. (2014).
- Krisch and Sette (2007) M. Krisch and F. Sette, Light Scattering in Solid IX (Springer Berlin Heidelberg, Berlin, Heidelberg, 2007) pp. 317–370.
- Gonze et al. (2002) X. Gonze, J.-M. Beuken, R. Caracas, F. Detraux, M. Fuchs, G.-M. Rignanese, L. Sindic, M. Verstraete, G. Zerah, F. Jollet, et al., Comput. Mater. Sci. 25, 478 (2002).
- Gonze et al. (2016) X. Gonze, F. Jollet, F. A. Araujo, D. Adams, B. Amadon, T. Applencourt, C. Audouze, J.-M. Beuken, J. Bieder, A. Bokhanchuk, et al., Comput. Phys. Commun. 205, 106 (2016).
- Gonze et al. (2009) X. Gonze, B. Amadon, P.-M. Anglade, J.-M. Beuken, F. Bottin, P. Boulanger, F. Bruneval, D. Caliste, R. Caracas, M. Côté, et al., Comput. Phys. Commun. 180, 2582 (2009).
- Gonze (2005) X. Gonze, Z. Kristallogr. Cryst. Mater. 220, 558 (2005).
- Fuchs and Scheffler (1999) M. Fuchs and M. Scheffler, Comput. Phys. Commun. 119, 67 (1999).
- Note (1) The readers can ask to the authors for the pseudopotentials used in this work.
- Kohn and Sham (1965) W. Kohn and L. J. Sham, Phys. Rev. 140, A1133 (1965).
- Anglade and Gonze (2008) P.-M. Anglade and X. Gonze, Phys. Rev. B 78, 045126 (2008).
- Gonze (1997) X. Gonze, Phys. Rev. B 55, 10337 (1997).
- Gonze and Lee (1997) X. Gonze and C. Lee, Phys. Rev. B 55, 10355 (1997).
- Baroni et al. (2001) S. Baroni, S. De Gironcoli, A. Dal Corso, and P. Giannozzi, Rev. Mod. Phys. 73, 515 (2001).
- Degtyareva et al. (2004b) O. Degtyareva, M. I. M. Mahon, and R. J. Nelmes, High Pressure Res. 24, 319 (2004b).
- Degtyareva (2010) O. Degtyareva, High Pressure Res. 30, 343 (2010).
- Tolédano and Dmitriev (1996) P. Tolédano and V. Dmitriev, Reconstructive phase transitions: in crystals and quasicrystals (Word Scientific Publishing, Singapore, 1996).
- Haussermann et al. (2002) U. Haussermann, K. Saderberg, and R. Norrestam, J. Am. Chem. Soc. 124, 15359 (2002).
- Korzhenevskii and Dmitriev (2015) A. L. Korzhenevskii and V. Dmitriev, J. Phys.: Condens. Matter 27, 375401 (2015).
- Aoki et al. (1982) K. Aoki, S. Fujiwara, and M. Kusakabe, J. Phys. Soc. Jpn. 51, 3826 (1982).
- Minelli (2018) A. Minelli, Monophosphate tungsten bronzes and antimony: the interplay of framework instability and electron-phonon coupling., phdthesis, Université Grenoble Alpes (2018).