Discovery of Soft X-ray Pulsations from PSR J12311411 using NICER
Abstract
We report the discovery of soft X-ray pulsations from the nearby millisecond pulsar PSR J12311411 using NICER. The pulsed emission is characterized by a broad and asymmetric main pulse and a much fainter secondary interpulse, with a total pulsed count rate of 0.055 c s-1 in the 0.35–1.5 keV band. We analyzed Fermi LAT data to update the pulse timing model covering 10 years of data and used that model to coherently combine NICER data over a year of observations. Spectral modeling suggests that the flux is dominated by thermal emission from a hot spot (or spots) on the neutron star surface. The phase relationship between the X-ray pulse and the radio and rays provides insight into the geometry of the system.
1 Introduction
Millisecond pulsars (MSPs) are an old (Gyr) population of neutron stars that are characterized by rapid spins ( ms) and exceptional rotational stability; they are the expected evolutionary outcomes of spin-up by accretion in X-ray binaries (Alpar et al. 1982 for the seminal work; and Tauris & van den Heuvel 2006 for a recent review).
With a small number of notable exceptions, X-ray pulsations from rotation-powered MSPs typically have soft, blackbody-like spectra due to the cooling surface and/or hot spot(s) (e.g., Zavlin, 2006; Bogdanov et al., 2006), with the bulk of photon flux detected below 2 keV and luminosities in the range erg s-1. This emission is commonly attributed to return currents along open field lines heating the magnetic polar caps to temperatures K (Harding & Muslimov, 2001, 2002). The X-ray pulsations tend to be broad but can have moderately high fractional pulsed amplitudes (30–70%; see Bogdanov & Grindlay, 2009; Bogdanov, 2013), implying an anisotropic emission pattern from the surface, such as may arise due to a light element neutron star atmosphere (e.g., Romani, 1987; Zavlin et al., 1996).
The Neutron Star Interior Composition Explorer (NICER; Gendreau & Arzoumanian 2017) has been operating as an attached payload on the International Space Station (ISS) since 2017 June. One of its primary science goals is to search for X-ray pulsations from a large number of known and candidate neutron star systems to reveal information on their energetics, evolution, and emission mechanisms. Another key motivation is to find rotation-powered millisecond pulsars that exhibit strong thermal pulsations from surface hot spots. Careful modeling of the energy-dependent pulse profiles of MSPs can provide precise constraints on the mass and radius of the neutron star (Bogdanov et al. 2007; see also Watts et al. 2016 for an overview). Prior to the NICER launch, the most promising such pulsars known were PSR J04374715 and J00300451. In addition, the 3.68 ms pulsar J12311411 was known to emit thermal X-rays (Ransom et al., 2011), but had never been observed with an instrument and mode capable of testing whether these X-rays were pulsed. Consequently, this pulsar was the highest priority target for the NICER Pulsation Search and Multiwavelength Coordination working group (Ray et al., 2017).
PSR J12311411 was discovered in one of the first radio pulsation searches that targeted Fermi Large Area Telescope (LAT) -ray sources that were unassociated with any probable counterpart (Ransom et al., 2011) at other wavelengths, a technique that turned out to be exceptionally successful (Ray et al., 2012), with at least 87 MSPs discovered to date. The pulsar is in a 1.86 day orbit about a white dwarf companion with minimum mass 0.19 and is nearby, with a dispersion measure distance of only 420 pc (Yao et al., 2017). It is the brightest MSP in the -ray band with a flux MeV of 9.2(4) ph cm-2 s-1 ( erg cm-2 s-1; Abdo et al. 2013)111Here, and elsewhere in this paper, the number in parentheses is the uncertainty in the last digit.. Assuming a neutron star moment of inertia of g cm2, the Shklovskii-corrected (Shklovskii, 1970) spindown luminosity is erg s-1, yielding a -ray efficiency () of 46% (Abdo et al., 2013).
In this paper, we describe a deep NICER observation of PSR J12311411 and the analysis that resulted in the discovery of X-ray pulsations from this system.
2 Observations
NICER’s (Gendreau et al., 2016) X-ray Timing Instrument (XTI) is an array of 56 co-aligned X-ray optics that concentrate X-rays in the 0.2–12 keV band onto an array of 56 single-pixel silicon drift detectors (52 currently functioning on orbit). Each optic is paired with a detector and associated readout electronics, called Focal Plane Modules (FPMs). The peak collecting area of the XTI is 1900 cm2 at 1.5 keV. All photons are individually time tagged with an achievable accuracy relative to GPS time of better than 100 ns (LaMarr et al., 2016; Prigozhin et al., 2016).
NICER observations are made up of short dwells that are a fraction of the ISS orbit in duration (typically hundreds to 2500 seconds). All dwells from a given UTC day are grouped into a single ObsID for pipeline processing and delivery to the HEASARC archive. We collected data from 13 ObsIDs during the commissioning phase (prior to 2017 July 13) and 312 ObsIDs during the science operations phase up through 2018 July 26, for a total raw observing time of 1254.5 ks.
Event energies are defined by the PI column (the Pulse Invariant, in units of 10 eV) in the science data, which is computed from the raw pulse height by the NICER data pipeline (version 10-master_20180226 and CALDB xti20180226). In all of our event data, we filtered out events flagged as non-photon triggers (see Prigozhin et al. 2016, for a detailed description of the detector system). The detector electronics process pulses in parallel by two analysis chains, one with a slow shaping time (465 ns; optimized for precise energy measurements) and one with a fast shaping time (84 ns; optimized for precise time measurement). Each chain that triggers produces its own pulse height measurement. We accept only events where at least the slow channel is triggered and so our energy measurements are always based on the slow pulse height. The timing comes from the fast chain, unless it did not trigger, in which case the slow chain is used. Because of the longer peaking time, there is a systematic offset in the time stamps of events that trigger only the slow chain. This fine clock correction is applied by the NICER pipeline. The fast chain triggers for the majority of events above 1 keV (LaMarr et al., 2016). When both chains are triggered, we remove events where . This cut excludes events that occur far from the center of the detector, which are most likely to be particle events rather than source photons.
We analyzed our data using HEASoft 6.25222Available at https://heasarc.nasa.gov/lheasoft/ and NICERDAS 2018-10-07_V005. We initially selected good time intervals using nimaketime with the following screening criteria: 1) ISS outside the NICER-specific South Atlantic Anomaly (SAA) boundary; 2) NICER in tracking mode with pointing direction ° from the source direction with at least 38 detectors enabled; 3) source elevation ° above the Earth limb; 4) source direction at least 30° from the bright Earth; and 5) magnetic cutoff rigidity GeV/. Applying these cuts resulted in a selection of 985 ks of filtered data.
We have found that in some cases, the background (particularly at soft energies) is dominated by a few ‘hot’ detectors, with some detectors much more likely to be affected by optical loading. In our analysis, we always excluded detector IDs 14, 34, and 54 for this reason.
Although the basic good time cuts exclude the very high background region of the SAA, the ISS orbit also traverses regions of high latitude, referred to as the ‘polar horns’, where the magnetic cutoff rigidity gets very low and particle backgrounds can be high and variable. We filter the worst parts of these regions by selecting a minimum cutoff rigidity value (as described above). However, this cut does not fully remove all high background intervals in the data. Increasing the minimum rigidity will exclude more high background regions, but would also exclude a substantial amount of time where the background is low. Since the count rate from the pulsar is low ( s-1) and constant, we filtered high background intervals using a count rate cut, which preserves the low background time in the polar horns. To accomplish this, we made a 16-second binned light curve of the 0.3–8 keV events (after all filtering described above). We then filtered out all event data in bins where the count rate exceeded 2.5 s-1. This cut reduced our processed good time to 916 ks, which formed the basis for our analyses.
3 Timing
3.1 Fermi LAT Timing
We started from the pulsar timing model published with the Fermi Second Pulsar Catalog (2PC; Abdo et al. 2013). This timing model showed significant drift when extrapolated over the 5 years since that publication, so we updated it using Fermi LAT data, as described below.
Using the Pass 8 R2 data set (Atwood et al., 2013), we extracted LAT ‘Source class’ events with energies above 300 MeV from within 1.0° of the pulsar over the date range 2008 August 4 to 2018 February 14, and applied a zenith angle cut of 100°. We fitted the timing model parameters using an unbinned Markov Chain Monte Carlo (MCMC) Maximum Likelihood technique (see Abdo et al. 2013 and Pletsch & Clark 2015); PINT (Luo et al., 2019) includes an open-source implementation of this technique, called event_optimize. The underlying MCMC engine is emcee (Foreman-Mackey et al., 2013), which uses affine transforms to efficiently explore high-dimensional parameter spaces and map out parameter confidence regions, even when they are highly correlated.
For the pulse template we used a three-Gaussian model and for the necessary photon weights (), we used an empirical calculation based on a typical -ray pulsar spectrum and an approximation to the LAT point spread function as a function of energy and angular offset from the pulsar position (Bruel, 2019). The weights represent the probability that the photon originated from the pulsar, as opposed to other point sources or the diffuse background.
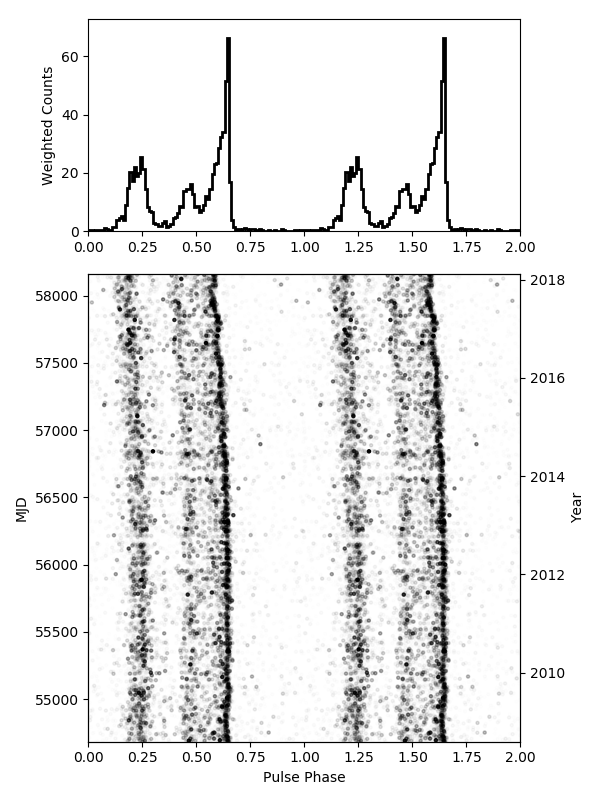
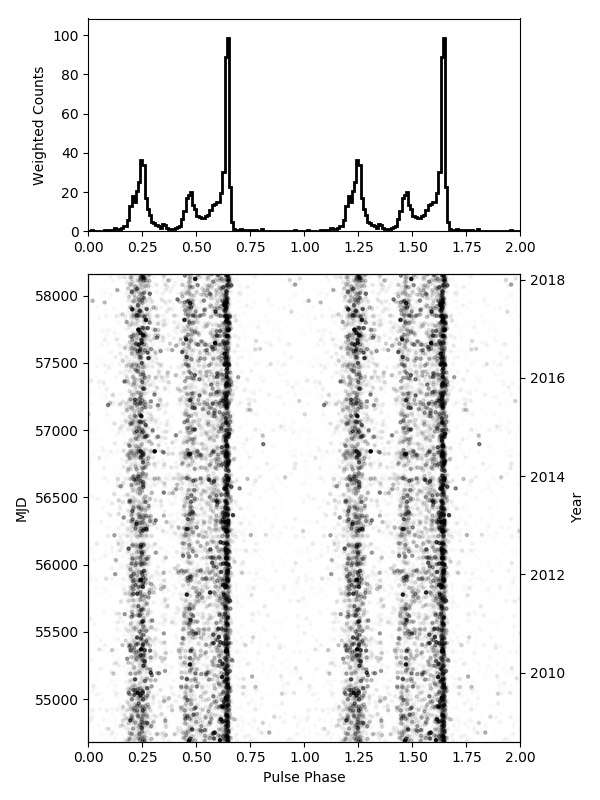
In this calculation, we fit for the spin frequency and its derivative, the position and proper motion of the pulsar, and the binary parameters using the ELL1 model appropriate for nearly circular orbits (Lange et al., 2001). The maximum likelihood model along with uncertainties estimated from the posterior probability distribution are shown in Table 1. A phaseogram showing the full Fermi dataset before and after updating the timing model is shown in Figure 1.
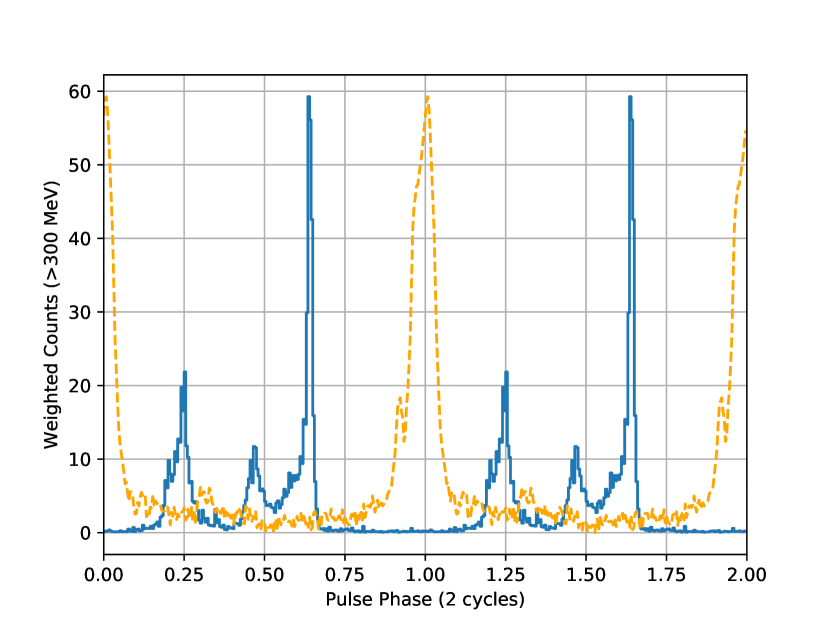
Throughout this work, we adopt the same phase 0 definition as was used in 2PC, specified by the TZR parameters (which define a pulse time of arrival that has phase 0.0 according to the model) in Table 1. A plot of the Fermi pulse profile, phase-aligned with the 1408 MHz radio profile is shown in Figure 2.
| Parameter | Value |
|---|---|
| Right Ascension (, J2000) | 12h31m113131(1) |
| Declination (, J2000) | 14°11′43642(3) |
| Proper Motion in R.A. (, mas yr-1) | 61.5(7) |
| Proper Motion in Decl. (, mas yr-1) | 6.6(3) |
| Epoch of position (MJD) | 55000.0 |
| Pulse frequency (, Hz) | 271.453019624388(4) |
| Frequency derivative (, s-2) | |
| Epoch of frequency | 55000.0 |
| Dispersion Measure (cm-3) | 8.09 |
| Binary Model | ELL1 |
| Binary Period (, d) | 1.8601438845(2) |
| Semimajor axis (, lt s) | 2.042625(1) |
| Epoch of ascending node (, MJD) | 55015.1534653(2) |
| First Laplace parameter () | 10(7) |
| Second Laplace parameter () | 3(8) |
| Timescale | TDB |
| Solar System Ephemeris | DE421 |
| TZRMJD | 55242.107268755294338103444 |
| TZRFRQ | 1408.0 |
| TZRSITE | ncy |
3.2 NICER Pulsation Search
Using the timing model from Table 1, we searched for pulsations in the NICER data. We note that a 1.0 second offset is present in the raw NICER science data, due to a time assignment error in the on-board software. This was discovered early in the mission by comparison of absolute arrival times of X-ray and radio pulsations from the Crab Pulsar, PSR B1937+21 and PSR B182124, in support of the SEXTANT pulsar navigation experiment (Mitchell et al., 2018). In the current pipeline processing, this correction is applied by setting the FITS header parameter TIMEZERO to s in the data distributed by the HEASARC.
Pulse phases for each photon were computed using the photonphase code in PINT For each photon, the position of NICER is interpolated from the orbit file (which has state vector points at 10 second intervals) and used to compute the Solar System time delays in the computation of the model phase.
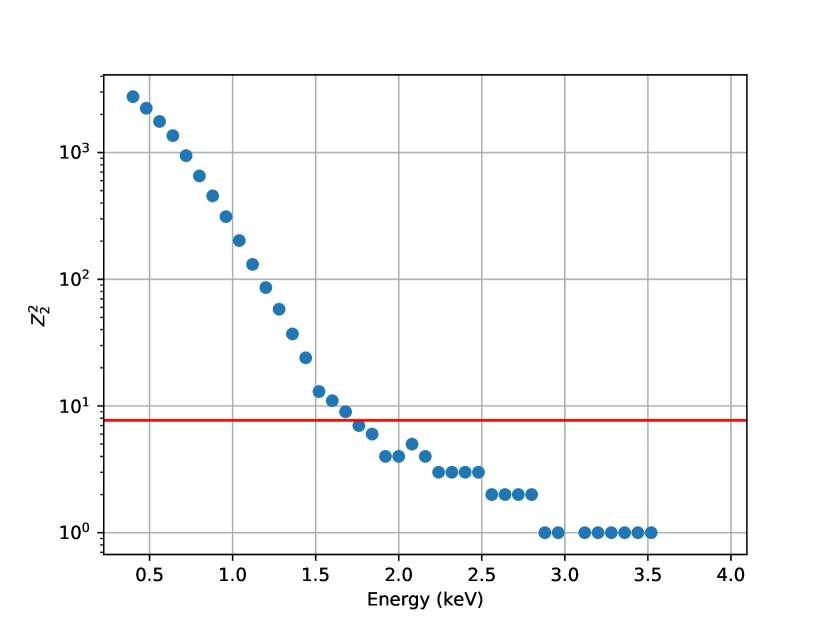
With pulse phases assigned, we computed the H-test (de Jager et al., 1989) and detected pulsations with a significance of 55.3 () for our initial energy cuts of 0.3–8 keV. The maximal H-test (, corresponding to 69.7) is obtained when selecting an energy range of 0.31 to 1.51 keV, suggesting that the pulses are thermal, as expected from the soft spectrum and broad pulses. To look for evidence of a hard pulsed component, we computed the test (appropriate for the smooth pulse profile observed; de Jager et al. 1989) for different minimum energy cuts, as shown in Figure 3. We see no evidence for a pulsed signal above 1.7 keV.
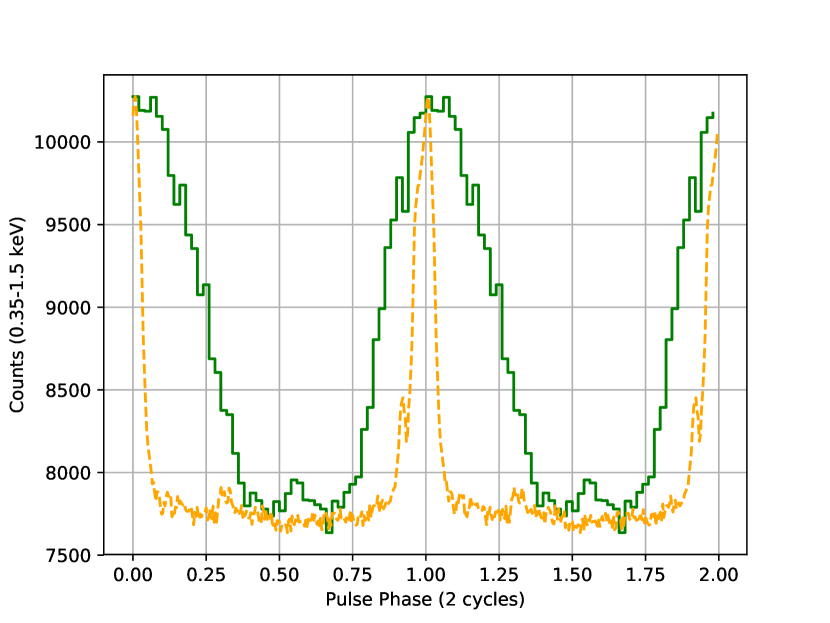
We computed the amplitudes of the first 20 Fourier components from the unbinned pulse phases and found that only the fundamental and first two harmonics are significant above the level. The pulse profile with the three harmonic decomposition is shown in Figure 4, while the X-ray and radio phase-aligned profiles are shown in Figure 5. The pulsed count rate is 0.055 c s-1 (0.35–1.5 keV), while the unpulsed background is 0.422 c s-1. The unpulsed background contains contributions from radiation background, diffuse X-ray background, detector noise, and unpulsed emission from the source. The spectral analysis presented in §4 gives a total source count rate of 0.145 c s-1 (0.35–1.5 keV), yielding a pulsed fraction of 38% in that energy band. There is a substantial systematic uncertainty in the pulsed fraction, which is dominated by the uncertainty in the background model (since the background gives 2/3 of the total count rate observed). Archived XMM-Newton imaging observations ( ks, Ransom et al. 2011) show that there are no strong contaminating sources in the NICER field of view, so the uncertainty comes from cosmic variance in the diffuse X-ray background and inaccuracies in the model of the radiation background.

4 Spectral analysis
The event filtering used to generate the spectrum of PSR J12311411 differs from that described in §2. Indeed, a more stringent filtering permits minimizing non-astrophysical background (particle flaring, optical loading on the detectors, etc.), especially for faint sources such as PSR J12311411. In addition to the filtering described in §2, we exclude observations where the Sun angle is .
In addition, we apply a filter based on the cutoff rigidity (COR_SAX) and a housekeeping parameter (FPM_OVERONLY_COUNT) that counts detector overshoots (large energy depositions in the detector), which are strongly correlated with the radiation background level. Specifically, we filter out time intervals with or . This empirical relation maximizes exposure, even at low cut-off rigidities (), as long as the is not too large. This filtering results in 723.7 ks of exposure.
| Component | Parameter | BB+PL | BB+BB | nsatmos |
|---|---|---|---|---|
| tbabs | () | 5 | 6 | 0.80.4 |
| Gaussian | (keV) | 0.5770.004 | 0.5750.004 | 0.5760.004 |
| (keV) | 0.030 | 0.036 | 0.025 | |
| Norm ( ph ) | 2.8 | 3.8 | 1.60.2 | |
| bbodyrad | (eV) | 136 | 44 | – |
| Norm () | 35 | 43500 | – | |
| bbodyrad | (eV) | – | 133 | – |
| Norm () | – | 59 | – | |
| powerlaw | 5.0 | – | – | |
| Norm (ph ) | (8.1) | – | – | |
| nsatmos(1)(1)footnotemark: | (eV) | – | – | 512 |
| Norm | – | – | 0.100.02 | |
| () | 1.61 | 1.61 | 1.62 | |
| (d.o.f.) | 1.63 (71) | 1.52 (71) | 1.54 (73) | |
Note. — BB=bbodyrad, PL=powerlaw. All errors reported are at 90% confidence.
The background spectrum was generated from a grid of NICER blank-sky spectra corresponding to the blank-sky pointings of Rossi X-ray Timing Explorer (Jahoda et al., 2006). This grid of spectra is populated with observed spectra in various space-weather observing conditions (Gendreau et al. in prep.). The background spectrum is generated by combining these blank-sky spectra weighted according to space-weather conditions and magnetic cutoff rigidities common to both the pulsar and background-fields observations.
We used the spectrum in the 0.3–1.5 keV energy range (the optimal range from the timing analysis), which resulted in about 122,000 source counts (out of 356,000 total counts). Above 1.5 keV, the background count rate in each spectral bin dominates the source spectrum count rate by over two orders of magnitude. Below 0.3 keV, the characterization of the noise peak (due to optical loading) remains uncertain, even at Sun angles . We add 2% systematic in each spectral bin to account for uncertainties in the calibration as estimated from observed residuals in fits to the NICER Crab spectrum. Finally, we used the NICER response files version 0.06, but the ancillary response file was re-scaled by a factor 49/52, to account for the three detectors excluded.
To model the Galactic absorption, we used the tbabs model, with the VERN cross-sections (Verner et al., 1996) and WILM abundances (Wilms et al., 2000). The spectral continuum is modeled with either a power law (model powerlaw) or a black body (model bbodyrad), or a combination of these, as described below. We also tried a non-magnetic neutron star atmosphere model nsatmos, as often employed to describe the spectra of MSPs (e.g., for PSR J0437–4715, Bogdanov, 2013; Guillot et al., 2016), since they are expected to have magnetic fields of the order of – G. Finally, we add a Gaussian line at keV (all parameters are fitted) to account for a foreground feature, unrelated to the source, and thought to be O VII emission caused by Solar wind charge exchange or originating in the local hot bubble (e.g., Gupta et al., 2009; Galeazzi et al., 2014).
First, using a simple absorbed powerlaw, with or without a Gaussian results in unacceptable fits (3 and 17, respectively). Moreover, the best-fit photon index, is reminiscent of blackbody-like components. Adding the Gaussian feature to a single bbodyrad model improves the goodness-of-fit statistics from to . However, the fit quality remains poor, and the structures observed in the residuals warrant the addition of a second spectral component.
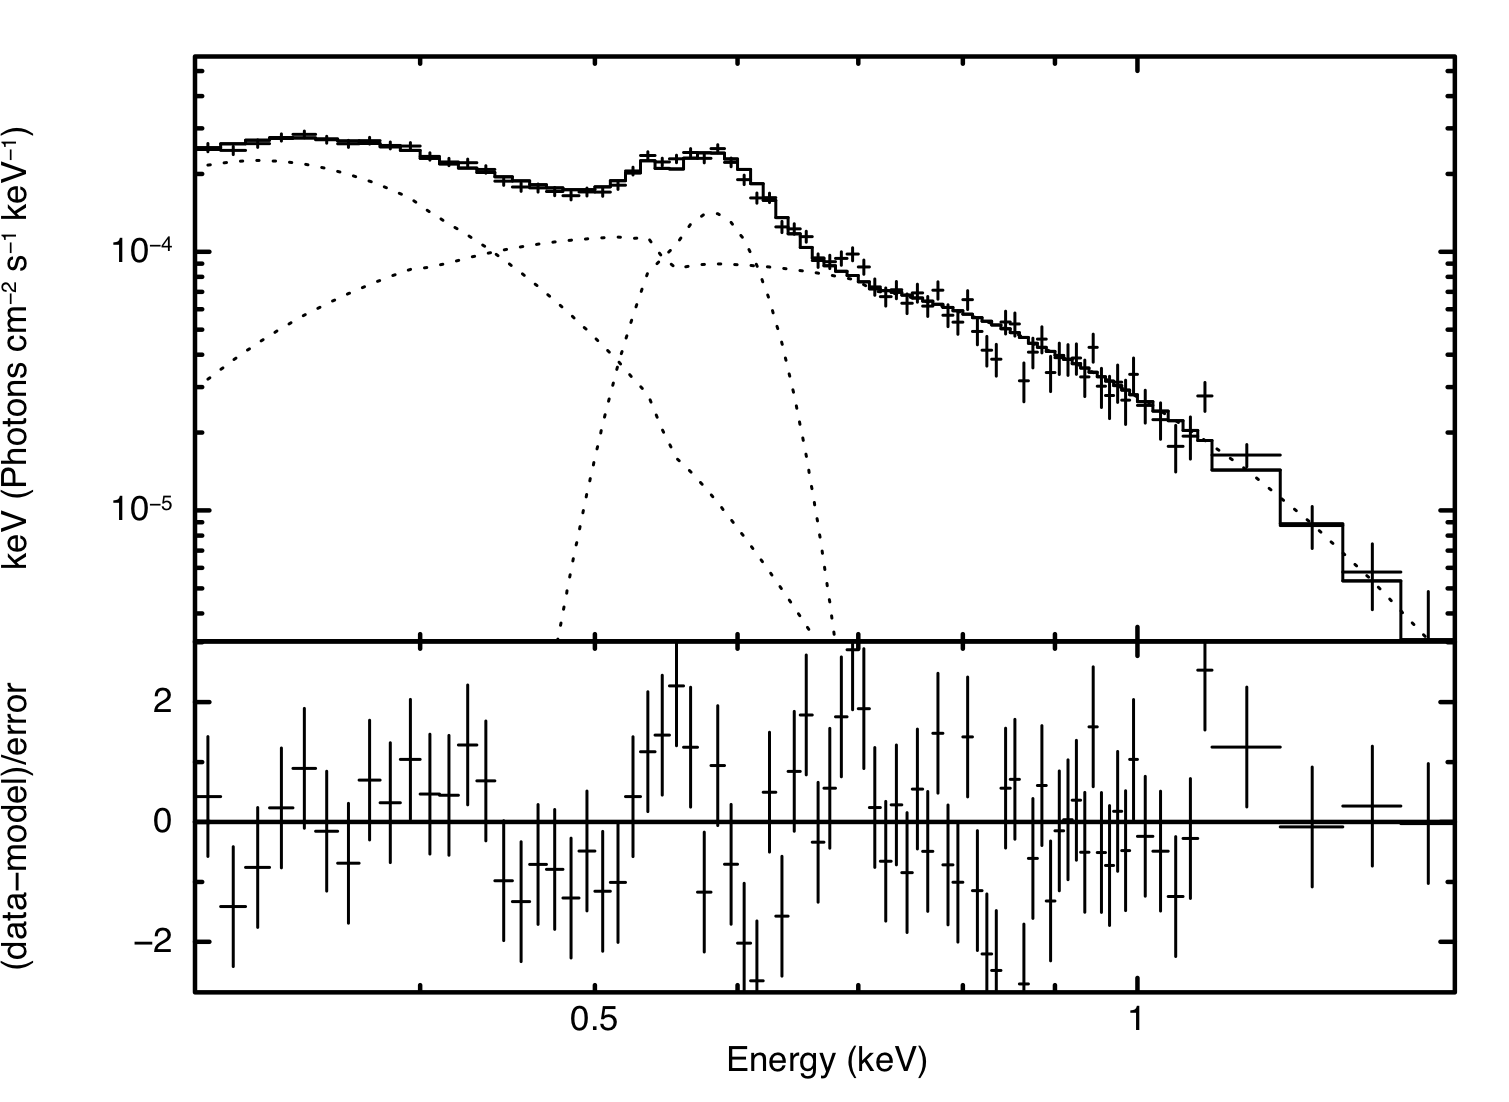
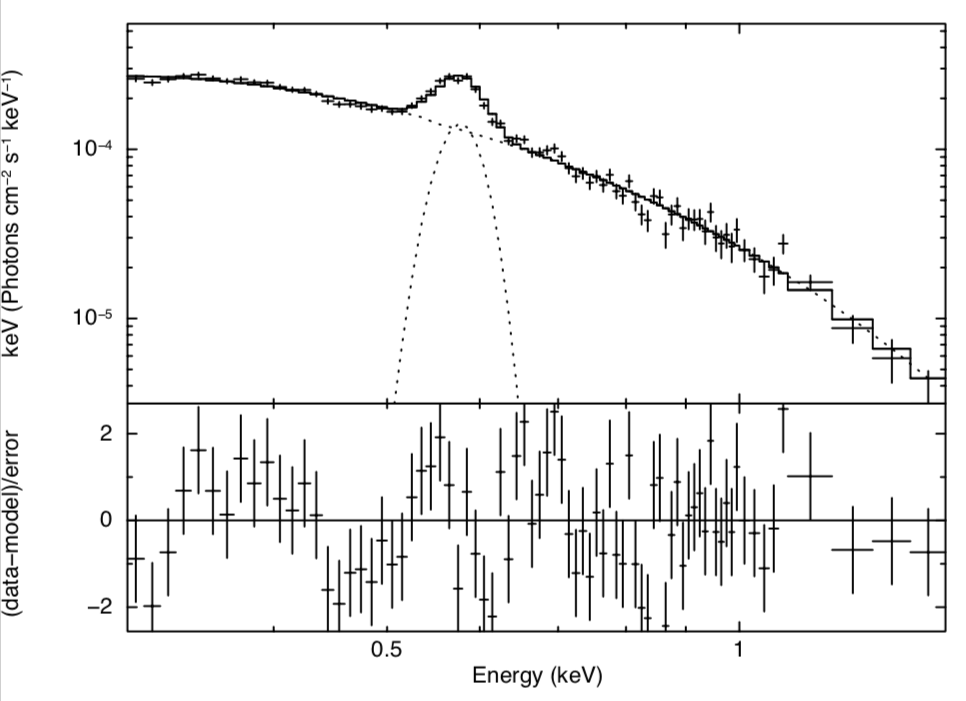
In Table 2, we therefore report the spectral fits of PSR J12311411 with a double-blackbody model (see Figure 6) and with a bbodyrad+powerlaw model (together with the Gaussian as in the model above). In the latter, the photon index of the power law is also extremely soft (), which favors the double-blackbody model. In these two models, the normalizations are poorly constrained, especially for the cold bbodyrad component. Finally, we also report the fit with the nsatmos (fixing , km and pc), which does not require the addition of a second continuum component (see Figure 7). Note that any uncertainties in the distance would be directly incorporated into the uncertainties of the normalization. The fit is insensitive to freeing the radius and mass. Finally, because of the dominating background above 1.5 keV, we cannot determine the presence of a hard X-ray tail, as observed for other MSPs (e.g., PSR J0437–4715, Zavlin et al. 2002; Guillot et al. 2016).
5 Summary and discussions
The detection of thermal pulsations from PSR J12311411 was an important pre-launch goal for NICER, which has now been realized. This has spurred a large investment of observing time that will continue to build up a high signal-to-noise energy-resolved pulse profile to enable lightcurve modeling to constrain the mass and radius of the neutron star in this system (Bogdanov, 2016). We found a predominantly thermal spectrum for PSR J12311411, and an X-ray luminosity, (assuming pc), , typical of thermally emitting MSPs (Forestell et al., 2014; Lee et al., 2018), and consistent with the X-ray luminosity reported previously (Ransom et al., 2011).
5.1 Emission Geometry
The -ray and radio pulse profiles of this pulsar have been studied previously, providing information about the geometry of the emitting regions (Johnson et al., 2014). In these models, the radio emission is assumed to be from a hollow cone centered on the magnetic polar cap, while multiple models for the location of the -ray emitting region are tested: outer gap (OG), two-pole caustic (TPC), and pair-starved polar cap (PSPC). The model light curves are computed over two parameters, (the angle between the spin axis and the magnetic axis), and (the angle between the spin axis and the line of sight). Since the -ray model light curve phases are relative to the (unknown) magnetic pole phase and the Fermi light curve phase is determined relative to that of the radio peak, an additional free parameter for the phase offset between the magnetic pole and the radio peak phase is derived from the fits of the models to the data. The derived phase offsets, , for most of the pulsars are positive, indicating that the radio emission comes from an altitude above the neutron star surface. Johnson et al. (2014) provide the best-fit location of the magnetic pole, without uncertainty, as , and in the case of PSR J12311411 they used the radio profile from Abdo et al. (2013) which put the radio peak at phase 0 allowing us to equate and for this pulsar.
In the case of PSR J12311411, the NICER X-ray light curve (see Figures 4 and 5) can be used to measure , assuming that the X-rays come from a region on the surface centered on the magnetic pole. The peak of the fundamental harmonic in Figure 4 is at a phase of . This can provide constraints on both the radio emission height and on the -ray models.
Radio pulses occurring at a radius will arrive at an observer at a phase ahead of that of the magnetic pole due to aberration and retardation (Dyks et al., 2004), each of which produce a phase shift where . However, this is balanced by the backward shift of the polar cap caused by the rotational sweep back of field lines near the light cylinder of (Dyks & Harding, 2004). The total phase shift is . Equating this with the measured phase shift between the main X-ray and radio peaks indicates that the radio emission radius is km, essentially at the neutron star surface.
The measured phase shift can also constrain the -ray model if it is associated with the from the fits. From the fits of Johnson et al. (2014) for PSR J12311411, the OG model gives , and , while the TPC model gives , and . The PSPC model provides a poor fit to PSR J12311411 given that its very sharp gamma-ray peaks that lag the main radio peak are in conflict with the predictions of that model, so we don’t consider it further. In Johnson et al. (2014), the OG model for the combined -ray-radio fit also has a slightly higher likelihood than the TPC model because of the better match to the -ray peaks. The from the X-ray is consistent with this preference.
Bezuidenhout et al. (2018) have also performed fits of the same models to the -ray light curve alone, obtaining , and for the OG model and , and for the TPC model. So again, the NICER-measured phase is more consistent with the OG model.
However, in both Johnson et al. (2014) and Bezuidenhout et al. (2018), the OG fits have the pulsar being a nearly orthogonal rotator ( near 90∘). This geometry could have difficulty matching the radio profile because it tends to predict a radio interpulse, which is not observed. If , where is the angular size of the radio emission cone, then the observer will miss the second radio peak and see only one radio pulse. With the constraint on the radio emission height above, the angular size of the radio emission cone of PSR J12311411 at is . This estimate indicates that the OG fits of both Johnson et al. (2014) and Bezuidenhout et al. (2018) will predict only one visible radio pulse, consistent with what is observed. The two differ in that Bezuidenhout et al. (2018) fits only the -ray light curve.
For a nearly orthogonal rotator, if the polar caps are nearly antipodal (as expected from a dipole geometry) and of similar size and temperature, there should be X-ray peaks of similar magnitude separated by about 180∘, which also is not observed. The X-ray profile appears to show emission from both polar caps, but indicates a moderate and large to reproduce the large amplitude ratio between the peaks. Of course, the geometry could be more complicated than antipodal hot spots with similar properties. The detailed pulse profile modeling that is ongoing as part of the effort to constrain the neutron star radii of thermally-emitting MSPs will provide insight into the hot spot geometry (Bogdanov, 2016).
So, while the phase offset between the radio and X-ray peaks supports the OG models for the -ray emission, the X-ray pulse profile shape (primarily the large asymmetry of the peaks) tends to support a smaller inclination angle. Additional modeling of the -ray and radio light curves using the X-ray determined phase shift, as a prior, may resolve this discrepancy.
5.2 Spectral analysis
Although the spectral analysis is somewhat limited by the faintness of PSR J12311411 (only of observed counts), its spectrum has a predominantly thermal origin. When using a blackbody, a second component (blackbody or very steep power law) is required. However, when using a neutron star atmosphere model (nsatmos), which has a somewhat harder tail than a Planck function, no additional continuum component is required to obtain an equally good fit compared to the two-component models (see Table 2).
A neutron star atmosphere is most likely to best describe the thermal emission from the polar caps of a MSP such as PSR J12311411. However, in that interpretation, the polar cap of this pulsar would have a temperature ( eV) lower than typically observed for other MSPs ( up to 150 eV, see Bogdanov & Grindlay 2009; Bogdanov 2013). In addition, polar caps covering of the total surface would be larger than expected for a neutron star with a 3-ms spin period (for which the polar cap radius would be 2–3 km, Arons 1981; Dermer & Sturner 1994). Attempts to fit the data with a double-nsatmos model resulted in an unstable fit as our data set does not require the addition of a component to the single nsatmos model.
On the other hand, the double-blackbody model could in principle be an adequate description of the data, where each component represents the emission from the two polar caps, a hot polar cap with a colder annulus around it, or a hot polar cap and the remainder of the colder surface. The latter is supported by the effective areas of these two components: km for the 44 eV blackbody and m for the 133 eV blackbody (see Table 2), but we keep in mind that the normalizations of these two components are poorly constrained. For PSR J0437–4715, the brightest and nearest MSP ( closer than PSR J12311411), the cold emission from the entire surface of that MSP has a temperature of 30–35 eV (e.g., Bogdanov 2013; Guillot et al. 2016). A more precise determination of the temperatures of the polar caps will likely arise from the full pulse profile modeling analysis, and will be presented in an upcoming publication.
Using nsatmos, we find a redshifted temperature of eV (assuming a 1.4-, 11-km neutron star), which is inconsistent with the value obtained from XMM data ( eV, Ransom et al. 2011). This might be caused by the fact that an additional power-law component is required by the XMM data. Our NICER spectrum, however, has a dominating background above 1.5 keV which prevents significant constraints on this component. The overall flux reported previously is consistent with the one listed in Table 2.
References
- Abdo et al. (2013) Abdo, A. A., Ajello, M., Allafort, A., et al. 2013, ApJS, 208, 17, doi: 10.1088/0067-0049/208/2/17
- Alpar et al. (1982) Alpar, M. A., Cheng, A. F., Ruderman, M. A., & Shaham, J. 1982, Nature, 300, 728, doi: 10.1038/300728a0
- Arons (1981) Arons, J. 1981, ApJ, 248, 1099, doi: 10.1086/159239
- Astropy Collaboration et al. (2013) Astropy Collaboration, Robitaille, T. P., Tollerud, E. J., et al. 2013, A&A, 558, A33, doi: 10.1051/0004-6361/201322068
- Atwood et al. (2013) Atwood, W. B., Albert, A., Baldini, L., et al. 2013, in Proc. of the 4th International Fermi Symposium, eConf C121028, (arXiv:1303.3514)
- Bezuidenhout et al. (2018) Bezuidenhout, M. C., Venter, C., Seyffert, A. S., & Harding, A. K. 2018, arXiv e-prints. https://arxiv.org/abs/1808.09762
- Bogdanov (2013) Bogdanov, S. 2013, ApJ, 762, 96, doi: 10.1088/0004-637X/762/2/96
- Bogdanov (2016) —. 2016, European Physical Journal A, 52, 37, doi: 10.1140/epja/i2016-16037-x
- Bogdanov & Grindlay (2009) Bogdanov, S., & Grindlay, J. E. 2009, ApJ, 703, 1557, doi: 10.1088/0004-637X/703/2/1557
- Bogdanov et al. (2006) Bogdanov, S., Grindlay, J. E., Heinke, C. O., et al. 2006, ApJ, 646, 1104, doi: 10.1086/505133
- Bogdanov et al. (2007) Bogdanov, S., Rybicki, G. B., & Grindlay, J. E. 2007, ApJ, 670, 668, doi: 10.1086/520793
- Bruel (2019) Bruel, P. 2019, A&A, 622, A108, doi: 10.1051/0004-6361/201834555
- de Jager et al. (1989) de Jager, O. C., Raubenheimer, B. C., & Swanepoel, J. W. H. 1989, A&A, 221, 180
- Dermer & Sturner (1994) Dermer, C. D., & Sturner, S. J. 1994, ApJ, 420, L75, doi: 10.1086/187166
- Dyks & Harding (2004) Dyks, J., & Harding, A. K. 2004, ApJ, 614, 869, doi: 10.1086/423707
- Dyks et al. (2004) Dyks, J., Rudak, B., & Harding, A. K. 2004, ApJ, 607, 939, doi: 10.1086/383587
- Foreman-Mackey et al. (2013) Foreman-Mackey, D., Hogg, D. W., Lang, D., & Goodman, J. 2013, PASP, 125, 306, doi: 10.1086/670067
- Forestell et al. (2014) Forestell, L. M., Heinke, C. O., Cohn, H. N., et al. 2014, MNRAS, 441, 757, doi: 10.1093/mnras/stu559
- Galeazzi et al. (2014) Galeazzi, M., Chiao, M., Collier, M. R., et al. 2014, Nature, 512, 171, doi: 10.1038/nature13525
- Gendreau & Arzoumanian (2017) Gendreau, K., & Arzoumanian, Z. 2017, Nature Astronomy, 1, 895, doi: 10.1038/s41550-017-0301-3
- Gendreau et al. (2016) Gendreau, K. C., Arzoumanian, Z., Adkins, P. W., et al. 2016, in Proc. SPIE, Vol. 9905, Space Telescopes and Instrumentation 2016: Ultraviolet to Gamma Ray, 99051H
- Guillot et al. (2016) Guillot, S., Kaspi, V. M., Archibald, R. F., et al. 2016, MNRAS, 463, 2612, doi: 10.1093/mnras/stw2194
- Gupta et al. (2009) Gupta, A., Galeazzi, M., Koutroumpa, D., Smith, R., & Lallement, R. 2009, ApJ, 707, 644, doi: 10.1088/0004-637X/707/1/644
- Harding & Muslimov (2001) Harding, A. K., & Muslimov, A. G. 2001, ApJ, 556, 987, doi: 10.1086/321589
- Harding & Muslimov (2002) —. 2002, ApJ, 568, 862, doi: 10.1086/338985
- Jahoda et al. (2006) Jahoda, K., Markwardt, C. B., Radeva, Y., et al. 2006, ApJS, 163, 401, doi: 10.1086/500659
- Johnson et al. (2014) Johnson, T. J., Venter, C., Harding, A. K., et al. 2014, The Astrophysical Journal Supplement Series, 213, 6, doi: 10.1088/0067-0049/213/1/6
- LaMarr et al. (2016) LaMarr, B., Prigozhin, G., Remillard, R., et al. 2016, in Proc. SPIE, Vol. 9905, Space Telescopes and Instrumentation 2016: Ultraviolet to Gamma Ray, 99054W
- Lange et al. (2001) Lange, C., Camilo, F., Wex, N., et al. 2001, MNRAS, 326, 274, doi: 10.1046/j.1365-8711.2001.04606.x
- Lee et al. (2018) Lee, J., Hui, C. Y., Takata, J., et al. 2018, ApJ, 864, 23, doi: 10.3847/1538-4357/aad284
- Luo et al. (2019) Luo, J., et al. 2019, ApJ
- Mitchell et al. (2018) Mitchell, J. W., Winternitz, L. B., Hassouneh, M. A., et al. 2018, in Proc. 41st Annual AAS Guidance & Control Conference, AAS 18–155
- Pletsch & Clark (2015) Pletsch, H. J., & Clark, C. J. 2015, ApJ, 807, 18, doi: 10.1088/0004-637X/807/1/18
- Prigozhin et al. (2016) Prigozhin, G., Gendreau, K., Doty, J. P., et al. 2016, in Proc. SPIE, Vol. 9905, Space Telescopes and Instrumentation 2016: Ultraviolet to Gamma Ray, 99051I
- Ransom et al. (2011) Ransom, S. M., Ray, P. S., Camilo, F., et al. 2011, ApJ, 727, L16, doi: 10.1088/2041-8205/727/1/L16
- Ray et al. (2017) Ray, P. S., Arzoumanian, Z., & Gendreau, K. C. 2017, in Proceedings of IAU Symposium 337: Pulsar Astrophysics - The Next 50 Years
- Ray et al. (2012) Ray, P. S., Abdo, A. A., Parent, D., et al. 2012, in Third Fermi Symposium, eConf C110509 (arXiv:1205.3089)
- Romani (1987) Romani, R. W. 1987, ApJ, 313, 718, doi: 10.1086/165010
- Shklovskii (1970) Shklovskii, I. S. 1970, Soviet Ast., 13, 562
- Tauris & van den Heuvel (2006) Tauris, T. M., & van den Heuvel, E. P. J. 2006, Formation and evolution of compact stellar X-ray sources (Cambridge University Press), 623–665
- Verner et al. (1996) Verner, D. A., Ferland, G. J., Korista, K. T., & Yakovlev, D. G. 1996, ApJ, 465, 487, doi: 10.1086/177435
- Watts et al. (2016) Watts, A. L., Andersson, N., Chakrabarty, D., et al. 2016, Reviews of Modern Physics, 88, 021001, doi: 10.1103/RevModPhys.88.021001
- Wilms et al. (2000) Wilms, J., Allen, A., & McCray, R. 2000, ApJ, 542, 914, doi: 10.1086/317016
- Yao et al. (2017) Yao, J. M., Manchester, R. N., & Wang, N. 2017, ApJ, 835, 29, doi: 10.3847/1538-4357/835/1/29
- Zavlin (2006) Zavlin, V. E. 2006, ApJ, 638, 951, doi: 10.1086/449308
- Zavlin et al. (2002) Zavlin, V. E., Pavlov, G. G., Sanwal, D., et al. 2002, ApJ, 569, 894, doi: 10.1086/339351
- Zavlin et al. (1996) Zavlin, V. E., Pavlov, G. G., & Shibanov, Y. A. 1996, A&A, 315, 141