The molecular gas content of shell galaxies ††thanks: Based on observations carried out with the 30m telescope of IRAM (Institute of RAdioastronomy in Millimeter).
Shells are fine stellar structures identified by their arc-like shapes present around a galaxy and currently thought to be vestiges of galaxy interactions and/or mergers. The study of their number, geometry, stellar populations and gas content can help to derive the interaction/merger history of a galaxy. Numerical simulations have proposed a mechanism of shell formation through phase wrapping during a radial minor merger. Alternatively, there could be merely a space wrapping, when particles have not made any radial oscillation yet, but are bound by their radial expansion, or produce an edge-brightened feature. These can be distinguished, because they are expected to keep a high radial velocity. While shells are first a stellar phenomenon, HI and CO observations have revealed neutral gas associated with shells. Some of the gas, the most diffuse and dissipative, is expected to be driven quickly to the center if it is travelling on nearly radial orbits. Molecular gas, distributed in dense clumps, is less dissipative, and may be associated to shells. It can then determine the shell velocity, too difficult to obtain from stars. We present here a search for molecular gas in nine shell galaxies with the IRAM-30m telescope. Six of them are detected in their galaxy center, and in three galaxies, we clearly detect molecular gas in shells. The derived amount of molecular gas varies from 1.5 108 to 3.4 109 M⊙ in the shells. For two of them (Arp 10 and NGC 3656), the shells are characteristic of an oblate system. Their velocity is nearly systemic, and we conclude that these shells are phase-wrapped. For the third one (NGC 3934) the shells appear to participate in the rotation. Follow up with higher spatial resolution is required to conclude.
Key Words.:
Galaxies: interactions — Galaxies: ISM — Galaxies: kinematics and dynamics — Galaxies: peculiar — Galaxies: structure1 Introduction
It is well accepted that galaxy interactions frequently lead to merging, and must have played a fundamental role in the formation and evolution of galaxies (Toomre & Toomre, 1972). Most of our understanding of galaxy interactions has been obtained through numerical simulations (see for a review Barnes & Hernquist, 1992). Among the best vestiges of galaxy interactions are shells and ripples (Schweizer & Seitzer, 1992), which are often present around merger remnants. Shells, which are composed by stars, were originally observed around elliptical and S0 galaxies which are poor-gas systems (Carter et al., 1982). A convincing theory has been developed to account for the formation of shells around early-type galaxies as a phase-wrapping phenomenon (Quinn, 1984; Dupraz & Combes, 1986, 1987; Hernquist & Quinn, 1989). According to the theory, the stars modeled as collisionless particles, which were originally bound to the merging companions, are liberated and oscillate with different periods of oscillation, around the primary galaxy. They accumulate near the apocenters of their orbits, to form shell-like features. This phenomenon is also predicted to occur in the last phase of any merging between two spiral galaxies. The end-product appears to be an elliptical, with a de Vaucouleurs law as light profile (e.g. Schweizer, 1990). The late infall of tidal tails and debris, predominantly consisting of stars, initiates the phase-wrapping and subsequent shell formation. Most spiral merger remnants, such as the prototypical NGC 7252, appear to indeed possess shells (Schweizer, 1990).
The morphology of shells may help to reveal the 3D-structure of the galaxy potential: if the galaxy is prolate, shells align along the major axis, and are interleaved in radius, while shells wind up randomly in azimuth near the equatorial plane of an oblate galaxy (Dupraz & Combes, 1986). All these are phase-wrapped shells, where stars are accumulating at the apocenter of their oscillations. However, as Hernquist & Quinn (1988) have pointed out, there could also be some features like tails or streams, edge-brightened or only space-bounded, which do not fall under phase wrapping, but only under space-wrapping.
This space-wrapping scenario was invoked when neutral hydrogen was observed in systems containing shells. Schiminovich et al. (1994) and Schiminovich et al. (1995) have detected diffuse HI gas associated with the stellar shells (Centaurus A and NGC 2865). These observations were a priori surprising, in the phase-wrapped scenario, since we believe that the diffuse gaseous and stellar components do not have the same behavior when approaching to the center of the potential well in quasi-radial orbits (Weil & Hernquist, 1993). The gas was expected to infall to the center, without being able to oscillate back. However, part of the gas could be structured in clouds and less dissipative, and also the orbits might be less radial. Simulating a minor merger with clumpy gas, Combes & Charmandaris (2000) have shown that indeed, a large fraction of the gas could follow the stars in phase-wrapped shells. Since the gas in the outer parts of the merging companion is less bound than the stars, it is liberated first, and less slowed down by dynamical friction: gaseous shells have a slightly larger radius than the stellar ones. In Centaurus A, the HI is associated with the outermost faint stellar shells. It is displaced to the outside of the optical shells, and has a high rotation velocity, suggesting that only a companion with a more circular orbit is able to produce this HI ring (Schiminovich et al., 1994). Other cases of HI shells displaced with respect to the stellar shells have been reported (Schiminovich et al., 1997; van Gorkom, 2000).
Detecting gas in shells is useful to be able to determine their velocity. Indeed, getting stellar velocity is costly and requires the use of spectrographs with IFU capabilities on large telescopes. The HI maps suffer from low spatial resolution, so molecular gas might be one of the best ways to determine shell kinematics. The latter is important to try discriminating between the different scenarios: in the phase-wrapping model, stars have zero radial velocity in the shells, which correspond to their apocenter. Velocities might be much higher in the space-wrapping model. In order to get more insight into the process of gaseous shell formation, and into the behavior of gas in shell galaxies in general, we performed observations of CO(1-0) and CO(2-1) emission lines in the shell regions of eight early-type galaxies, two of them taken from the CO survey of sample (Young et al., 2011), and five of them have H2 gas detected in their center. In all cases, we re-observed the center positions, to obtain better S/N ratio. We detected CO emission associated with shells in three galaxies and detected molecular gas in six galaxies, where we made small maps. Out of the 9 systems observed only two were not detected at all (NGC 5018 and NGC 7600). NGC 474 also is not detected in its center, but CO is present in its companion. We then examine the expected association between the stellar and gaseous (HI or CO) shells, and discuss the various scenarios, taking into account the predictions from N-body numerical simulations.
The observations are described in Sec. 2, the sample of shell galaxies in Sec. 3, and the results are presented in Sec. 4. Finally, the interpretation and discussion are gathered in Sec. 5, and the conclusions in Sec. 6.
2 Observations and data reduction
Observations of the 12CO(1-0) and 12CO(2-1) emission have been carried out at IRAM 30-m telescope at Pico Veleta, Granada, Spain, during 2017 July (for Arp 230, NGC 474 and NGC 3934), then September, October and 2000 November (for the remaining sources). The beam full width at half-maximum (FWHM) is 23 arcsec and 11 arcsec at the frequencies of 115 GHz and 230 GHz, respectively. The SIS receivers (EMIR) were used for observations in the wobbler switching mode, with reference positions offset by 120 arcsec in azimuth. The main-beam efficiency of IRAM is = 0.82 and 0.64 at 115 GHz and 230 GHz respectively. The system temperatures ranged between 190 K and 420 K at 2.6 mm and between 240 K and 600 K at 1.3 mm. The pointing was regularly checked every 2 h on a nearby planet or a bright continuum source, and the focus was reviewed after each sunrise or if a suitable planet was available, as well as at the beginning of each night. The time on source typically ranged from 30 min to 1h, being weather-dependent. Two backends were used simultaneously, the autocorrelator WILMA, and the Fourier Transform Spectrometer FTS. The rms noise level was 1.5mK [] with a spectrometer resolution of 40 for 114 GHz and 3.0mK [] with a spectrometer resolution of 20 for 230 GHz. The various pointings observed on the shell galaxies are indicated in Fig. 1 to 8.
| Name | RA | DEC | cz | D | M(HI) | L(IR) | M(H2) | Ref | Type |
|---|---|---|---|---|---|---|---|---|---|
| J2000 | J2000 | km s-1 | Mpc | logM⊙ | logL⊙ | logM⊙ | NED | ||
| Arp 230 | 00:46:24.2 | -13:26:32 | 1720 | 24.2 | 9.20 | 9.49 | 8.95 | (1) | S0pec |
| NGC 474 | 01:20:06.7 | +03:24:55 | 2315 | 32.2 | 9.63 | 8.03 | 7.7 | (2) | SA0 |
| Arp 10 | 02:18:26.3 | +05:39:14 | 9108 | 120. | 10.2 | 10.5 | - | (3) | S? |
| NGC 3032 | 09:52:08.1 | +29:14:10 | 1562 | 21.2 | 8.15 | 9.34 | 8.42 | (4) | SAB0 |
| NGC 3656 | 11:23:38.6 | +53:50:32 | 2870 | 42.6 | 9.27 | 9.99 | 9.67 | (5) | I0pec |
| NGC 3934 | 11:52:12.5 | +16:51:05 | 3779 | 49.2 | 9.51 | 9.98 | 9.32 | (6) | S? |
| NGC 5018 | 13:13:01.0 | -19:31:05 | 2816 | 37.5 | 8.81 | 9.54 | 7.4 | (7) | E3 |
| NGC 7600 | 23:18:53.8 | -07:34:50 | 3483 | 39.0 | 7.5 | – | - | (8) | S0 |
| Arp 295N | 23:42:00.8 | -03:36:55 | 6966 | 93.0 | 10.2 | 10.9 | 10.2 | (9) | Sbpec |
-
– References (1) Schiminovich et al. (2013) for HI, Ueda et al. (2014) for CO – (2) Rampazzo et al. (2006) for HI, Combes et al. (2007) for CO – (3) Charmandaris & Appleton (1996) for HI – (4) Lucero & Young (2013) for HI, Combes et al. (2007) for CO – (5) Balcells et al. (2001) for HI, Young (2002) for CO – (6) Galletta et al. (1997) for HI and CO – (7) Kim et al. (1988) for HI, Ueda et al. (2014) for CO – (8) Serra et al. (2008) for HI – (9) Hibbard & van Gorkom (1996) for HI and CO –
-
– All H2 data are centered and are representative of the total molecular content. L(IR) data are from NED.
3 The sample
We have selected shell galaxies observable from the northern hemisphere, which were previously observed in HI-21cm and in CO in the millimeter domain (see Table 1). In general they are quite rich in neutral gas, except NGC 7600. The properties of the 9 shell galaxies selected in our sample are gathered in Table 1. The H2 masses in this Table are those which were known before the present study, and all luminosities and masses have been scaled to the adopted distances. References in this Table are for HI and H2. We give below the detailed properties of each system.
Arp 230
Arp (1966) was the first to classify the galaxy as peculiar, because of its faint stellar arcs, not yet called shells. Arp 230 (IC51) is now considered to be one of the prototypes for shell galaxies formed around a prolate object, with shells phase wrapped from the radial infall of a small satellite (Quinn, 1984). The geometry of the shells is characteristic (see Fig. 1), they are aligned with the major axis, and interleaved in their distance to the center (Dupraz & Combes, 1986). At least eight shells can be counted, with the most distant at 11 kpc, which is rather rare, although not as complex as NGC 3923 (Prieur, 1988). As frequent in shell systems, the first shell of Arp 230 (i.e. the most distant) is connected to the primary galaxy by a faint distorted tail or plume.
An HI mass of 1.59 109 M⊙ has been detected in this merged system, with the Green Bank 140foot (Richter et al., 1994). With the VLA, Schiminovich et al. (2013) mapped the HI in Arp 230, with 0.8 kpc resolution. The HI is not aligned with the stellar shells, but perpendicular to the major axis, like a polar ring, aligned with the dust lane. The total HI mass detected with the VLA is 1.1 109 M⊙. McGaugh & Bothun (1990) together with Prieur (1988) found that the color of the shells are bluer than the main body of the Arp 230 galaxy, suggesting that the merger provided gas and star formation to the shells.
Galletta et al. (1997) have detected CO(1-0) in the center with the Kitt Peak 12m telescope (beam of 1 arcmin), and derived M(H2) = 8.9 108 M⊙. The central dust lane corresponds to a molecular disk in rotation in the center, mapped in CO(1-0) with ALMA at 0.5 kpc resolution (Ueda et al., 2014). The corresponding H2 mass is 1.7 108 M⊙.
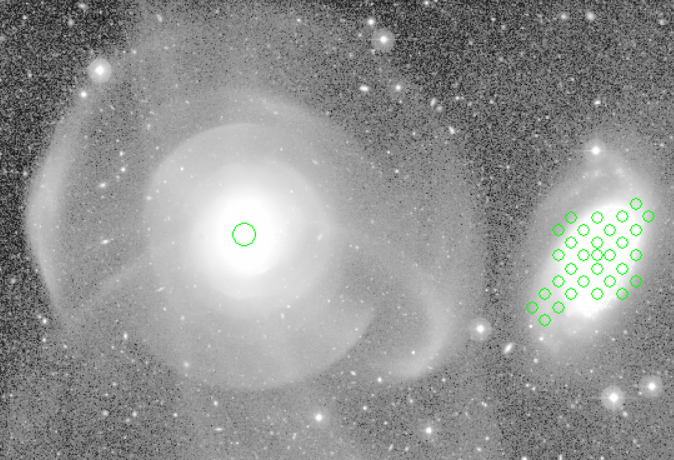
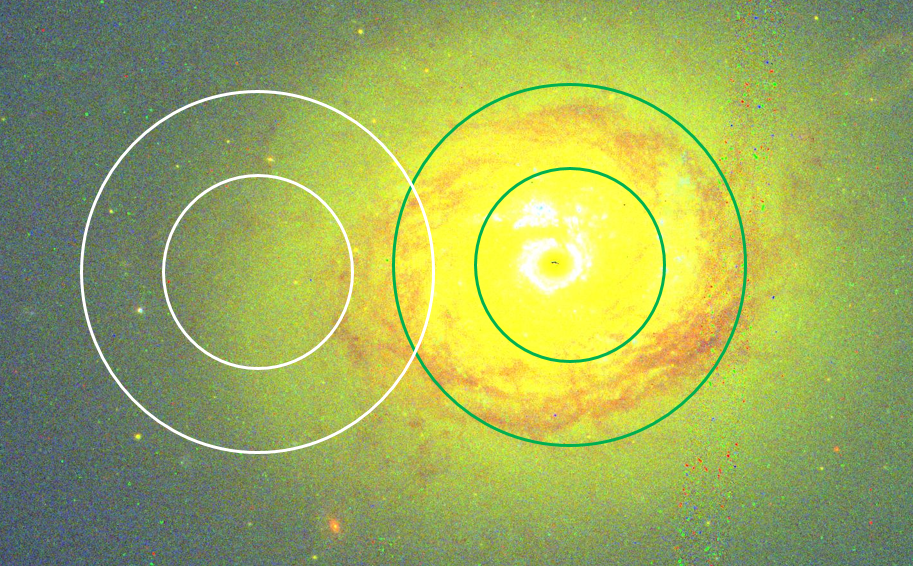
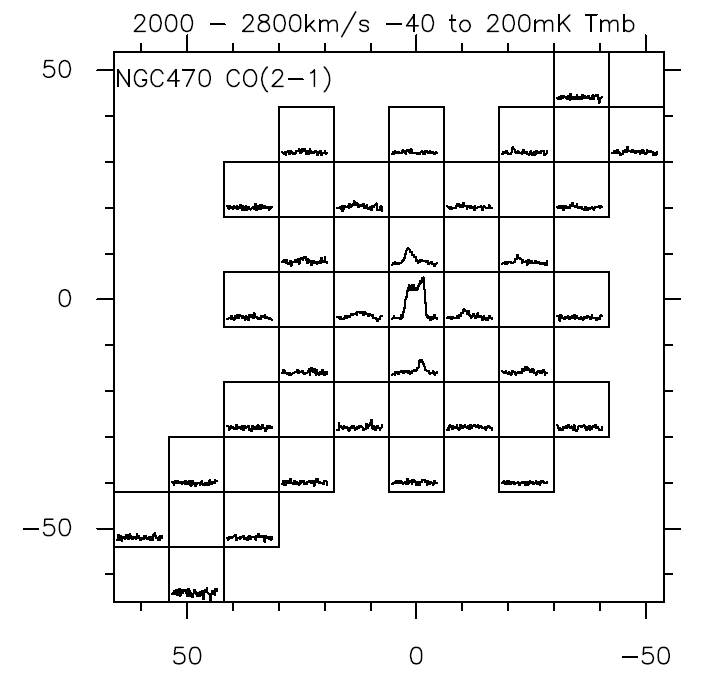
NGC 474/470 (Arp 227)
The group has been observed in the optical by Rampazzo et al. (2006, 2007), and with high sensitivity by Duc et al. (2015). In the latter CFH-Megacam image, NGC 474 appears as a spectacular shell system, where shells are distributed randomly at all azimuth (see Figure 2). This geometry corresponds to stellar shells aligned in the equatorial band of an oblate galaxy (Dupraz & Combes, 1986). Superposed to the shell systems, there is a radial tail/plume, coming from the past merger.
The first HI observations were not separating the two galaxies of the pair (Huchtmeier, 1982). Interferometric observations with VLA have shown that most of the HI reservoir belongs to the spiral NGC 470, but a long tail and bridge covers NGC 474, and therefore the early-type shell galaxy may possess some interstellar gas (Rampazzo et al., 2006), see also Figure 3.
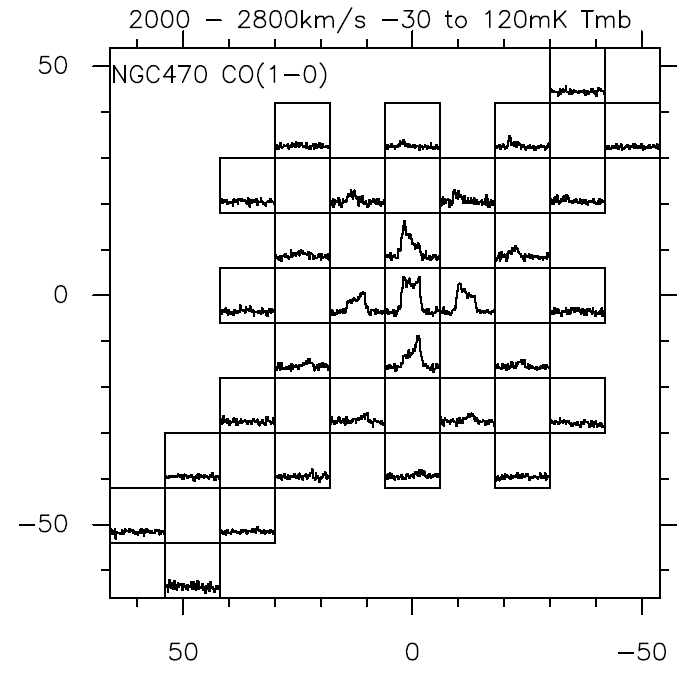
As early as 1993, Sofue et al. (1993) detected CO(1-0) emission towards Arp 227A (NGC 470), the late-type of the pair, and derived an H2 mass of 2.3 108 M⊙. However, towards the shell early-type galaxy NGC 474, Combes et al. (2007) find an upper limit of M(H 3.8 107 M⊙, with the IRAM-30m telescope. In the present work, we obtain a lower upper limit for the CO emission towards the center, and then did not point towards the shells, since the emission there is expected to be even smaller. We observed the companion NGC 470 to know how much available gas mass existed there, that could have fallen towards NGC 474.
Lim et al. (2017) studied the Globular Cluster (GC) population in the NGC 474 galaxy. GC and their color/age are good tracers of the merging history of a system. The violent starbursts triggered by the major mergers of gas-rich spirals favor the formation of metal-rich and red GC (Whitmore et al., 1993; Chien et al., 2007; Renaud et al., 2015), while the dry minor merger of small-mass satellites brings relatively blue GC in the halo of a massive primary. In the outer parts of NGC 474, there is a remarkable spatial correlation between GC and stellar fine-structure (shells, tails, radial streams), while GC are blue, likely to have formed in low-metallicity satellites, and accreted later. In the center of the galaxy, GC have an intermediate color, compatible with their formation in situ, when star formation occurred 7-8 Gyr ago. With passive evolution until 13 Gyr, they will become red as expected in a massive elliptical today (Lim et al., 2017).
Arp 10
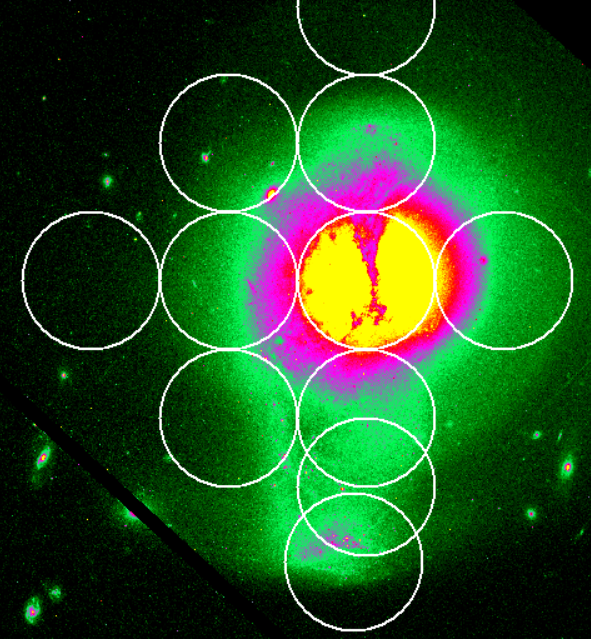
This peculiar galaxy reveals loops, ripples and shells in its outer parts (Charmandaris & Appleton, 1996). The HI VLA map from the latter work shows a neutral gas extension beyond the deepest optical shells. The HI appears in two components: one more relaxed in a rotating disk in the inner parts, although with non-circular motions, and the other component quite similar to a shell system, with no one-to-one correspondence with the optical shells. Bizyaev et al. (2007) show that the inner parts of the optical disk are dominated by a collisional ring, and the intruder responsible for the expanding wave is found 5” at the southwest from the nucleus of Arp10 (see Fig. 4). Its mass could be 1/4th of the Arp10’s mass. Star formation has been triggered in the ring by the collision.
NGC 3032
This early-type galaxy is classified as a weakly barred lenticular. Its optical image is very smooth, with however some dusty inner disk, and a large-scale shell system, embedding the galaxy (see Fig. 5 and Duc et al. (2015)). This galaxy has certainly recently acquired its gas, since the HI map shows counter-rotation with respect to the stars (Oosterloo et al., 2010). While all gas components (ionized, atomic and molecular) corotate, the main stellar body counter-rotate, but there is however some young stars, probably formed since the gas accretion event, co-rotating with the gas in the very center (McDermid et al., 2006).
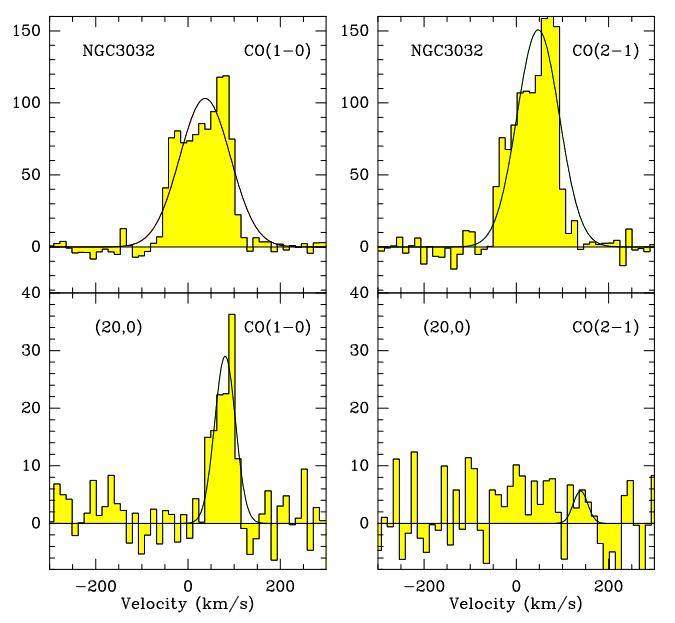
Sage & Wrobel (1989) detected CO(1-0) emission towards the peculiar lenticular NGC 3032 with the Kitt-Peak-12m telescope (60” beam), and derived an H2 mass of 3.6 108 M⊙, computed with the same adopted distance and CO-to-H2 conversion factor than here. The latter is somewhat higher than that found by Combes et al. (2007), of 2.5 108 M⊙, but this could be explained, since the IRAM-30m beam is 23” (2.4kpc) in CO(1-0), and may miss some outer emission. The CARMA interferometer mapped the inner disk, but not covering more than the IRAM-30m beam (Alatalo et al., 2013).
NGC 3656
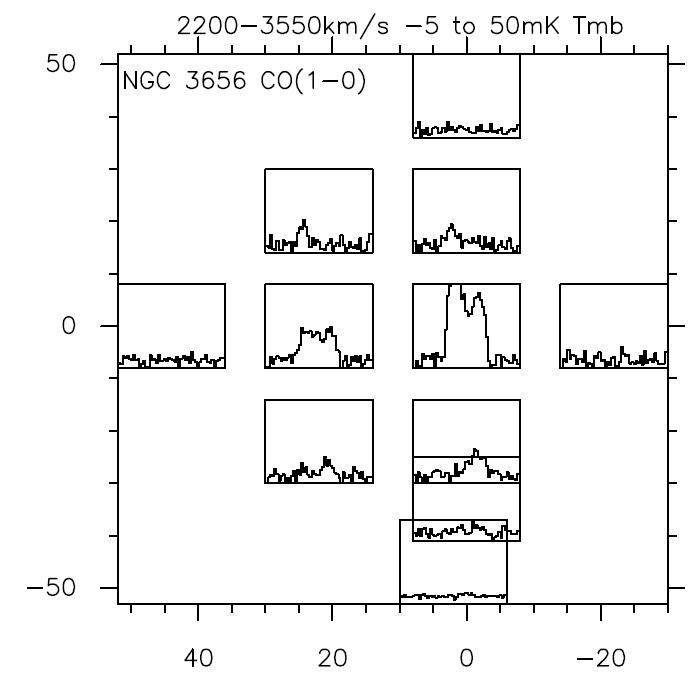
This peculiar galaxy (Arp 155) has been classified as a shell elliptical galaxy, with several shells, and one particularly strong 9 kpc south of the center (Balcells et al., 2001), as can be seen on Fig. 6. Two kinematical components have been identified, with perpendicular axes (Balcells & Stanford, 1990). The inner (1kpc) stellar core rotates with a major axis E-W, and the larger stellar and gaseous disk (radius 7 kpc) rotates with a major axis N-S. The VLA HI map from Balcells et al. (2001) shows two gas components: an edge-on and warped inner disk extending up to 7kpc (M(HI)=2 109 M⊙), aligned north-south along an inner dust lane; and a more extended outer structure, distributed in shells or rings, roughly correlated to the optical shells, but more extended. The HI southern shell at 9 kpc coincides with the stellar shell, and has the systemic velocity.
Wiklind et al. (1995) detected CO emission towards the merger system NGC 3656 and derived an H2 mass of 2.2 109 M⊙. A CO map was done with the BIMA interferometer by Young (2002) and revealed the same N-S alignment as the HI disk. The map was not sensitive enough to detect CO in the southern shell.
NGC 3934
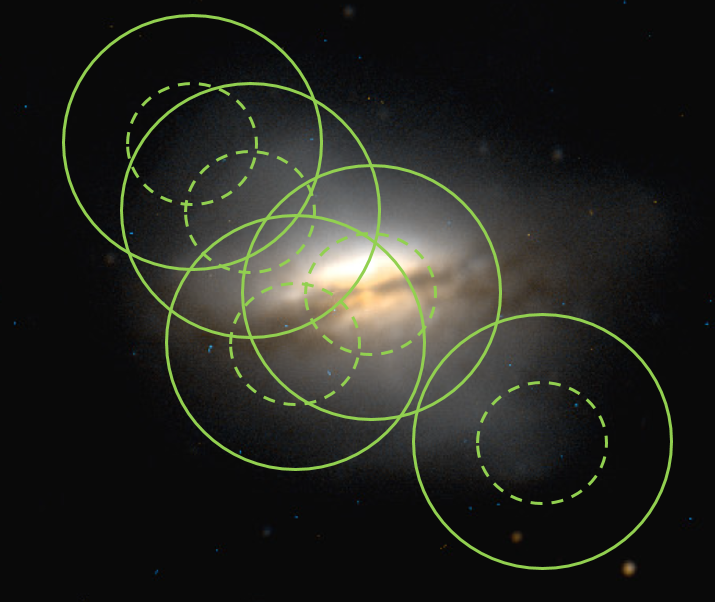
This peculiar disk galaxy is a candidate polar ring (Whitmore et al., 1990), belonging to a compact group, similar to an Hickson group (Bettoni et al., 2011). It has a strong linear dust lane in the center, that irregularly obscures the inner and brighter regions of the galaxy (see Fig. 7). Spurs and shells are visible in the inner parts, but especially in the outskirts of the galaxy. The latter have an average B - R , not as blue as typical spiral arms although they are bluer than the central parts reddened by the dust-lane. The galaxy has then a rich shell system, dispatched all around the center, in apparent random order. This shell morphology can be reproduced in models with oblate galaxies, with shells near the equatorial plane (Dupraz & Combes, 1986). NGC 3934 is rich in gas, it was detected in HI, with a mass of 5 109 M⊙ (van Driel et al., 2000) and in CO (Galletta et al., 1997) with M(H2) = 2.1 109 M⊙. It has a star formation rate of SFR = 1.6 M⊙/yr, derived from its far-infrared IRAS flux. Bettoni et al. (2011) propose a formation in a dissipative merger, through hydrodynamical SPH simulations. From this formation mechanism, molecular gas might be expected in the shells.
NGC 5018
Like NGC 7252, NGC 5018 is one of the prototypes of a recent merger, 3Gyr ago, which is becoming a giant elliptical (gE) (Buson et al., 2004). It is the dominant gE of a small group. It has been detected by IRAS, with an SFR = 0.7 M⊙/yr. The galaxy reveals sharp outer shells (Rampazzo et al., 2007), and a central linear dust lane. Kim et al. (1988) mapped the HI, and found M(HI) = 6.1 108 M⊙. On the contrary, the galaxy is not detected in CO(1-0) with ALMA (Ueda et al., 2014), with M(H2) 2.3 107 M⊙, but is detected in 3mm continuum.
NGC 7600
This is a typical shell galaxy, with a large number of shells, aligned and interleaved along the major axis. The main body is a flattened early-type galaxy, classified as a lenticular. Turnbull et al. (1999) count 16 shells, with the first one at 40 kpc from the center. Cooper et al. (2011) reveal some even deeper external features, and reproduce easily the system of shells from a simulation of phase wrapping during the radial merger of a small companion. There is only an upper limit for HI in this galaxy (Sansom et al., 2000; Serra et al., 2008). It was selected in our sample, however, because of its high degree of fine stellar structures.
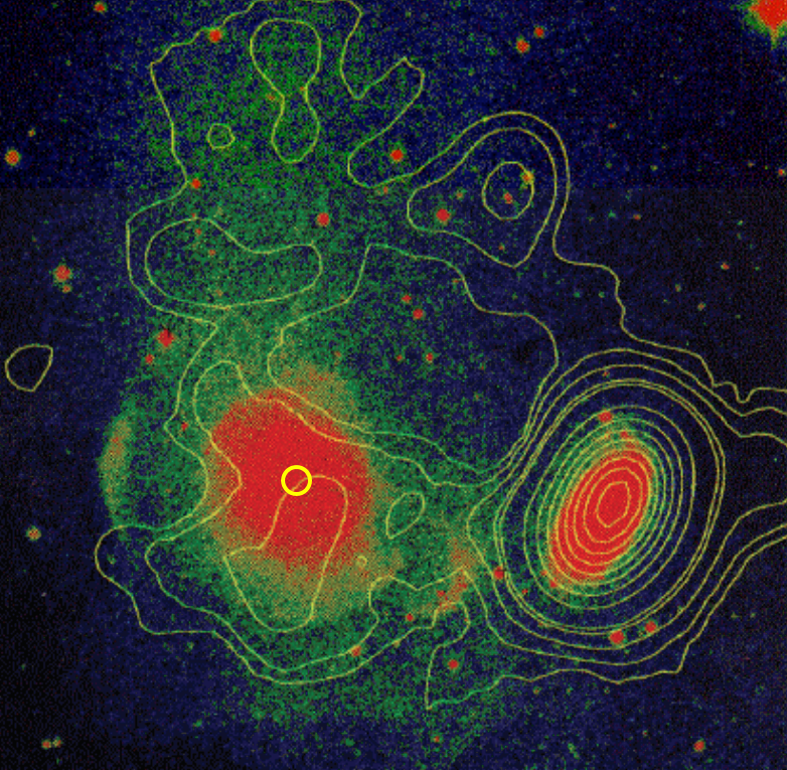
Arp 295N
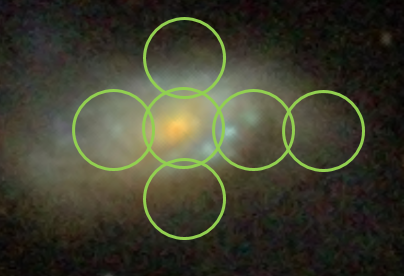
The system Arp 295 is a pair of galaxies in an early stage of merger. The Northern member reveals large plumes, shells and loops of H emission up to 9 kpc north and south of the minor axis (see Fig. 8). The northern galaxy is undergoing a retrograde encounter with its southern companion. The HI was mapped with the VLA by Hibbard & van Gorkom (1996), who found an HI mass of 1.7 1010 M⊙ and an SFR = 17 M⊙/yr. They also report about our IRAM-30m observations of CO emission, which were not published, with a molecular mass of M(H2) = 8.5 109 M⊙. The star formation rate of the ensemble has been estimated to be 21.9 M⊙/yr from Pa by Tateuchi et al. (2015).
4 Results
In each shell galaxy, the center was observed first, to check the presence of molecular gas, and if present, the shell regions were also observed. Indeed, the presence of gas in shells is expected to come from the infall of a gas-rich satellite (Charmandaris et al., 2000; Combes & Charmandaris, 2000). The gas present in the satellite is first liberated and may oscillate in the potential of the primary galaxy, just before the satellite stars form the shells. Some gas is expected to fall in the center through dissipation. The presence of gas in the center is therefore a necessary condition to find gas in shells, but is not sufficient, since the primary galaxy could also have had some gas before the collision. Out of the 9 shell galaxies of our sample, 3 were not detected in their center (NGC 474, NGC 5018 and NGC 7600) and they were not searched for gas in their shells. The upper limits are displayed in Table 2. For the 6 remaining shell galaxies, 3 were mapped extensively, and we show spectra maps in CO(1-0) and CO(2-1) for Arp 10, NGC 3656 and Arp 295N, in Fig. 10, 11, 17, 19, 20, respectively. In Table 2 only the central beam, and the offset beams covering a shell and detected in CO(1-0), are characterized. For the 3 others (Arp 230, NGC 3032 and NGC 3934), only a few spectra are shown, in Fig. 9, 14 and 18. All these points are detailed in Table 2.
4.1 Molecular gas content
To quantify the amount of molecular gas found in each pointing, we rely on the empirically established proportionality between the CO(1-0) luminosity and H2 mass, for a large number of Milky-Way like galaxies (e.g., Bolatto et al., 2013). We convert the integrated intensities in each beam (in Tmb) in integrated fluxes S(CO) dV, with the conversion of 5 Jy per Kelvin, appropriate for the IRAM-30m telescope. From the integrated flux S(CO) dV (Jy km/s) found within each region, the derived molecular mass is obtained through the formula
where =115.271 GHz, and DL is the luminosity distance in Mpc (e.g., Solomon & Vanden Bout, 2005). The molecular mass, including helium, is then derived from
assuming the standard CO-to-H2 conversion factor of XCO = 2 1020 cm-2(K km/s)-1, applicable to Milky Way-like galaxies. Although shell galaxies are interacting, they are mildly perturbed, and certainly not starbursts, or Ultra-Luminous InfraRed Galaxies (ULIRG), where a lower conversion factor might apply.
Molecular masses, corresponding to each CO(1-0) pointing are displayed in Table 2. In most cases, we have not observed the whole galaxy disks, and an estimation of the total molecular masses would need some extrapolation.
| CO(1-0) | CO(2-1) | ||||||||
| Galaxy | Offsets | Int-Flux | V | V | Int-Flux | V | V | M(H2) | (H2) |
| (”,”) | Jy km s-1 | km s-1 | km s-1 | Jy km s-1 | km s-1 | km s-1 | M⊙ | M⊙pc-2 | |
| ARP 230 | (0,0) | 9.20.9 | -546 | 12515 | 14.71 | -425 | 11111 | 0.570.06 | 11 |
| (4.4,17) | 3.70.7 | 517 | 19040 | 3 | – | – | 0.230.04 | 4 | |
| (-14,-21) | 1.6 | – | – | 1.7 | – | – | 0.1 | 2 | |
| NGC 474 | (0,0) | 1.4 | – | – | 3.1 | – | – | 0.15 | 1.6 |
| ARP 10 | (0,0) | 29.71 | 104 | 2087 | 38.82.7 | 258 | 22416 | 44.61.5 | 35 |
| see | 18 pt | map | |||||||
| NGC 3032 | (0,0) | 711.3 | 571 | 1292 | 86.52 | 471 | 1083 | 3.60.06 | 90 |
| (20,0) | 80.8 | 803 | 536 | 5 | – | – | 0.40.04 | 10 | |
| NGC 3656 | (0,0) | 119.62.2 | -344 | 4338 | 2004.5 | -317 | 40723 | 22.90.41 | 142 |
| (22,22) | 9.21.3 | -1928 | 11217 | 29.84.0 | 610 | 32245 | 1.70.25 | 11 | |
| (0,22) | 9.41.6 | -18412 | 15333 | 8 | – | – | 1.80.3 | 11 | |
| (22,0) | 47.62.0 | -209 | 43318 | 2.70.8 | -788 | 5119 | 9.10.4 | 57 | |
| (22,-22) | 8.61.7 | 10714 | 14332 | 5.71.0 | 1066 | 7314 | 1.640.3 | 10 | |
| (0,-22) | 18.61.5 | 1309 | 23223 | 7 | – | – | 3.550.3 | 22 | |
| (0,-33) | 3.61.0 | 12618 | 13546 | 4.81.0 | 9116 | 14930 | 0.690.2 | 4.3 | |
| (2,-45) | 1.50.3 | 17915 | 13929 | 2.50.8 | 10534 | 18767 | 0.290.06 | 1.8 | |
| see | 11 pt | map | |||||||
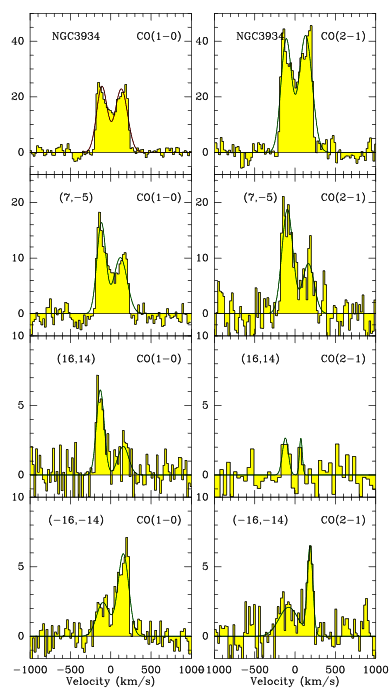
| NGC 3934 | (0,0) | 42.80.8 | 224 | 3847 | 78.91.7 | 304 | 3969 | 110.2 | 51 |
| (7,-5) | 21.40.8 | -177 | 35013 | 18.73 | -7819 | 21067 | 5.50.2 | 25 | |
| (16,14) | 3.70.4 | -1287 | 11517 | 1.20.4 | -11917 | 8627 | 0.90.1 | 4 | |
| (-16,-14) | 6.61 | 13418 | 25577 | 30.5 | 1847 | 9019 | 1.70.2 | 8 | |
| (11,12) | 10 | – | – | 90 | – | – | 2.5 | 11 | |
| NGC 5018 | (0,0) | 1.8 | – | – | 4 | – | – | 0.27 | 2 |
| (44,-22) | 3 | – | – | 4 | – | – | 0.45 | 3.6 | |
| (-22,22) | 3 | – | – | 3 | – | – | 0.45 | 3.6 | |
| NGC 7600 | (0,0) | 3 | – | – | 4.8 | – | – | 0.5 | 3.6 |
| (143,32) | 2 | – | – | 5 | – | – | 0.3 | 2 | |
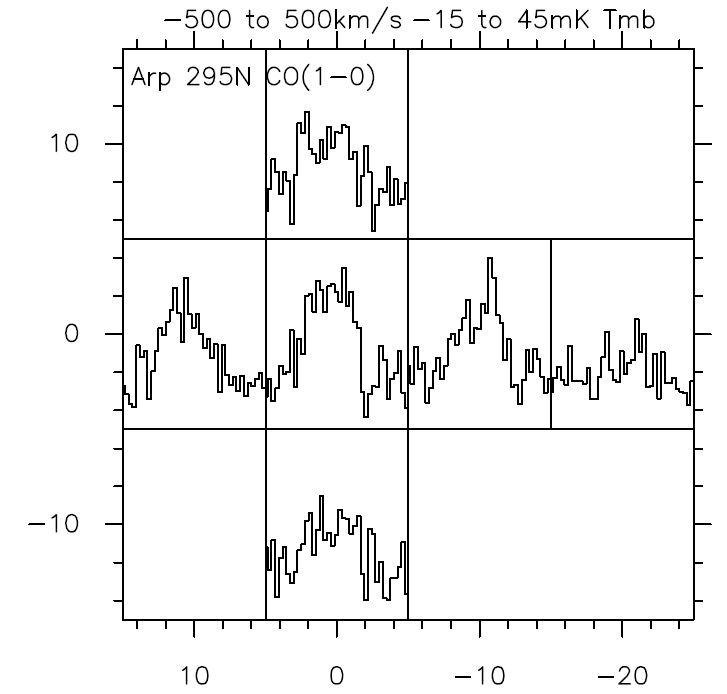
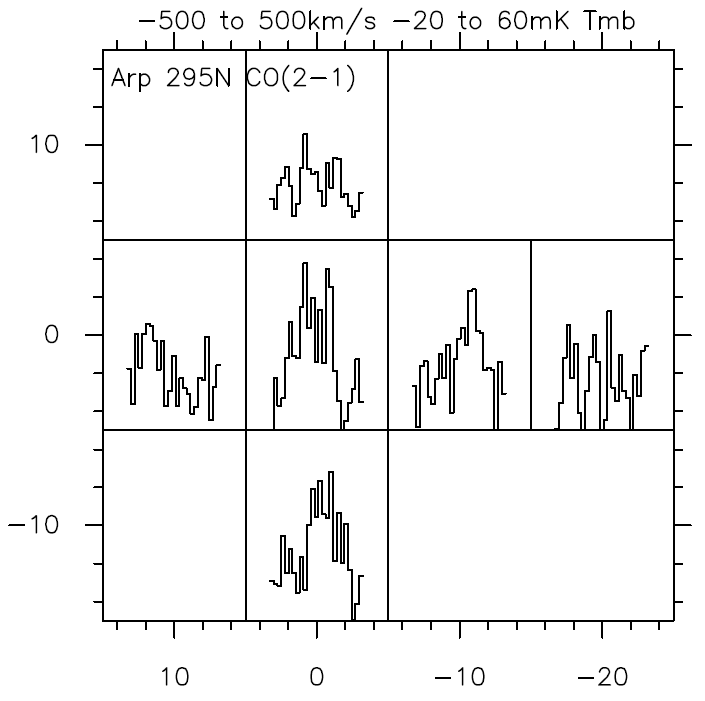
| ARP 295N | (0,0) | 584 | -5411 | 33324 | 385 | -4220 | 26840 | 534 | 69 |
| (-10,0) | 453.8 | 1614 | 34033 | 25.85.6 | 8514 | 13635 | 413.4 | 53 | |
| (-20,0) | 7.62.2 | 11013 | 9335 | 2 | – | – | 6.92 | 9 | |
| see | 6 pt | map |
-
–Integrated flux, velocity and FWHM obtained through gaussian fits – Velocities are counted from the central redshifts indicated in Table 1 – The H2 masses are estimated within the CO(1-0) beam of 23”, with the standard conversion factor of the Milky Way = 4.36 M. – Upper limits are given at 3, assuming a FWHM of 300 km s-1.
The last column of Table 2 reports the average molecular surface density, within the CO(1-0) beam of 23 arcsec for each galaxy. This shows that galaxies of later type (like NGC 3656 or NGC 3934) tend to have a richer content in molecular gas, which might be due to their own gas before the accretion event. We have checked that the total molecular content is correlated to the FIR luminosity (see Table 1), and that galaxies of our sample are compatible with the global Kennicutt-Schmidt (KS) diagram, as shown for local early-type galaxies by Combes et al. (2007). However, we have not enough sensitivity in H or FUV/NUV (GALEX) images to be able to determine the star formation surface density on shells, and compare to the molecular surface densities, to study the KS diagram of shells.
4.2 CO Spectra
For most of the shell galaxies detected in CO emission at least in their center, we have tried to cover the outer stellar shells, through simultaneous pointing in CO(1-0) and CO(2-1) lines. Shells are not only reduced to their sharp edges, but extend also inside these arcs in a nearly flat plateau emission, as can be seen in Figure 2 for example. With the large CO beams, we can thus hope to collect also emission from these regions. The best resolution we have, 11 arcsec, corresponds to 1-5 kpc typically on the galaxies, and is just sufficient to separate the shell regions from the center, while the 23 arcsec beam is not. Frequently, the CO(1-0) emission is detected in the shell offset position, but the CO(2-1) is not, which can be interpreted as the absence of detection in the shell itself. The CO(1-0) emission is then only due to some central emission seen at the border of the beam.
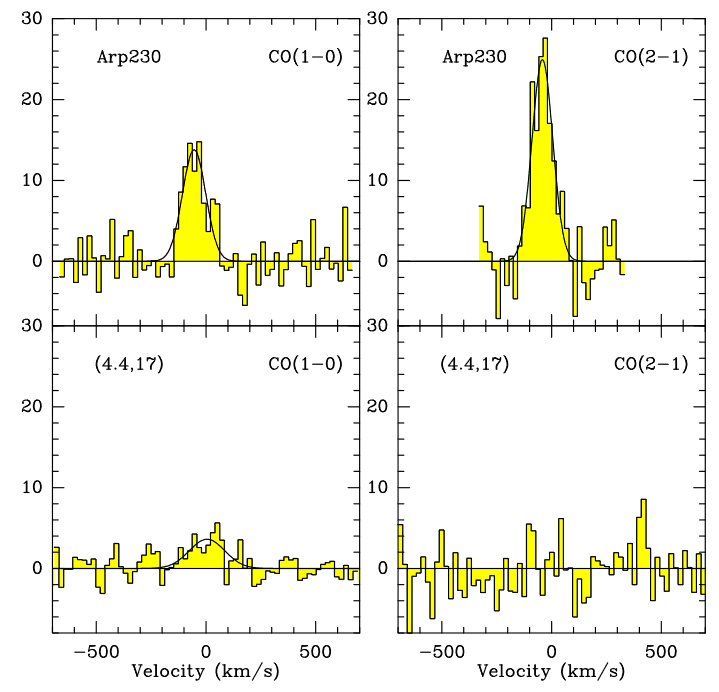
This is clearly the case for Arp 230, as shown in Fig. 9. There is a strong concentration of CO emission towards the center, which results in the peak main beam temperature being nearly twice in CO(2-1) with respect to CO(1-0). The offset beam, at 17.5 ” = 2 kpc from the center, is detected in CO(1-0) but is consistent with emission from the central disk. The offset is not detected in CO(2-1), which beams does not overlap with the disk. Ueda et al. (2014) have mapped the CO(1-0) emission with ALMA with 4 arcsec resolution, and showed that it is confined in a thin rotating edge-on disk, 5kpc in diameter, corresponding to the dust lane prominent in Fig. 1. Since no emission at all is detected in the farthest shell, at 3kpc from the center, we conclude that there is no gas detectable in the shells.
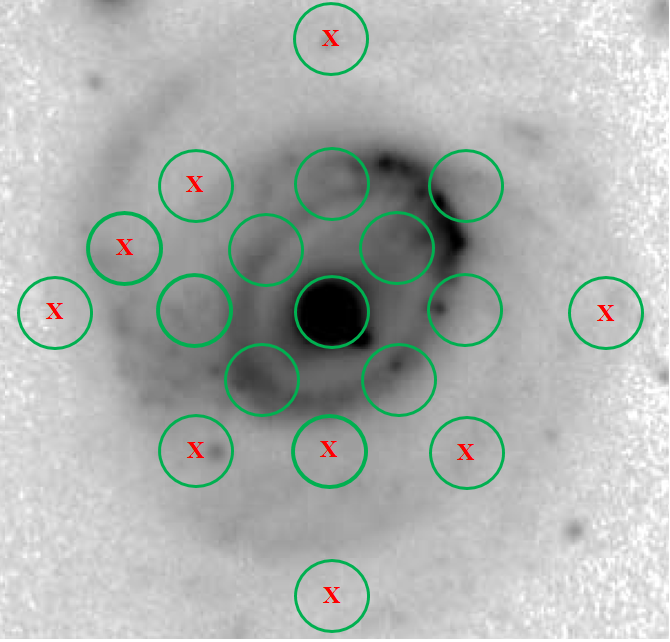
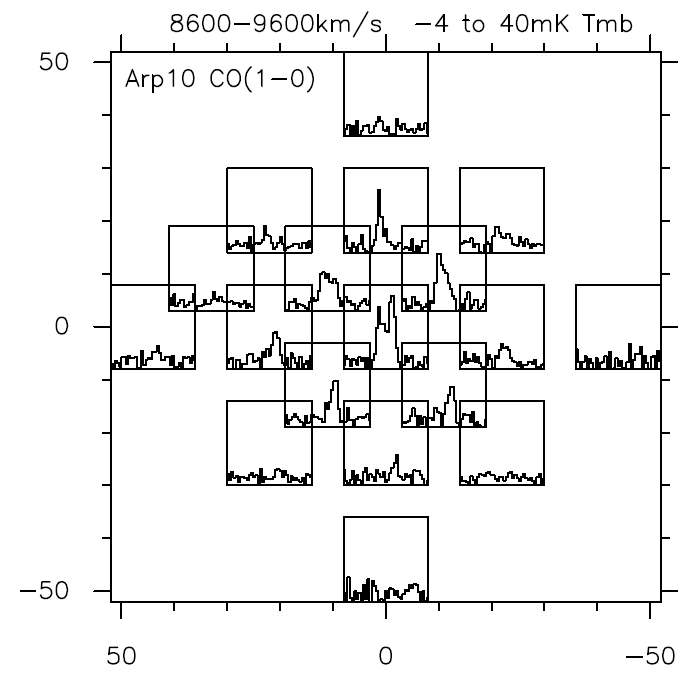
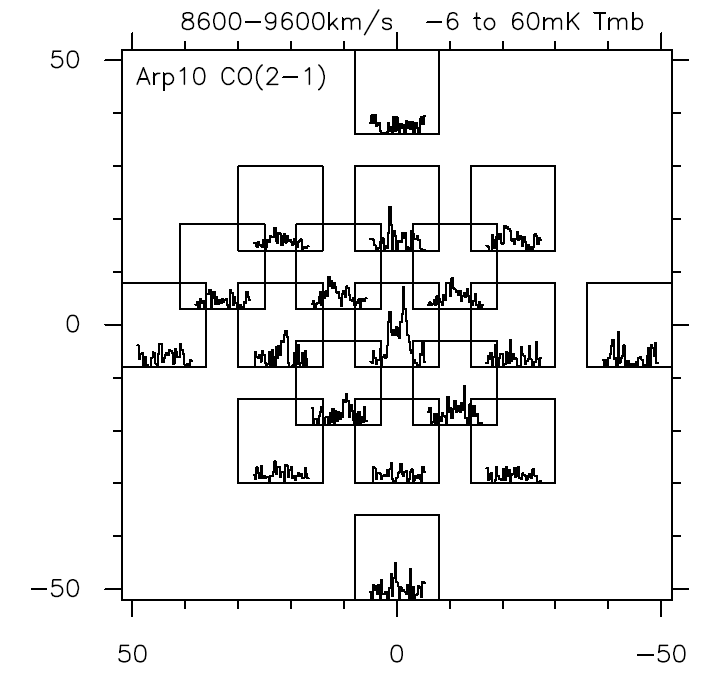
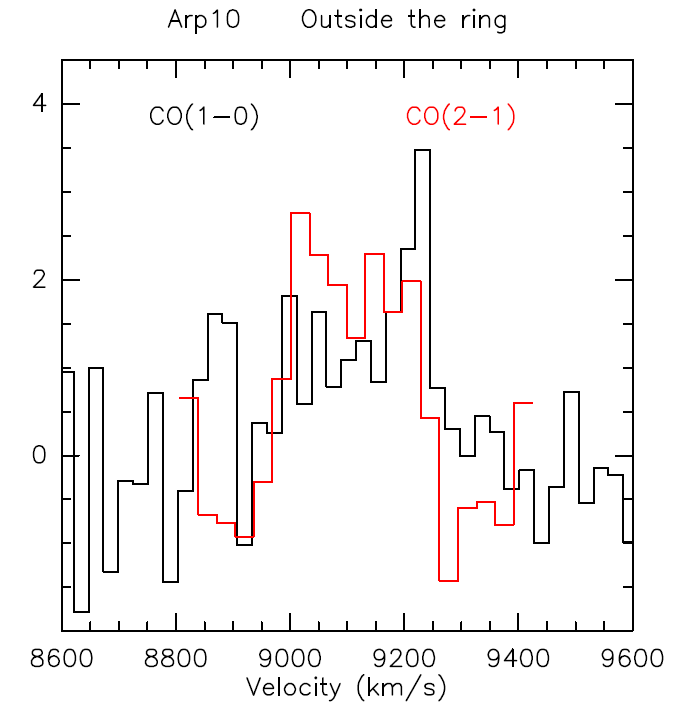
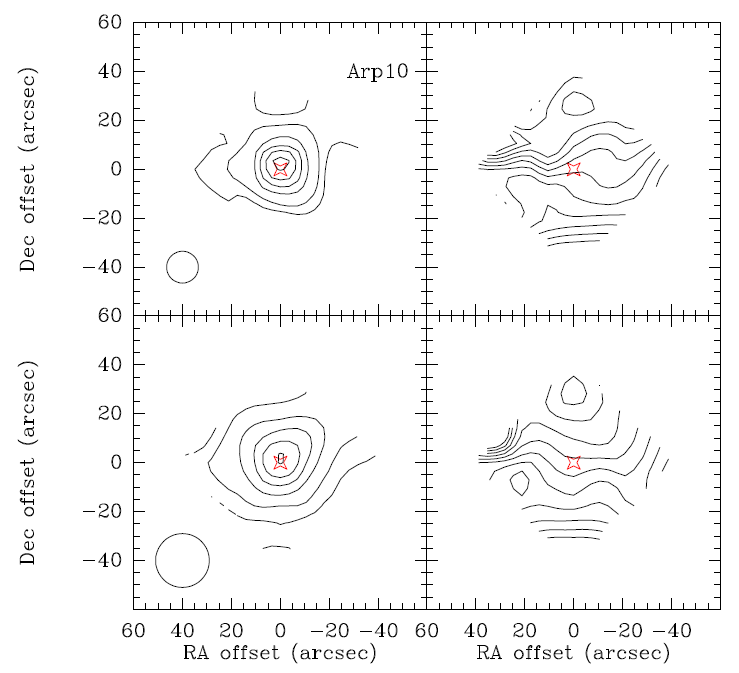
The case of Arp 10 is different, since the collision at the origin of the shells, also produced a collisional ring in the center, i.e. a wave propagating radially outward, from the center, due to the excitation of a head-on collision with a small impact parameter (e.g., Appleton & Struck-Marcell, 1996). In the CO(2-1) map of spectra of Fig. 11, the emission is clearly extended, not only on the ring, but also on the shells. The comparison between the two lines (Fig. 10 and 11) suggests that indeed, the gas has been detected as far as 26 kpc from the center, in ripples and shells due to the interaction. To better quantify the amount of gas involved, we have stacked all the spectra clearly outside the ring: the 9 offsets considered are indicated by a red cross in Fig. 4. These 9 offsets correspond to the shells. The resulting stacked spectra of CO(1-0) and CO(2-1) lines are plotted in Fig. 12. All these positions outside the ring were stacked, with their velocity recentered around the systemic velocity of 9100 km s-1. The resulting CO(2-1) spectrum is the most significant, due to the smaller beams, excluding overlap with the center. The strength of the CO(2-1) is similar and even stronger than the CO(1-0), meaning the presence of molecular gas outside the ring, in the shells. From this stacked spectrum, we derived a molecular content of M(H2) = 3.4 109 M⊙ in the shells, assuming the conversion factor adopted in Sec. 4.1. An overview of the CO(1-0) and CO(2-1) surface densities and velocity fields is displayed in Fig. 13. The velocity gradient is comparable to that of the ionized gas, and is limited due to the almost face-on (i=22∘) inclination (Bizyaev et al., 2007).
The case of NGC 3032 is quite similar to the map shown in Arp 230. Fig. 14 is typical of a quite concentrated CO emission, with the main beam temperature of the CO(2-1) line peaking higher than that of the CO(1-0). The offset shell region is not overlapping the center with the 11 arcsec beam, and no CO(2-1) is detected there, while the CO(1-0) line shows the redshifted part of the emission, compatible with the inner rotating disk, expected to coincide with the dust lanes (see Fig. 5). It can be concluded that the shell region is not detected in the molecular gas.
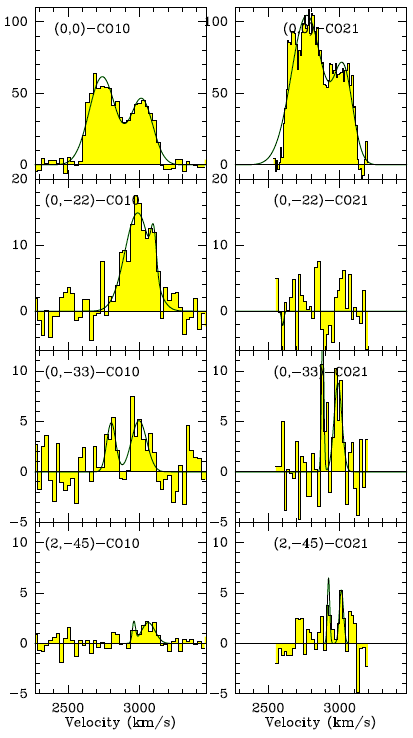
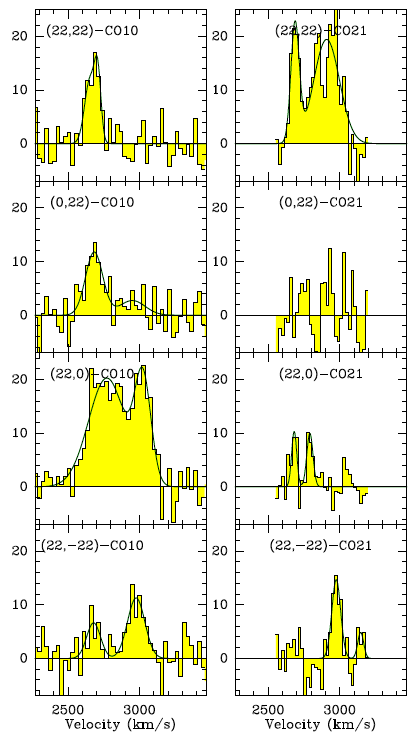
The shell galaxy NGC 3656 appears to be one of the best case of an elliptical galaxy having accreted a companion, and having formed shells through phase-wrapping (Balcells et al., 2001). The accreted companion must have been rich in gas, having left a N-S dust lane, terminated by the southern shell at 9 kpc. This southern shell is clearly detected in molecular gas, as seen through the comparison of the CO(2-1) and CO(1-0) spectra in Fig. 15, and corresponding map (Fig. 17). There are also shells in the outer north, east and west observed beams, which show CO(1-0) emission, but no clear CO(2-1) (Fig. 16 and Table 2). CO(1-0) and CO(2-1) are simultaneously clearly detected only in the (22,22), (22,-22) and (0,-33) positions. The velocity of the CO gas in the shells spans a range around the systemic velocity, as is the velocity of stars in the southern shell (Balcells et al., 2001). In the extremity of the southern shell, the velocity profile is broad: it shows a double-horn shape from 2700 to 3100 km s-1at (0,-33) and a single component from 2900 to 3100 km s-1at (2,-45) in CO(1-0). In other places, it also shows a two-horn shape, which usually is only seen in the central beam for rotating disks, but is not compatible with a rotating disk in the outer parts. This means that there exist two components, with different angular momentum. In the HI component, there is also a trend of counter-rotation, as claimed by Balcells et al. (2001). The inner disk is however rotating, being redshifted in the south, and blueshifted in the north, as is the HI disk, observed by Balcells et al. (2001). The fact that the CO emission observed toward the southern shell has a velocity different from what is expected from the disk rotation, confirms its origin in a phase-wrapped shell.
Averaging over the 3 observed beams covering the southern shell, we obtain a surface density of = 9 M⊙pc-2 and we derive a molecular content of M(H2) = 3.8 108 M⊙ in the 9 kpc-shell, assuming the conversion factor adopted in Sec. 4.1.
NGC 3934 is a late-type galaxy, with randomly oriented shells around a nearly edge-on disk, traced by a linear dust lane. It has been confused with a polar ring galaxy, but this is not the right classification (Bettoni et al., 2011). The beams clearly pointed to the shells, and not overlapping with the disk (see Fig. 7), with symmetrical offsets of 21” = 5 kpc from the center, are clearly detected in both CO(1-0) and CO(2-1), as seen in Fig. 18. Therefore molecular gas is detected in the shells. There is no shift in average velocity for the gas in the shells, with respect to the disk. However, the line profiles in the shells show a two-horn shape, indicating the presence of two opposite signs of the relative angular momentum of the shell material relative to the primary galaxy. This two-horn shape is frequently observed towards the center of galaxies, and are then characteristic of a disk in rotation. This is due to the observing beam covering both the receding (red) and approaching (blue) sides. In the outer parts, only one velocity component is expected for a rotating disk. The presence of a two-horn shape in the outer profiles supports the gas shell scenario. The varying CO(2-1) to CO(1-0) ratios from one position to the other is due to the different beams, and help to distinguish the possible contamination in the larger CO(1-0) beam.
Summing the molecular content of the two shells detected, we find M(H2) = 2.6 108 M⊙, see Table 2.
The northern galaxy of the Arp 295 pair is a nearly edge-on spiral, which is strongly perturbed by the interaction, with disordered shells and ripples. The observed spectra of Fig. 19 and 20 are essentially compatible with molecular gas in the disk, with some extension in the western shell (see Table 2). However, the emission does not extend far in the most western offset, so it is still marginal.
5 Discussion
The dynamical mechanism to form shells through phase-wrapping has been described in detail (Quinn, 1984; Dupraz & Combes, 1986, 1987). Stars from a companion, liberated by tidal forces, oscillate in the primary galaxy potential, and a sharp edge forms as an outward propagating wave, at their apocenters. There could be radial oscillation in a prolate potential, forming alternate shells with zero velocity at their edge, or less radial ones, with angular momentum, forming shells around the equatorial plane of an oblate potential, keeping some rotational velocity at their edge. Another mechanism is space-wrapping, where shells occur as ordinary loops in interactions and mergers, with larger velocities.
5.1 Molecular clouds in shells
Since gas is dissipative, it may appear surprising to find gas in shells. During radial oscillations, the diffuse gas should fall into the center. Dense gas clouds do experience much less dissipation than diffuse HI gas. Moreover, numerical modeling of the formation of shells (Combes & Charmandaris, 2000), using a realistic distribution of its stellar and gaseous component, showed that in fact one can easily reproduce the observed spatial distribution of gaseous and stellar shells within the standard models of the theory of shell formation. A confirmation of this model was the detection of molecular gas associated with the shells in Centaurus A (Charmandaris et al., 2000). Using SEST telescope, they detected a molecular gas of M⊙ with the same kinematical characteristics as the HI shells.
The model predicts that a significant fraction of the merger-remnant dense molecular clouds should have similar dynamical behavior to the stellar component. The present detection of molecular clouds in shells through CO emission supports the model. With higher spatial resolution, it will be possible to determine the difference in position between the gas and stars in shells, and infer the loss of angular momentum during the encounter.
5.2 CO velocity in shells
CO emission in shells were clearly detected for three galaxies: Arp 10, NGC 3656 and NGC 3934. In the case of Arp 10, the inclination on the sky plane is small (i=14∘ from Hyperleda), and the small velocity difference with respect to the systemic recession velocity for the gas in the shells is compatible with both phase and space wrapping. For the two other galaxies, the inclination is relatively large (i=51∘ and i=46∘ for NGC 3656 and 3934 respectively), and the average velocity with respect to the systemic velocity of the shells is relatively small. However, the CO profiles in the shells are broad, and even in both NGC 3656 and NGC 3934 show a two-horn shape. This means that the CO beam is covering a large shell region, where the material is not only in radial orbits, but keeps a tangential velocity at apocenter. In the line of sight towards the observer, are projected both some material with positive and negative angular momentum with respect to the galaxy.
This configuration is impossible to encounter with a disk in rotation. Two-horn profiles are only seen when the observation beam is covering a wide region near the center, including both the approaching and receding sides. For an observation far from the center of the rotating disk, only one velocity peak (either blue or red) is expected. For shells on the contrary, the material from the companion is infalling on a nearly radial orbit, and there may exist part of the matter arriving with a positive, and part with a negative angular momentum with respect to the primary galaxy. In the shell region far from the center, it is possible to have the two velocity signs towards the same line of sight. The two-horn profile shape is therefore supporting the CO detection in shells. Confirmation of this scenario is required, through observations with higher spatial resolution.
5.3 Comparison with HI in shells
HI has been mapped in Arp 230 (Schiminovich et al., 2013), NGC 474 (Rampazzo et al., 2006), Arp 10 (Charmandaris & Appleton, 1996), NGC 3032 (Oosterloo et al., 2010), NGC 3656 (Balcells et al., 2001), Arp 295 (Hibbard & van Gorkom, 1996). In all these 6 galaxies, the HI is extended enough to cover the shells, and in NGC 3656, the HI is clearly seen associated with the southern stellar shell, with compatible kinematics. In most cases, however, the spatial resolution is not sufficient to clearly conclude that the gas provided by a small merging companion has been crossing the system, and oscillates in the shells. The only system where the presence of HI gas in shells is clear is in NGC 3656, that Balcells et al. (2001) compare to NGC 5128 (Centaurus A), where the first HI shells were discovered (Schiminovich et al., 1994). Given the orientation of the gas and dusty disk, perpendicular to the main stellar body, this shell system must have been formed through phase-wrapping of material in radial orbits. The presence of HI and CO emission in the shells can only be explained by the presence of a clumpy low-filling factor gas, with low dissipation (Combes & Charmandaris, 2000).
6 Summary
We have carried out CO(1-0) and CO(2-1) line observations of nine shell galaxies with the IRAM-30m telescope. Molecular gas was detected in six of them, together with two of the companions. In three of the detected galaxies (Arp 230, NGC 3032 and Arp 205N), we cannot conclude that gas is detected in the shells, the detection is compatible with gas in the inner rotating disk. In the three remaining galaxies (Arp 10, NGC 3656 and NGC 3934), molecular gas is clearly detected in the shells, with a velocity close to systemic, and not in continuity with the inner rotating disk. The amount of molecular gas is estimated at M(H2) = 3.4 109 M⊙ in the shells outside the ring in Arp 10, 3.8 108 M⊙ in the southern shell of NGC 3656, and 2.6 108 M⊙ in the two detected shells of NGC 3934.
The mechanism to form those gaseous shells might be different. For two cases at least (Arp 10, NGC 3656), the encounter with the small companion had a very small impact parameter, and the phase-wrapping in a nearly radial orbit must be playing the major role. The morphology of Arp 10 corresponds to an oblate system, as well as most shells in NGC 3656. However, the major shell might be only the end of the tidal tail. The gas of the companion of NGC 3656 has left a radial trace, visible as a contrasted dust lane, and the major shell is found in continuity, indicating the companion orbit, and that of the tidal debris. NGC 3934 main body is seen nearly edge-on on the sky, and the situation is less clear. Shells distributed symmetrically at about 40∘ of the minor axis are clearly detected in molecular gas. The fact that gas can be detected in shells tend to support the clumpiness and low dissipative character of a large part of the interstellar medium. The line profiles in the shells reveal a two-horn shape, indicating the presence of both positive and negative angular momentum relative to the primary galaxy. This supports the CO detection in shells, since it is impossible to explain a two-horn profile in the outer parts of a rotating galaxy disk. Material from the companion must have infallen in a nearly radial orbit, part of it with a positive and the other part a negative impact parameter. The material acquired a tangential velocity at apocenter. The shells are then also phase-wrapped. Follow-up with higher spatial resolution is required to test the relative position of gas and stellar shells, to confirm the dynamical mechanism.
Acknowledgements.
We warmly thank the referee for constructive comments and suggestions. This work is based on observations carried out with the IRAM 30m telescope. IRAM is supported by INSU/CNRS (France), MPG (Germany) and IGN (Spain). This publication has made use of data products from the NASA/IPAC Extragalactic Database (NED). We acknowledge the usage of the HyperLeda database (http://leda.univ-lyon1.fr).References
- Alatalo et al. (2013) Alatalo, K., Davis, T. A., Bureau, M., et al. 2013, MNRAS, 432, 1796
- Appleton & Struck-Marcell (1996) Appleton, P. N. & Struck-Marcell, C. 1996, Fund. Cosmic Phys., 16, 111
- Arp (1966) Arp, H. 1966, ApJS, 14, 1
- Balcells & Stanford (1990) Balcells, M. & Stanford, S. A. 1990, ApJ, 362, 443
- Balcells et al. (2001) Balcells, M., van Gorkom, J. H., Sancisi, R., & del Burgo, C. 2001, AJ, 122, 1758
- Barnes & Hernquist (1992) Barnes, J. E. & Hernquist, L. 1992, ARA&A, 30, 705
- Bettoni et al. (2011) Bettoni, D., Galletta, G., Rampazzo, R., et al. 2011, A&A, 534, A24
- Bizyaev et al. (2007) Bizyaev, D. V., Moiseev, A. V., & Vorobyov, E. I. 2007, ApJ, 662, 304
- Bolatto et al. (2013) Bolatto, A. D., Wolfire, M., & Leroy, A. K. 2013, ARA&A, 51, 207
- Buson et al. (2004) Buson, L. M., Bertola, F., Bressan, A., Burstein, D., & Cappellari, M. 2004, A&A, 423, 965
- Carter et al. (1982) Carter, D., Allen, D. A., & Malin, D. F. 1982, Nature, 295, 126
- Charmandaris & Appleton (1996) Charmandaris, V. & Appleton, P. N. 1996, ApJ, 460, 686
- Charmandaris et al. (2000) Charmandaris, V., Combes, F., & van der Hulst, J. M. 2000, A&A, 356, L1
- Chien et al. (2007) Chien, L.-H., Barnes, J. E., Kewley, L. J., & Chambers, K. C. 2007, ApJ, 660, L105
- Combes & Charmandaris (2000) Combes, F. & Charmandaris, V. 2000, in Astronomical Society of the Pacific Conference Series, Vol. 197, Dynamics of Galaxies: from the Early Universe to the Present, ed. F. Combes, G. A. Mamon, & V. Charmandaris, 339
- Combes et al. (2007) Combes, F., Young, L. M., & Bureau, M. 2007, MNRAS, 377, 1795
- Cooper et al. (2011) Cooper, A. P., Martínez-Delgado, D., Helly, J., et al. 2011, ApJ, 743, L21
- Duc et al. (2015) Duc, P.-A., Cuillandre, J.-C., Karabal, E., et al. 2015, MNRAS, 446, 120
- Dupraz & Combes (1986) Dupraz, C. & Combes, F. 1986, A&A, 166, 53
- Dupraz & Combes (1987) Dupraz, C. & Combes, F. 1987, A&A, 185, L1
- Galletta et al. (1997) Galletta, G., Sage, L. J., & Sparke, L. S. 1997, MNRAS, 284, 773
- Hernquist & Quinn (1988) Hernquist, L. & Quinn, P. J. 1988, ApJ, 331, 682
- Hernquist & Quinn (1989) Hernquist, L. & Quinn, P. J. 1989, ApJ, 342, 1
- Hibbard & van Gorkom (1996) Hibbard, J. E. & van Gorkom, J. H. 1996, AJ, 111, 655
- Huchtmeier (1982) Huchtmeier, W. K. 1982, A&A, 110, 121
- Kim et al. (1988) Kim, D.-W., Guhathakurta, P., van Gorkom, J. H., Jura, M., & Knapp, G. R. 1988, ApJ, 330, 684
- Lim et al. (2017) Lim, S., Peng, E. W., Duc, P.-A., et al. 2017, ApJ, 835, 123
- Lucero & Young (2013) Lucero, D. M. & Young, L. M. 2013, AJ, 145, 56
- McDermid et al. (2006) McDermid, R. M., Emsellem, E., Shapiro, K. L., et al. 2006, MNRAS, 373, 906
- McGaugh & Bothun (1990) McGaugh, S. S. & Bothun, G. D. 1990, AJ, 100, 1073
- Oosterloo et al. (2010) Oosterloo, T., Morganti, R., Crocker, A., et al. 2010, MNRAS, 409, 500
- Prieur (1988) Prieur, J.-L. 1988, ApJ, 326, 596
- Quinn (1984) Quinn, P. J. 1984, ApJ, 279, 596
- Rampazzo et al. (2006) Rampazzo, R., Alexander, P., Carignan, C., et al. 2006, MNRAS, 368, 851
- Rampazzo et al. (2007) Rampazzo, R., Marino, A., Tantalo, R., et al. 2007, MNRAS, 381, 245
- Renaud et al. (2015) Renaud, F., Bournaud, F., & Duc, P.-A. 2015, MNRAS, 446, 2038
- Richter et al. (1994) Richter, O.-G., Sackett, P. D., & Sparke, L. S. 1994, AJ, 107, 99
- Sage & Wrobel (1989) Sage, L. J. & Wrobel, J. M. 1989, ApJ, 344, 204
- Sansom et al. (2000) Sansom, A. E., Hibbard, J. E., & Schweizer, F. 2000, AJ, 120, 1946
- Schiminovich et al. (1997) Schiminovich, D., van Gorkom, J., van der Hulst, T., Oosterloo, T., & Wilkinson, A. 1997, in Astronomical Society of the Pacific Conference Series, Vol. 116, The Nature of Elliptical Galaxies; 2nd Stromlo Symposium, ed. M. Arnaboldi, G. S. Da Costa, & P. Saha, 362
- Schiminovich et al. (2013) Schiminovich, D., van Gorkom, J. H., & van der Hulst, J. M. 2013, AJ, 145, 34
- Schiminovich et al. (1994) Schiminovich, D., van Gorkom, J. H., van der Hulst, J. M., & Kasow, S. 1994, ApJ, 423, L101
- Schiminovich et al. (1995) Schiminovich, D., van Gorkom, J. H., van der Hulst, J. M., & Malin, D. F. 1995, ApJ, 444, L77
- Schweizer (1990) Schweizer, F. 1990, Interactions in our time., ed. R. Wielen, 60–71
- Schweizer & Seitzer (1992) Schweizer, F. & Seitzer, P. 1992, AJ, 104, 1039
- Serra et al. (2008) Serra, P., Trager, S. C., Oosterloo, T. A., & Morganti, R. 2008, A&A, 483, 57
- Sofue et al. (1993) Sofue, Y., Wakamatsu, K.-I., Taniguchi, Y., & Nakai, N. 1993, PASJ, 45, 43
- Solomon & Vanden Bout (2005) Solomon, P. M. & Vanden Bout, P. A. 2005, ARA&A, 43, 677
- Tateuchi et al. (2015) Tateuchi, K., Konishi, M., Motohara, K., et al. 2015, ApJS, 217, 1
- Toomre & Toomre (1972) Toomre, A. & Toomre, J. 1972, ApJ, 178, 623
- Turnbull et al. (1999) Turnbull, A. J., Bridges, T. J., & Carter, D. 1999, MNRAS, 307, 967
- Ueda et al. (2014) Ueda, J., Iono, D., Yun, M. S., et al. 2014, ApJS, 214, 1
- van Driel et al. (2000) van Driel, W., Arnaboldi, M., Combes, F., & Sparke, L. S. 2000, A&AS, 141, 385
- van Gorkom (2000) van Gorkom, J. 2000, in Radio interferometry : the saga and the science, ed. D. G. Finley & W. M. Goss, 137
- Weil & Hernquist (1993) Weil, M. L. & Hernquist, L. 1993, ApJ, 405, 142
- Whitmore et al. (1990) Whitmore, B. C., Lucas, R. A., McElroy, D. B., et al. 1990, AJ, 100, 1489
- Whitmore et al. (1993) Whitmore, B. C., Schweizer, F., Leitherer, C., Borne, K., & Robert, C. 1993, AJ, 106, 1354
- Wiklind et al. (1995) Wiklind, T., Combes, F., & Henkel, C. 1995, A&A, 297, 643
- Young (2002) Young, L. M. 2002, AJ, 124, 788
- Young et al. (2011) Young, L. M., Bureau, M., Davis, T. A., et al. 2011, MNRAS, 414, 940
Appendix A The molecular content of companions
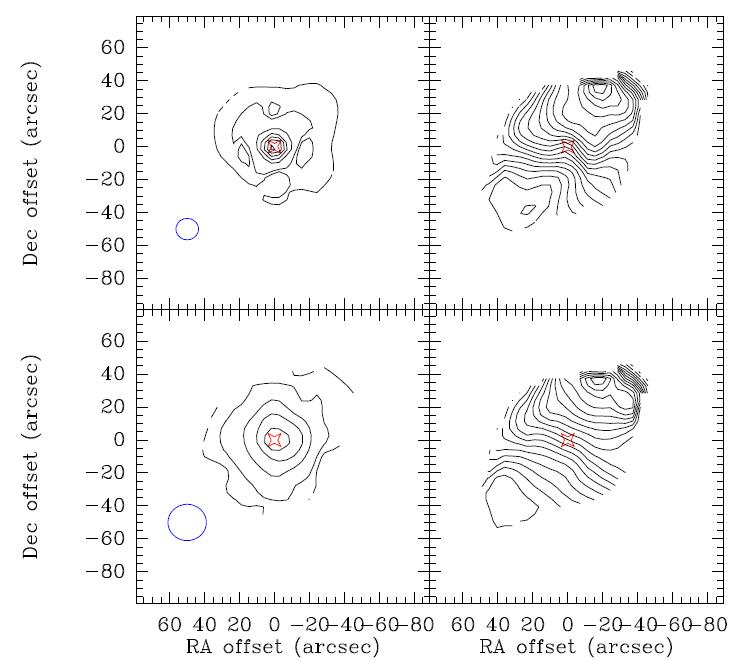
The companion of the shell galaxy NGC 474 (Arp 227) is a late-type spiral galaxy, NGC 470, which is rich in HI and CO emission. It is likely that the HI extension covering NGC 474 (see Fig. 3) has been accreted from this companion. The beams observed on NGC 470 are displayed in Fig. 2. The spectra maps in CO(1-0) and CO(2-1) are displayed in Fig. 21 and 22 respectively. Isocontours of the surface density and the velocity fields are plotted in 23.
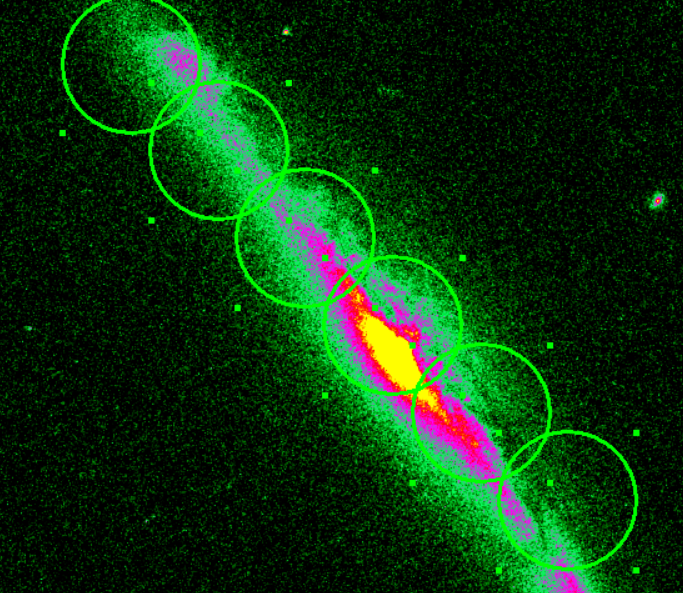
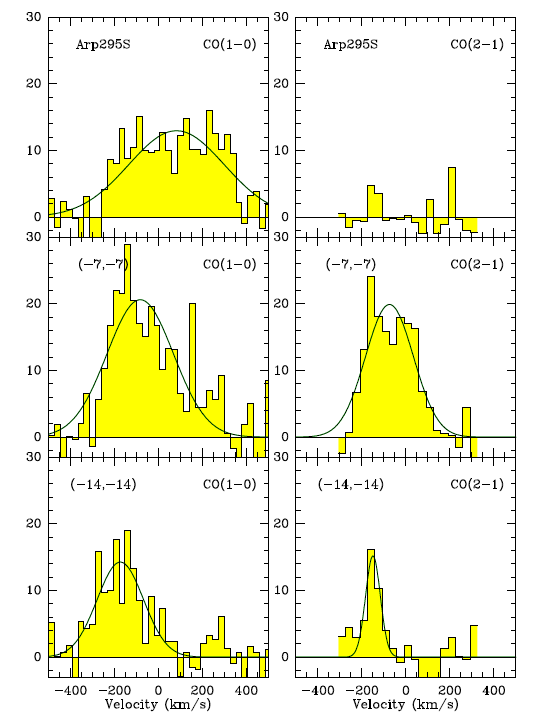
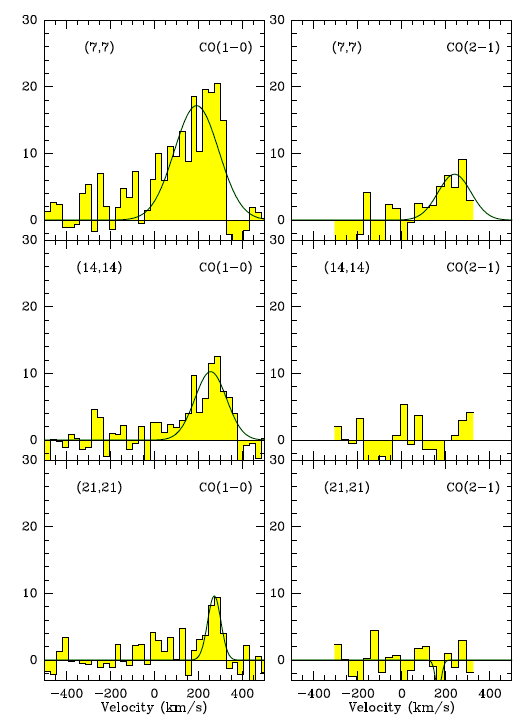
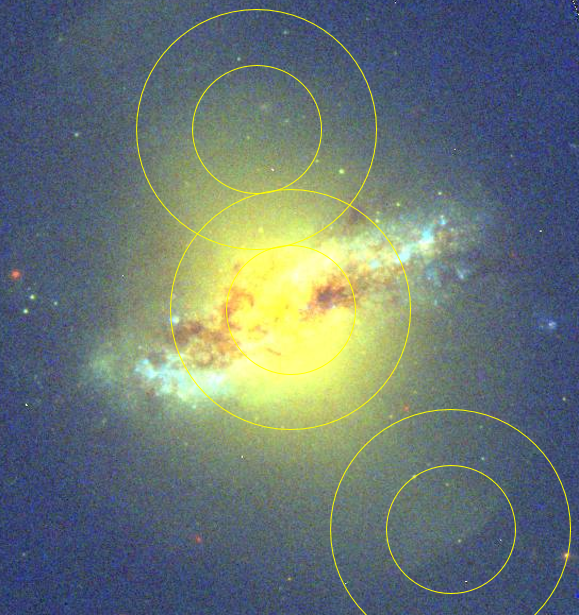
The other member of the pair in Arp 295 is an edge-on spiral galaxy, rich in molecular gas. The pointings are displayed on an HST F814W image in Fig. 24. CO spectra in Arp 295S are plotted in Fig. 25 and 26 . The molecular content in each beam is detailed in Table 3.
| CO(1-0) | CO(2-1) | ||||||||
| Galaxy | Offsets | Int-Flux | V | V | Int-Flux | V | V | M(H2) | (H2) |
| (”,”) | Jy km s-1 | km s-1 | km s-1 | Jy km s-1 | km s-1 | km s-1 | M⊙ | M⊙pc-2 | |
| NGC 470 | (0,0) | 1262 | 662 | 2524 | 2162 | 881 | 2462 | 140.2 | 151 |
| see | 31 pt | map | |||||||
| ARP 295S | (0,0) | 35.33 | 8222 | 51248 | 4 | – | – | 32.53 | 42 |
| (-7,-7) | 393.5 | -8216 | 35540 | 27.12.5 | -7411 | 25624 | 363 | 47 | |
| (-14,-14) | 191.6 | -17310 | 24825 | 6.41.3 | -1507 | 8023 | 171.5 | 22 | |
| (7,7) | 222 | -19212 | 23827 | 6.53 | 23938 | 17696 | 20.32 | 26 | |
| (14,14) | 9.21.1 | 25611 | 16925 | 2.5 | – | – | 8.51 | 11 | |
| (21,21) | 3.60.7 | 2727 | 7117 | 2.5 | – | – | 3.30.6 | 4 |
-
–Integrated flux, velocity and FWHM obtained through gaussian fits – Velocities are counted from the central redshifts indicated in Table 1 for the companion galaxy – The H2 masses are estimated within the CO(1-0) beam of 23”, with the standard conversion factor of the Milky Way = 4.36 M. – Upper limits are given at 3, assuming a FWHM of 300 km s-1.