Dissociation dynamics in the dissociative electron attachment to ammonia molecule
Abstract
Complete dissociation dynamics of low energy electron attachment to ammonia molecule has been studied using velocity slice imaging (VSI) spectrometer. One low energy resonant peak around 5.5 eV and a broad resonance around 10.5 eV incident electron energy has been observed. The resonant states mainly dissociate via H- and NH fragments, though for the upper resonant state, signature of NH- fragments are also predicted due to three body dissociation process. Kinetic energy and angular distributions of the NH fragment anions are measured simultaneously using VSI technique. Based on our experimental observations, we find the signature of A1 symmetry in the 10.5 eV resonance energy whereas, the 5.5 eV resonance is associated with the well known A1 symmetry.
1 Introduction
Inelastic electron-molecule collisions lead to production of ions and neutral fragments. Dissociative electron attachment (DEA) is a process in which low energy electron is resonantly captured by the molecule and a temporary negative ion state (TNI) is formed. Subsequently, the resonance state decays into anion and neutral fragment(s). DEA is a topic of interest these days and has been studied by different groups for several molecules [1, 2, 3, 4]. For example, interaction of high energy radiation with DNA produces low energy secondary electrons, which causes damage to living cells (like single-double strands breaks, DNA-protein cross-links, Mutation, Apoptosis, etc) via DEA to DNA and to its surrounding molecules [5, 6, 7, 8]. This has provided impetus to rigorous studies on DEA to DNA and respective biomolecules [9, 10, 11, 12].
Ammonia (NH3) is certainly an essential component for many biological and chemical processes. It is the source of nitrogen for plants (a part of nitrogen cycle), therefore approximately of industrial ammonia is used for the production of fertilizers, and it also serves as a raw material for making explosives and cleaning fluids. At the cellular level, its ions are present in nucleic acids. The toxic effect of ammonia can be seen in all animals where it causes neurological dysfunctions [13]. In Interstellar medium, it is found in the dense molecular clouds of a galaxy [14] and in grain surfaces [15, 16]. It is one of the simplest molecules considered while simulating for the production of amino acids in interstellar ice which also gives answers to the generation of life on earth [17].
The study of DEA to ammonia dates back to 1969 when Sharp and Dowell [18] and Compton et al. [19] confirmed the two resonances for DEA to ammonia, both producing H- and NH ions. At the higher resonance, the presence of the NH- ion with comparatively lower cross-section was also observed. The cross-sections measured by these two groups differ by a factor of 2 for a particular resonant state anions. Later Rawat et al. [20] reconfirmed that the resonant states occurred at 5.5 eV and 10.5 eV incident electron energy. The authors also measured the absolute cross-sections for both the resonance state anions using relative flow technique and the reported values for NH ion for both the resonances are 1.6 10-18 cm2 and 0.09 10-18 cm2 respectively.
In 1986, Burrow et al. [21] analyzed the measurements with group theory and suggested that the planar and non-planar dissociation of the lower resonant state results in H- and NH decay channels respectively. They also predicted the umbrella mode of oscillation during dissociation. Later, Ram et al. [22] used VSI technique to study the angular distribution (AD) and kinetic energy (KE) distribution of fragment anions. The variation in AD of H- ions showed that electron attachment preferred particular orientation of ammonia molecule with C3 axis along the electron beam direction (from N side to H side). The presence of an umbrella mode of oscillation in lower resonant state was confirmed by the observed variation in AD of the fragment ions with kinetic energy. Using thermochemical and photo-ionization values, the authors predicted several dissociation channels with their respective threshold energies. Using the AD measurements the authors obtained the symmetry of the TNI state involved in the process as A1 and E for the lower and higher resonance respectively. Recently, Rescigno et al. [23] theoretically predicted that at lower resonance, NH ion is produced by the same H- ion dissociation channel but through an intermediate virtual state where charge is transferred adiabatically at a large internuclear distance. But, in upper resonance there is no mechanism found which is responsible for the formation of NH ion. In present case, the VSI images have been taken around those resonances to measure the kinetic energy and AD of the fragment ions. From AD measurements, symmetry of the two resonant states is determined.
2 Instrumentation
Details of the experimental setup used for velocity slice images (VSI) are present in different papers [2, 24]. In the present context we will discuss it briefly. A magnetically collimated pulsed electron beam of 10 kHz repetition rate is produced via thermionic emission process from a tungsten filament with energy resolution around 0.8 eV. This electron beam is made to interact perpendicularly with an effusive molecular beam. When low energy electrons collide with the molecules, negative ion Newton spheres are formed. These Newton spheres are projected to the micro channel plate (MCP) based two dimensional position sensitive detector (PSD) [25] by applying moderate extraction field (2 V/cm). The spectrometer is designed to maintain the velocity map imaging (VMI) condition i.e. all the ions formed in the interaction region with a given velocity will map on to a single point on the detector. AD and KE distribution of the fragment ions are obtained from the projections of the Newton spheres. The extraction pulse duration is 2 s and is applied 100 ns after the electron beam pulse. This delayed extraction provides sufficient time to expand the Newton sphere so that better time sliced images are extracted. MCP is used to detect the time-of-flight (TOF) of the fragment ions and PSD records the corresponding x and y positions. These x and y positions give momentum information along that direction and the TOF gives the z-momentum. Using CoboldPC software one can record the x and y positions with corresponding TOF for off-line analysis.
To obtain the ion-yield curve, the MCP signal is amplified by a fast amplifier (FAMP) then fed to a constant fraction discriminator (CFD). This CFD signal provides the stop signal as input to the time-to-amplitude converter (TAC). The start signal is provided by the pulse generator and is synchronized with the electron gun pulse. Time difference between the start and stop signal determines the TOF of the fragments. Output of the TAC is connected to a multichannel analyzer (MCA). Number of ions hitting the detector is measured by using MCA. Output of the hexanode signals again passes through the FAMP and CFD before it is collected by a time-to-digital converter (TDC) which is directly connected to a computer. Details of this data acquisition system are present in a different paper [26]. The aim is to find the central slice of the Newton Sphere, as it contains the kinetic energy and AD information. During off-line analysis, suitable time window is used to select the central one. In the present case 25 ns time window is used for the lower resonance whereas, 50 ns is used for the higher one. Calibration for the kinetic energy distribution measurements has been performed using the kinetic energy released by OO2 at 6.5 eV [27]. Further this energy calibration has been checked by measuring the kinetic energy of the O- ion produced by DEA to CO2 [2, 28] at 8.2 eV.
3 Angular distribution of C3v point group
The angular distribution of the DEA process is directly related to the symmetry of the TNI state. The dependence of the DEA cross-section of a diatomic molecule as a function of dissociating angle is nicely described by O’Malley and Taylor [29]. Based on their work, Azria et al. [30] expanded the expression for polyatomic molecules.
Ammonia belongs to C3v point group symmetry. A C3v point group has six symmetry operations, identity (E), rotation of 60∘ with respect to C3 axis (C3), rotation of 120∘ with respect to C3 axis (C) and three reflections about three mirror planes formed by the three NH bonds and the C3 axis. Based on the similarities of the operations, there are three symmetry states associated with the C3v point group. The symmetries are A1, A2 and E. Here A1 and A2 are one dimensional representation whereas, E is two dimensional representation. The ground state configuration of NH3 molecule is A1 so, the transition amplitude from A1 to A1, A2 and E final state transition is calculated by considering various partial waves as,
| (1) |
Here the partial wave denotes the different partial waves of the incoming electron involved in the transition. This transition amplitude squared and integrated over the azimuthal angle to obtain the variation of DEA cross-section with scattering angle
| (2) |
Dissociation occurs in the molecular frame whereas, the measurements of the angular distribution is carried out in the lab frame. So, molecular frame to lab frame transformation of the partial waves for both the incident electron beam and the electronic states is done by the Euler angles (, , 0) and (0, , 0) respectively. Here is the angle between the NH bond and the C3 axis of NH3 molecule. In general, the value of is 68.2∘, which is used in the present calculations. The character table for the C3v point group along with the symmetry states with corresponding basis functions (described by spherical harmonics) are shown in Table 1. For example, the ground state symmetry of ammonia molecule given by A1 can be expressed by the basis function Y. One can also incorporate more than one partial wave by introducing the phase factor between them. The partial wave approximation used here assumes that the axial recoil approximation is valid, i.e., the dissociation takes place on a time scale before the molecule could undergo rotation or structural changes. The expression for the A1 to A1 final state transitions with three lowest partial waves (s+p+d) and A1 to E final state transitions with two lowest partial waves are given below [31]
| I | 2C3 | 3 | Basis Function | |||||
|---|---|---|---|---|---|---|---|---|
| A1 | 1 | 1 | 1 | Yl,0 ; l = 0,1,2… | ||||
| A2 | 1 | 1 | -1 | |||||
| E | 2 | -1 | 0 | (); l=1,2,3… |
| (3) |
| (4) |
All the AD data present in this report are fitted using these two equations.
4 Results and discussion
When low energy electron collides with the NH3 molecule, then it resonantly captured by the molecule and forms one temporary negative ion state (TNI), which dissociates via three possible dissociation channels, forming three different negative ions H-, NH- and NH :
| (5) |
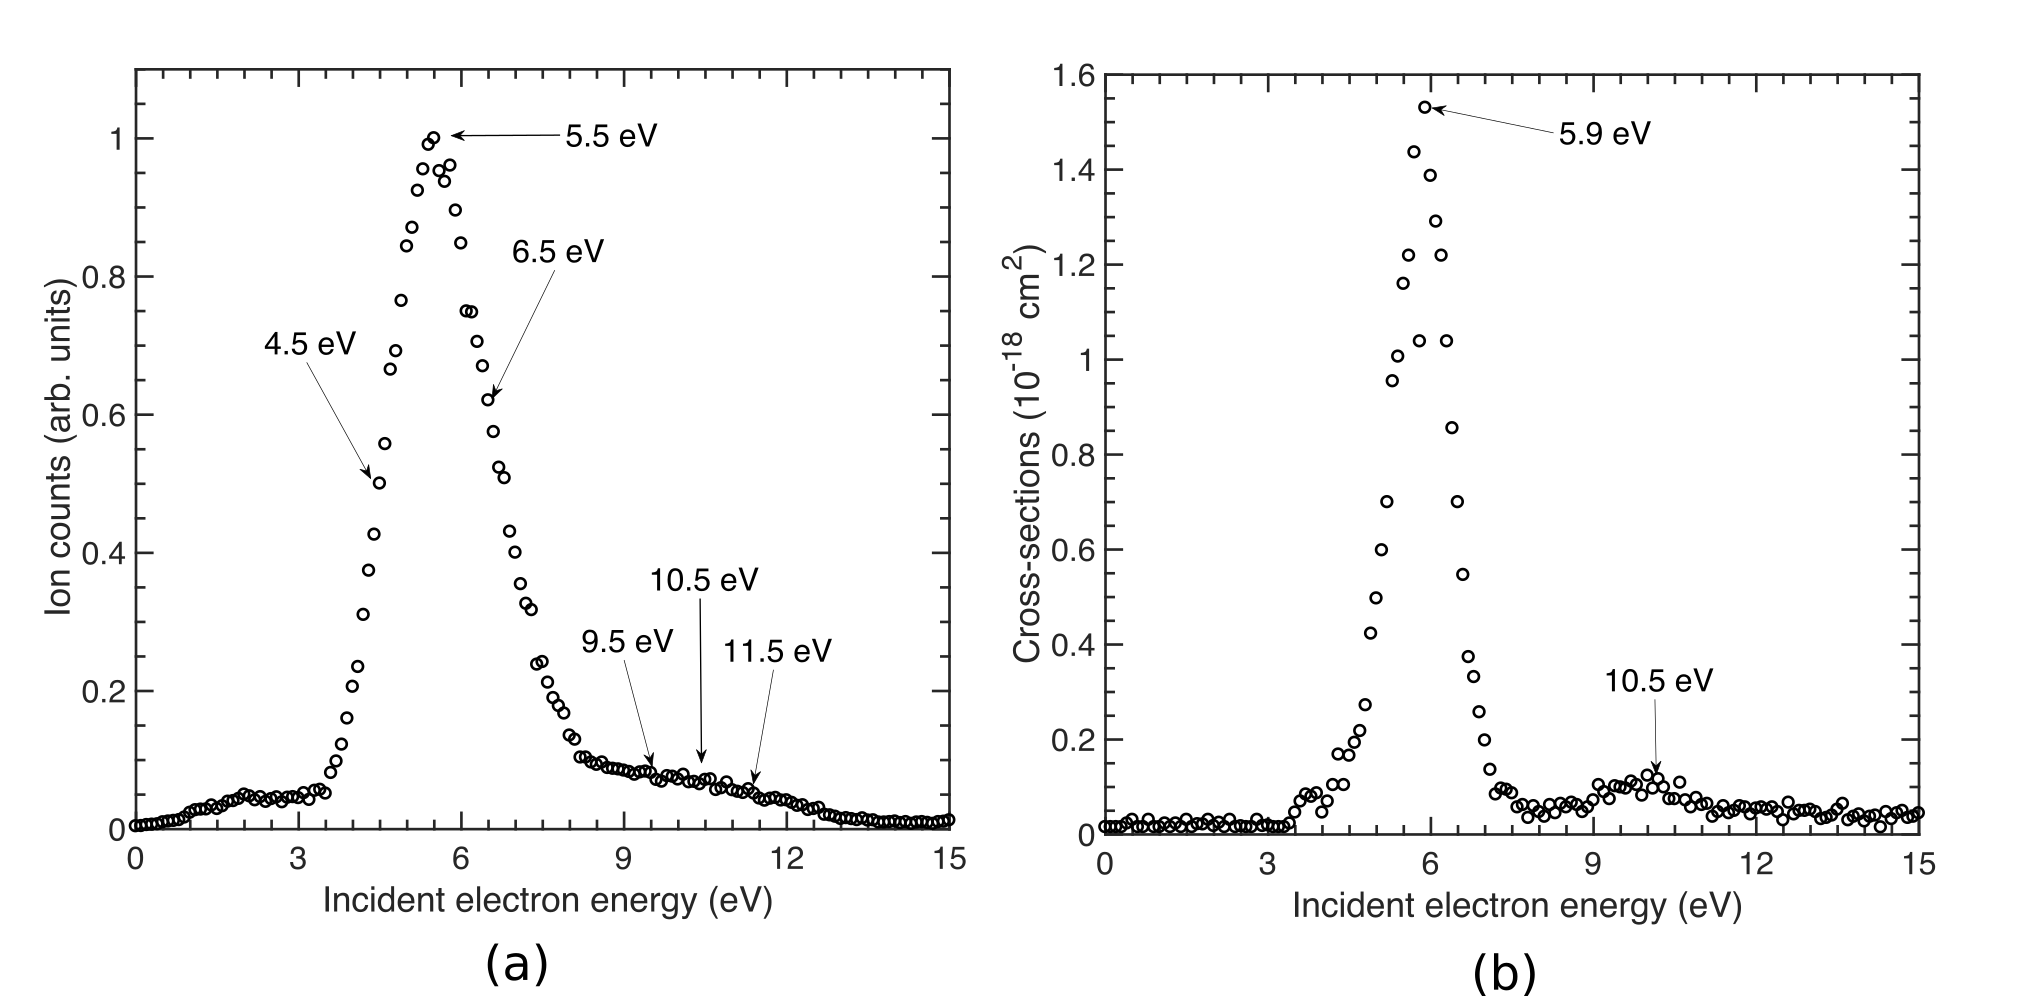
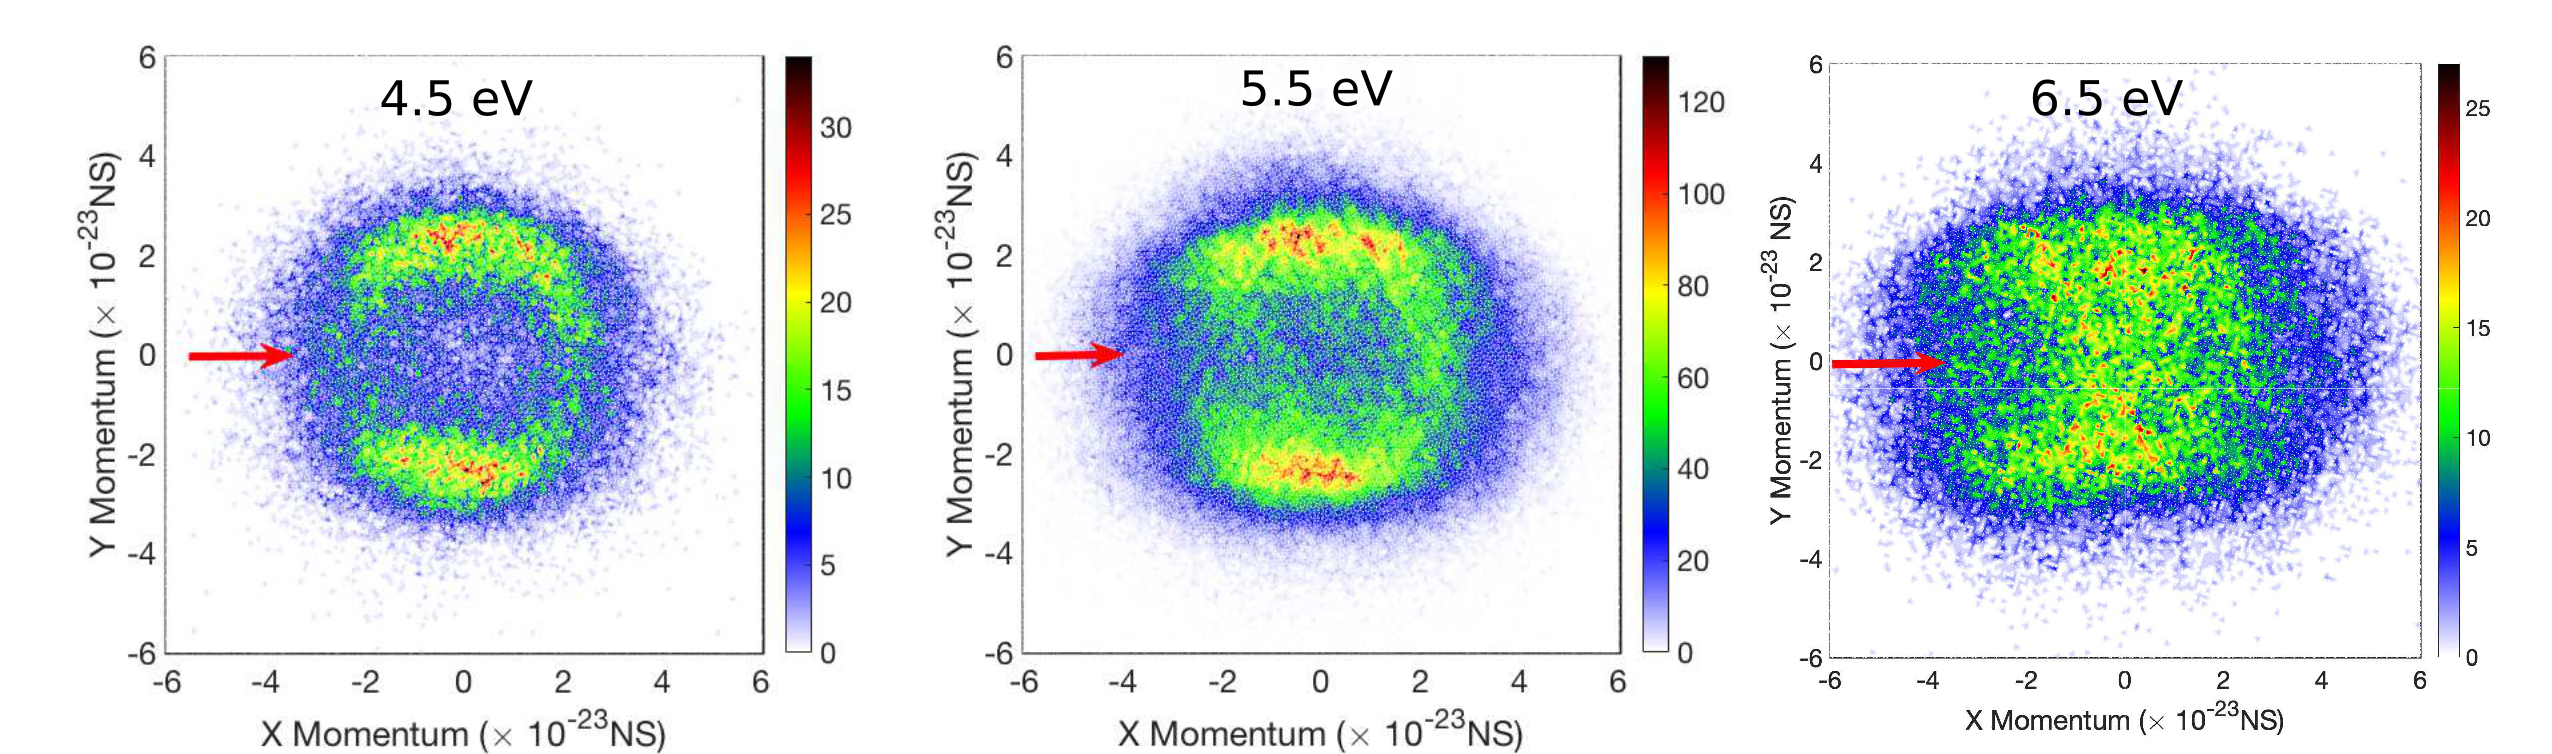
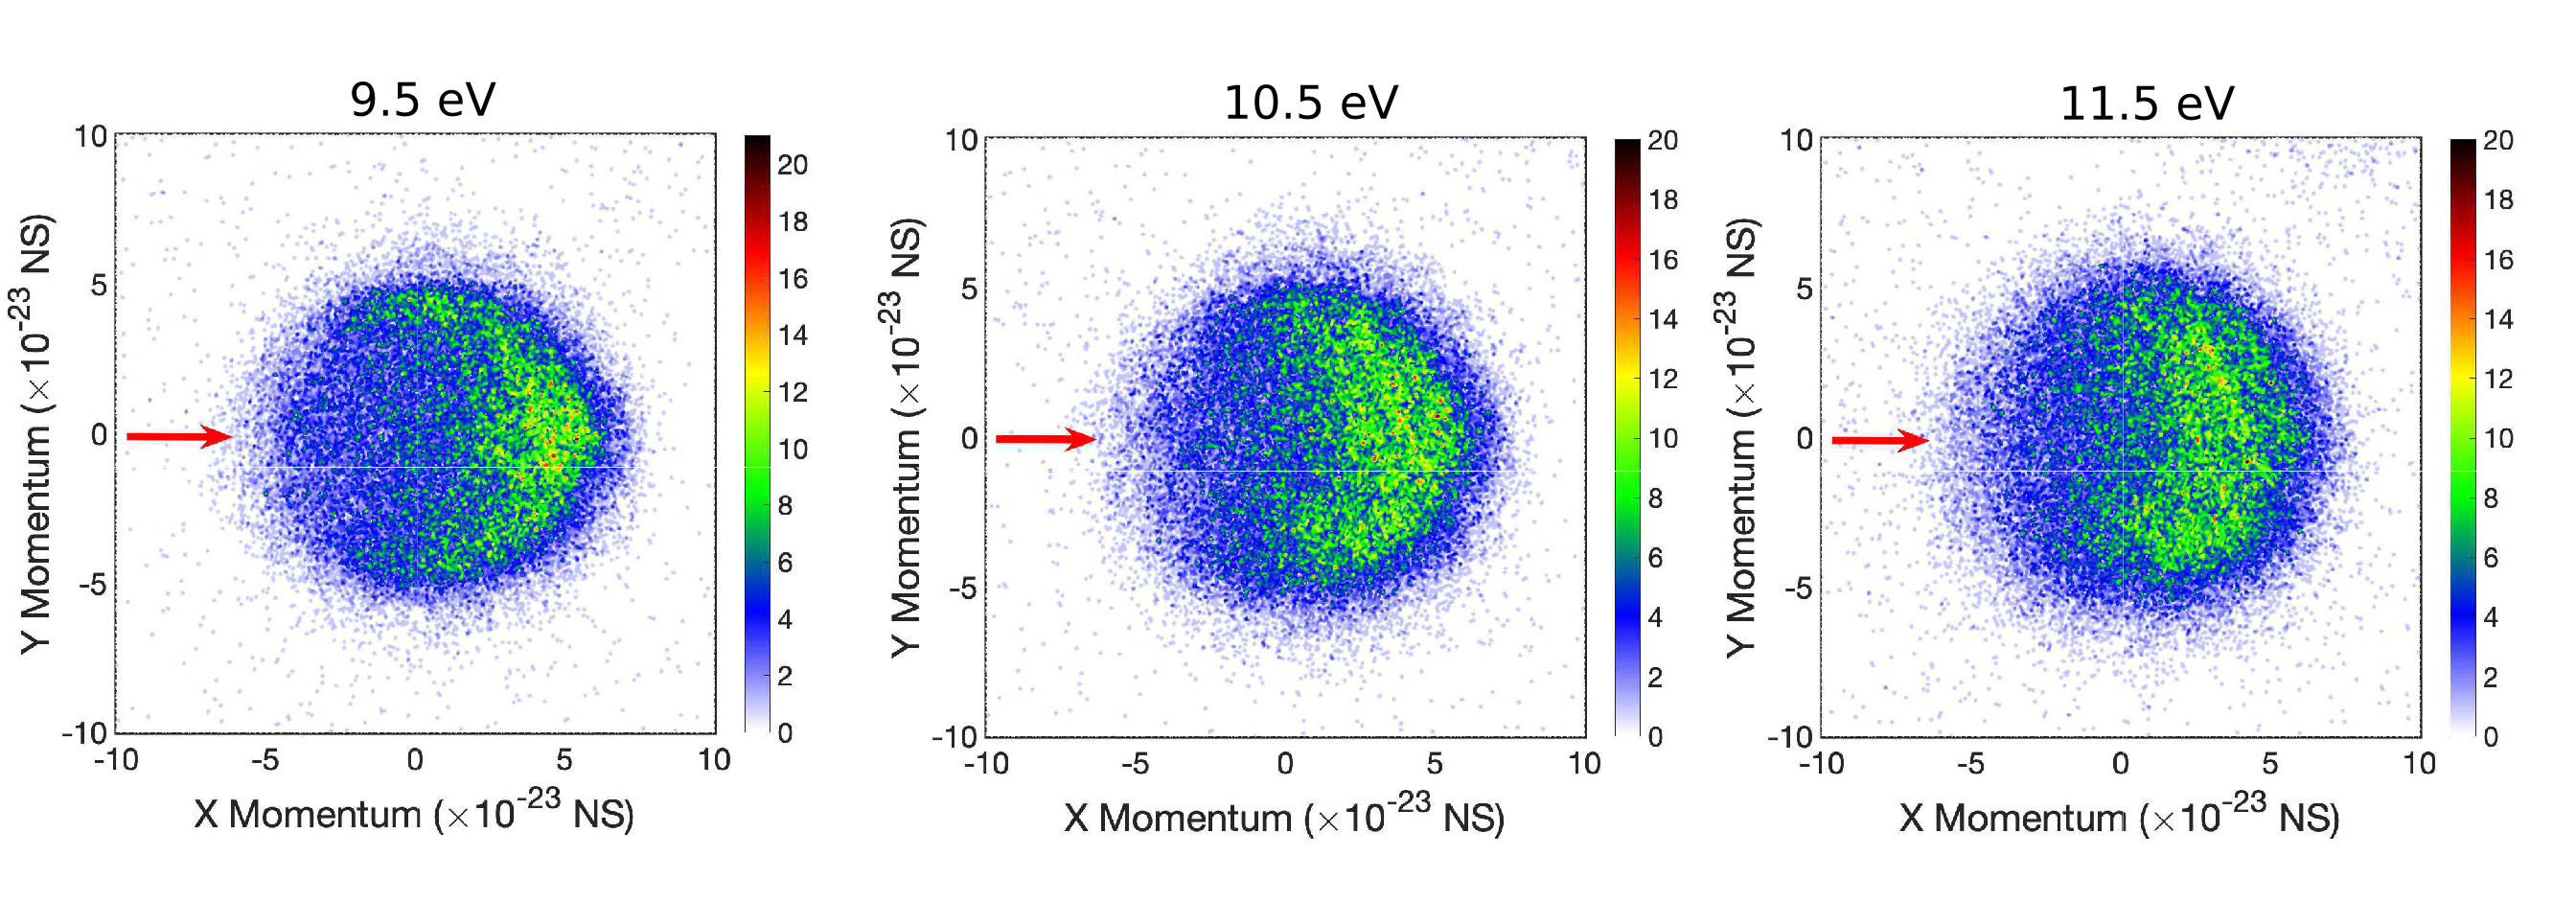
Excitation functions of NH ions obtained from DEA to NH3 are shown in Fig. 1. The ion yield curves are measured using two different spectrometers. First one is obtained from the VSI spectrometer whereas, the second one is obtained using the cross-section spectrometer [32]. In the first ion yield curve, the two resonant peaks are overlapped. The possible reason behind this observation could be the poor mass resolution of the VSI spectrometer. In higher resonance, two different fragment anions (NH- and NH), are resulting into two broad resonant peaks around 10 eV and 10.5 eV respectively [23]. In the second ion yield curve, one can observe two distinct resonant peaks which confirm the presence of temporary negative ion (TNI) states around those energies. To know the kinetic energy and AD of the fragment ions, VSI images are recorded at six different incident electron energies around the two resonances (Fig. 2 and 6). The incident electron beam axis is from left to right in each image as indicated by a red arrow. For 4.5 and 5.5 eV images (Fig. 2), one can observe two different lobes perpendicular to the electron beam direction whereas, for 6.5 eV energy the two lobes are not prominent. This indicates the possibility of a different dissociation mechanism involved at this energy. In the previous studies by Rescigno et al. [23] and Ram and Krishnakumar [22], there is a discrepancy in the 5.5 eV image. Our observation at 5.5 eV energy agreed with the Rescigno’s measurement. From the higher resonance images, one can see that the NH ions are formed mostly in the forward direction of the incident electron beam. A similar observation was made by Rescigno et al. where the authors found the H- momentum distribution and NH momentum distribution to be exact mirror images. From this observation, the authors concluded that both the fragments are produced from the same resonant state where the negative charge is transferred from the H- anion to the NH2 fragment at a large internuclear distance. The two resonances, their corresponding dissociation channels, the kinetic energy of the fragment ions and the possible symmetry of the TNI states are discussed below.
4.1 Lower resonance at 5.5 eV incident electron energy
| 4.5 eV | 5.5 eV | 6.5 | |
|---|---|---|---|
| Weighting ratio of | |||
| different partial waves | |||
| a0:a1:a2 | 0.83:1:0.11 | 1:0.1:1.31 | 1:.71:2.98 |
| Phase difference(A1) | |||
| , (rad) | 1.65, 3.0 | 1.55, 3.07 | 2.17, 1.68 |
| R2 value | 0.96 | 0.91 | 0.82 |
| Weighting ratio | Phase | Phase | R2 |
| of different | difference (A1) | difference (E) | value |
| partial waves | |||
| a0:a1:a2 | , (rad) | (rad) | |
| :b0:b1 | |||
| 0.04:1:0.32 | |||
| 0.47:0.55 | 4.46, 3.44 | 1.95 | 0.91 |
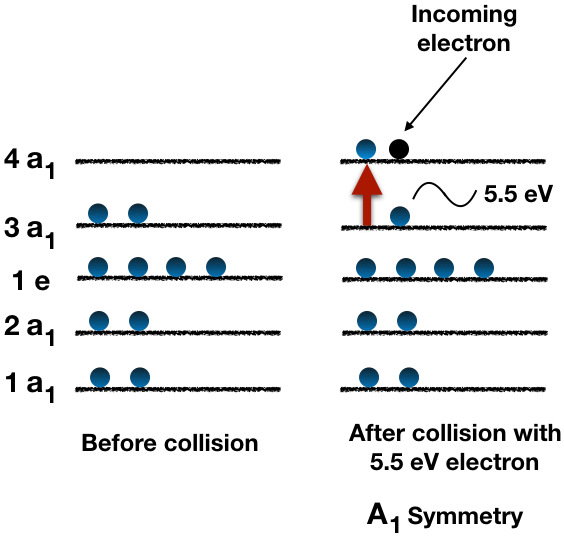
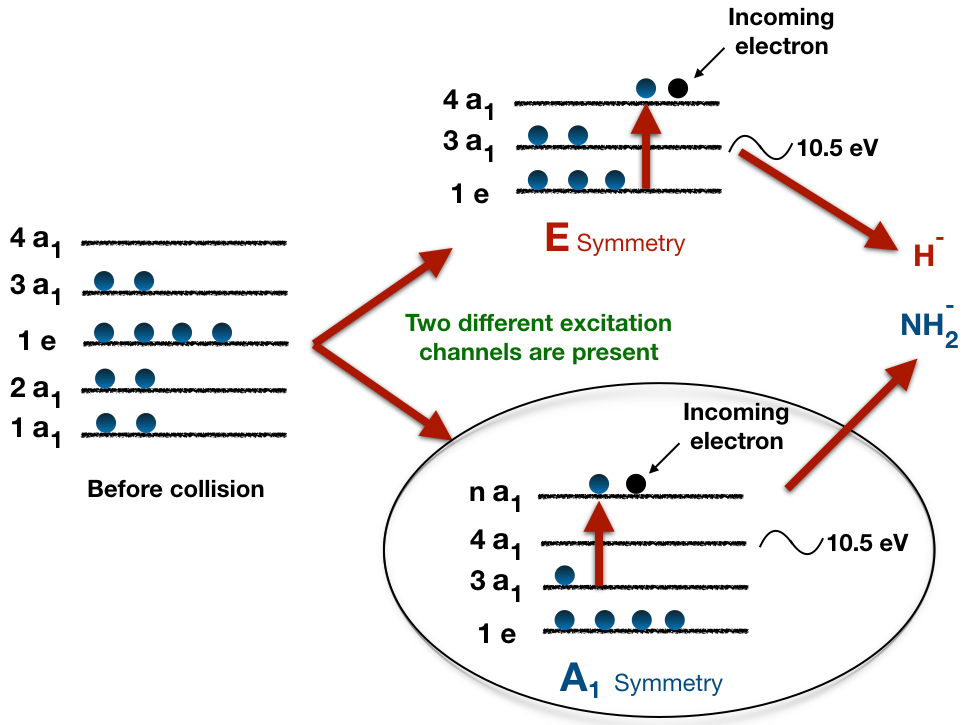
The ground state electronic configuration of ammonia molecule is 1a2a1e3a, resulting A1 symmetry. It is already documented that 5.5 eV resonance is a Feshbach resonance where the incoming electron loses its energy to excite the occupied 3a1 valence electron and simultaneously gets captured along with excited electron in the lowest unoccupied (LUMO) 4a1 orbital (Fig. 3). The dissociation channels produce both H- and NH ions [19, 22, 23] in a ratio of 6:4 as mentioned by Rescigno et al. [23]. At present we will focus on NH ion dissociation channel only.
Kinetic energy distribution
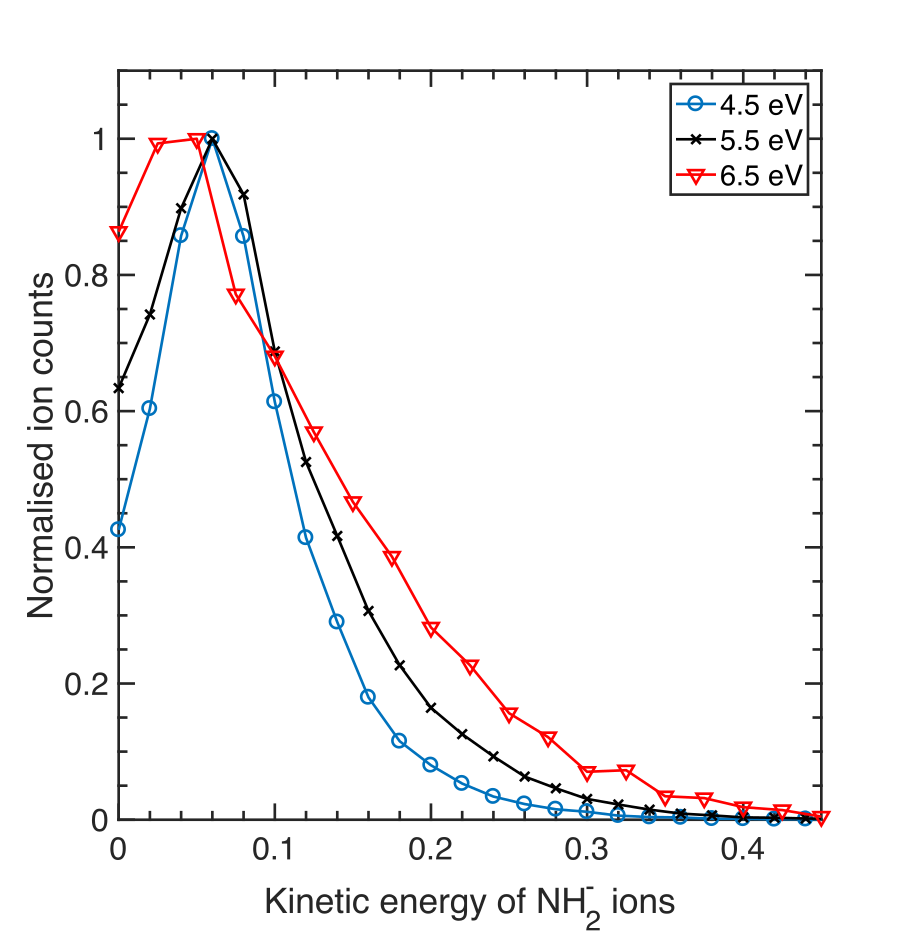
Kinetic energies of the fragment ions obtained from the VSI images are proportional to its radius. So, in order to find the distribution, one should integrate the ion counts over the entire 2 angle and plot it with respect to the energy. Fig. 4 shows the kinetic energy distribution of NH ions, where a peak around 0.06 eV is observed. The constant kinetic energy peak, which is broad in nature with increasing electron energy, reflects internal excitation of the NH and H fragments. Though, poor electron gun resolution doesn’t allow us to separate different kinetic energy bands. The experimentally obtained kinetic energy values of anions are compared with the thermochemical values derived from the given expression
| (6) |
Here is the mass of the NH fragment, M is the mass of the NH3 molecule, Ve is the incident electron energy, D is the NH2-H bond dissociation energy, A is the electron affinity of NH2 atom and E∗ is the internal energy of the H atom. From literature, D=4.60 eV [33], A= 0.77 eV [34] and if we consider the H neutral fragments formed in the ground state, then the thermodynamic threshold of the dissociation channel is 3.83 eV. This dissociation channel was previously observed by Sharp and Dowell [18] :
From Fig. 4, the NH ion kinetic energy peak can be observed at 0.06 eV for 5.5 eV resonance. Thus total kinetic energy release (KER) during the process is (total KER =17 times the kinetic energy of NH ions) 1.02 eV. This indicates that at this resonance NH ions are produced through the above mentioned dissociation channel, where the threshold is 3.83 eV.
Angular distribution
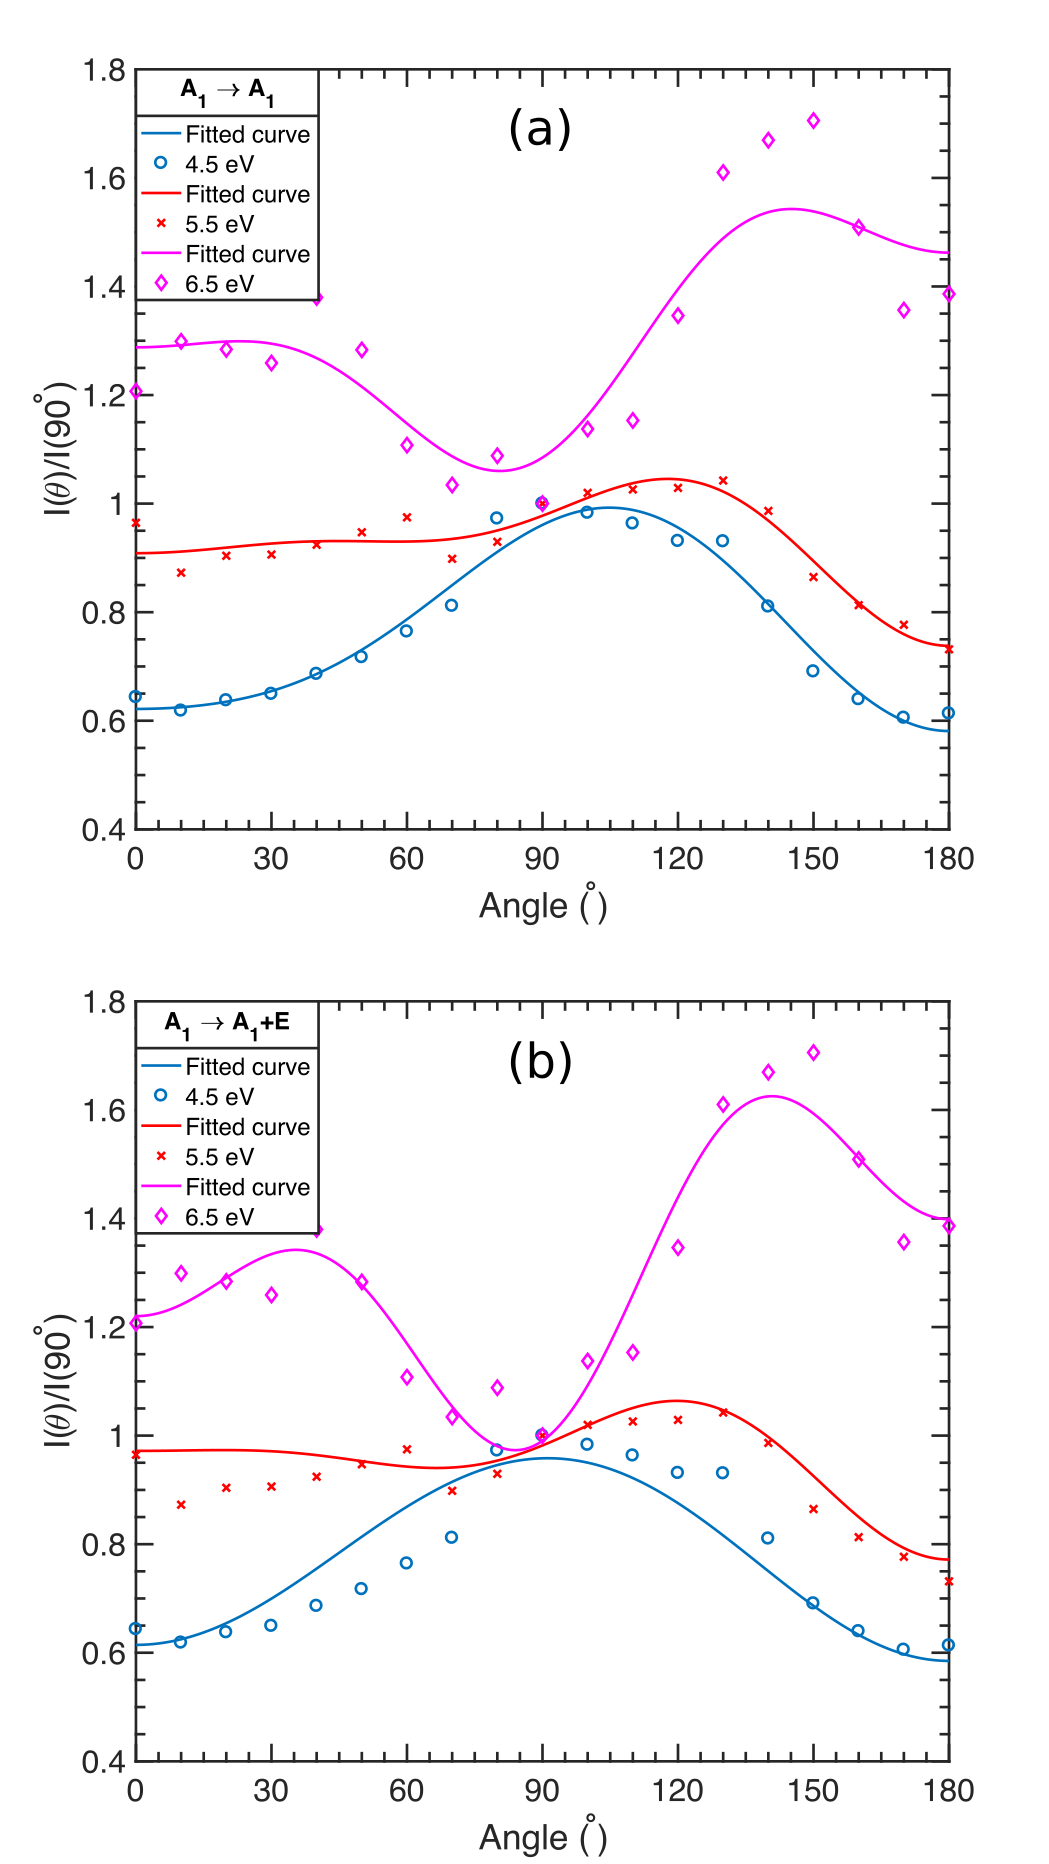
Fig. 5 shows the AD of NH ions, extracted from the VSI images for 4.5, 5.5 and 6.5 eV electron energy. For all the incident electron energies, ions with a kinetic energy range between 0-0.15 eV are considered for the AD measurements. The angle is defined with respect to the incident electron beam direction. With close inspection, one can observe that most of the ions are concentrated within 50∘ to 150∘ for all the energies. The VSI images are anisotropic and are found to be same as the LBNL and Heidelberg experimental VSI images. It was believed that in this energy region, separate dissociation channels resulting both H- and NH ions are present until Rescigno concluded that NH ions are formed due to an adiabatic charge transfer from H- to NH2 at large inter-nuclear distance, i.e., through a virtual-state channel [23]. This makes the AD of NH as the AD of H- reflected through from the electron beam axis (). We took the AD of H- from the measurements of Ram [22] and Rescigno [23] for 4.5 eV and 5.5 eV as a reference and compared it with our NH AD curve. At 4.5 and 5.5 eV energies, the AD of H- ion peaked at and respectively. Thus in the present measurements for 4.5 eV and 5.5 eV incident electron energy is equal to and , confirming the virtual-state channel. Fig. 5 also shows that when electron energy increases, backward scattering increases, which becomes more dominant at higher energy. The observed broad AD can be explained due to the umbrella mode vibration of the TNI state present in this resonance [21, 22]. The AD results can be discussed further with respect to the basic structure of ammonia molecule. It has a pyramidal shape with the N atom situated at the top and three H atoms at the base. The basic symmetry of the molecule is C3v where the C3 axis is passing through the N atom and the center of the triangle formed by the three H atom. The angle between the NH bond and the C3 axis is 68.2∘ and the 3a1 orbital which is excited during this 5.5 eV resonance has the electron density distributed up and down the N atom. Now during the dissociation of the TNI, preferential direction for the higher energetic H- ion is along the N-H bond axis. From the AD measurements it is observed that the NH ions are peaking at 120∘ direction i.e. the H- ion is at 70∘ (close to 68.2∘). This clearly implies that the preferential orientation of the ammonia molecule during the electron attachment process is along the C3 axis, from N to H direction.
To know the symmetry of the associated TNI state, the AD data is fitted with the theoretical expression as discussed in section 3. Fig. 5 (a) shows the fitted AD curve for A1 to A1 transition. It can be observed that the fitted AD curve is enough to claim that the symmetry of the resonant state involved is A1. Slight deviation is observed for the 6.5 eV energy. To investigate the possible involvement of any other symmetries, data points are fitted with A1 to AE transition model, which provides a better-fitted AD curve for 6.5 eV energy. Thus one can predict involvement of E symmetry state around 6.5 eV energy region. Expression 4 represents A1 to E transition model for the lowest two partial waves [31]. The values of different parameters used in the fit function are listed in Table 2 and Table 3 with corresponding R2 values.
4.2 Higher resonance at 10.5 eV incident electron energy
The dynamics involved in the higher resonance is not as simple as the lower one. To describe the dynamics involved in this resonance process, Ram and Krishnakumar [22] compare it with the VUV absorption and photo-electron spectrum [35, 36] of ammonia molecule where Rydberg transition occurred at 10.6 eV energy. This result leads them to think that it is a Feshbach resonance where the HOMO-1 valence 1 electron excites and simultaneously two electrons are captured in the LUMO 4a1 orbital. As a result, the symmetry of the resonance state involved in the process is E. But from the NH ion AD behavior, the authors could not find any robust signature of E symmetry in the resonant state. This contrast between the understanding and the experimental observation is described by the authors. The double degeneracy of the 1e orbital could be manifested as Jahn-Teller effects or other non-adiabatic effects which lead to the rapid distortion of the molecular geometry. As a result, the AD data does not clearly reflect the E symmetry involved in the process. Now, if the distortion of the molecular geometry is the reason, then both H- and NH AD shouldn’t reflect the E symmetry. But, their H- AD reflects the involvement of E symmetry at the same resonance energy. Later, in the theoretical study by Rescigno et al. [23], it was found that axial recoil approximation breakdown is less severe in this resonance as there is no barrier to direct dissociation. In their experimental and theoretical study, the authors confirmed that H NH2 dissociation channel occurs due to the involvement of 2E symmetry state which is in agreement with the present understanding. But they are unable to locate any dissociation channel resulting to NH ions if the symmetry of the TNI state is E. Hence they termed the presence of the NH ions in the upper resonance state as a mystery. So, the dynamics of the upper resonance state in ammonia is still an open question with its symmetry and possible dissociation channels. To address this problem, we took the study of resonance enhanced multi-photon ionization (REMPI) spectrum obtained by Langford et al. [37]. Here the authors found a 1a5pa Rydberg transition to occur within the energy range 9.5 to 10.1 eV. The authors represent the states in Cs symmetry and the A2 state in Cs symmetry will be either A1 or E symmetry on making a comparative solution comparing the point group Cs to C3v. This Rydberg state can be a parent state for the Feshbach resonance that occurred within this energy region. As a consequence one electron from the valence 3 a1 is excited to a higher a1 orbital and captured along with the incoming electron. As a result, the symmetry of the TNI state will be A1, which can be a parent state for the NH dissociation channel. Our experimental observation clearly shows the involvement of A1 symmetry in this resonance.
Kinetic energy distribution
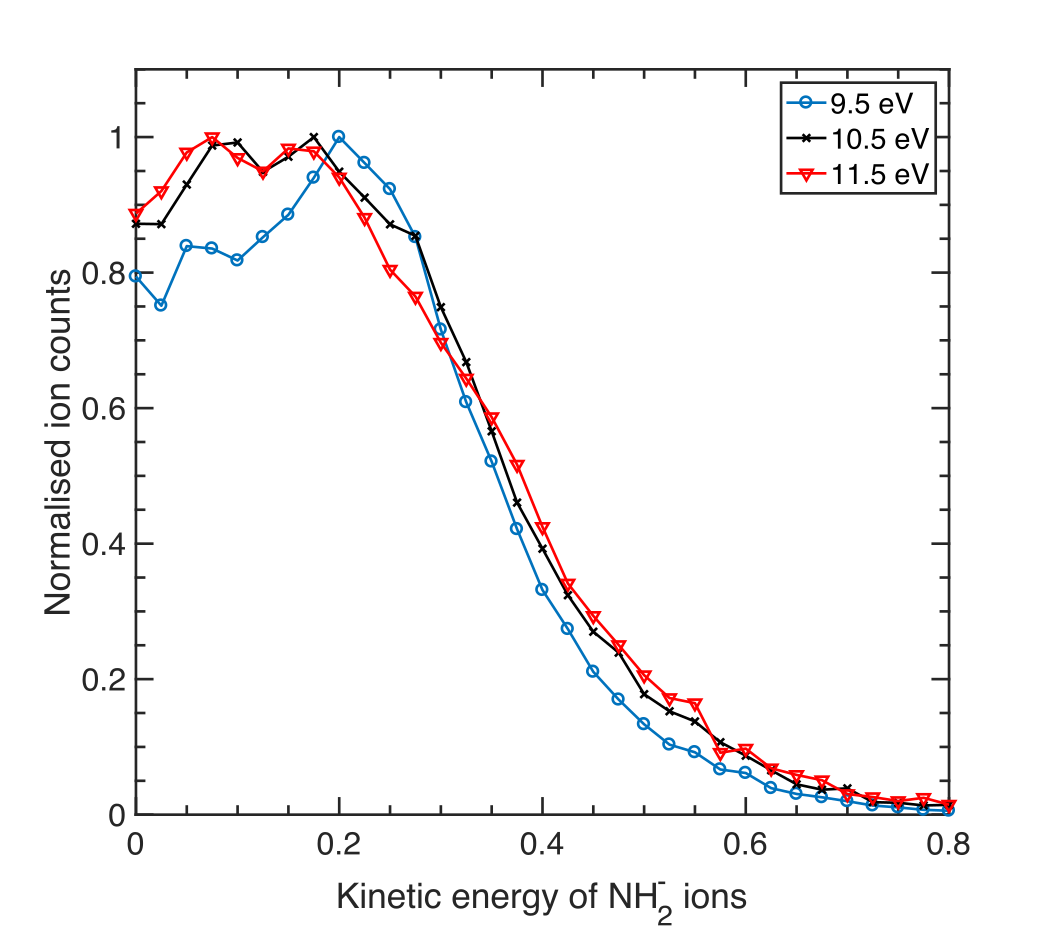
Fig. 7 represents the kinetic energy distribution of the fragment ions formed around 10.5 eV resonance energy. For 9.5, 10.5 and 11.5 eV, one small peak at around 0.2 eV is observed. The broad distribution can be in due to the internal excitation of the NH ions. Sharp and Dowell [18] speculated that NH ion produced in this energy range is in its first electronically excited state. Though, dissociation channels for ground state NH ions were also predicted in this resonance energy [22]. By using the thermochemical values in Equation (6), the maximum kinetic energy for ground state NH ion is found to be 0.4 eV. But observed maximum kinetic energy, in this case, is about 0.55 eV, which is within the electron gun energy resolution range. Another possible contribution to kinetic energy distribution is due to the presence of NH- ions. With respect to this, if NH- ions are formed with 0.2 eV kinetic energy, total kinetic energy release by the process will be 1.7 eV. This clearly indicates the presence of H + H + NH-() channel, whose thermodynamic threshold is 8.08 eV [22]. Thus from kinetic energy measurements, one can predict the presence of a three-body dissociation channel in this resonance however, due to poor mass resolution capability of the VSI spectrometer we are unable to separate NH- and NH fragments.
Angular distribution
| 9.5 eV | 10.5 eV | 11.5 | |
|---|---|---|---|
| Weighting ratio of | |||
| different partial waves | |||
| a0:a1:a2 | 2:1:0.84 | 1.36:1:0.97 | 0.70:1:1.36 |
| Phase difference(A1) | 0.34,2.37 | 0.61,1.60 | 0.74,1.45 |
| , (rad) | |||
| R2 value | 0.95 | 0.97 | 0.93 |
| Weighting ratio | Phase | Phase | R2 |
| of different | difference (A1) | difference (E) | value |
| partial waves | |||
| a0:a1:a2 | , (rad) | (rad) | |
| :b0:b1 | |||
| 0.9:1:0.18 | |||
| :0.6:0.01 | 0.54, 3.08 | 0.03 | 0.98 |
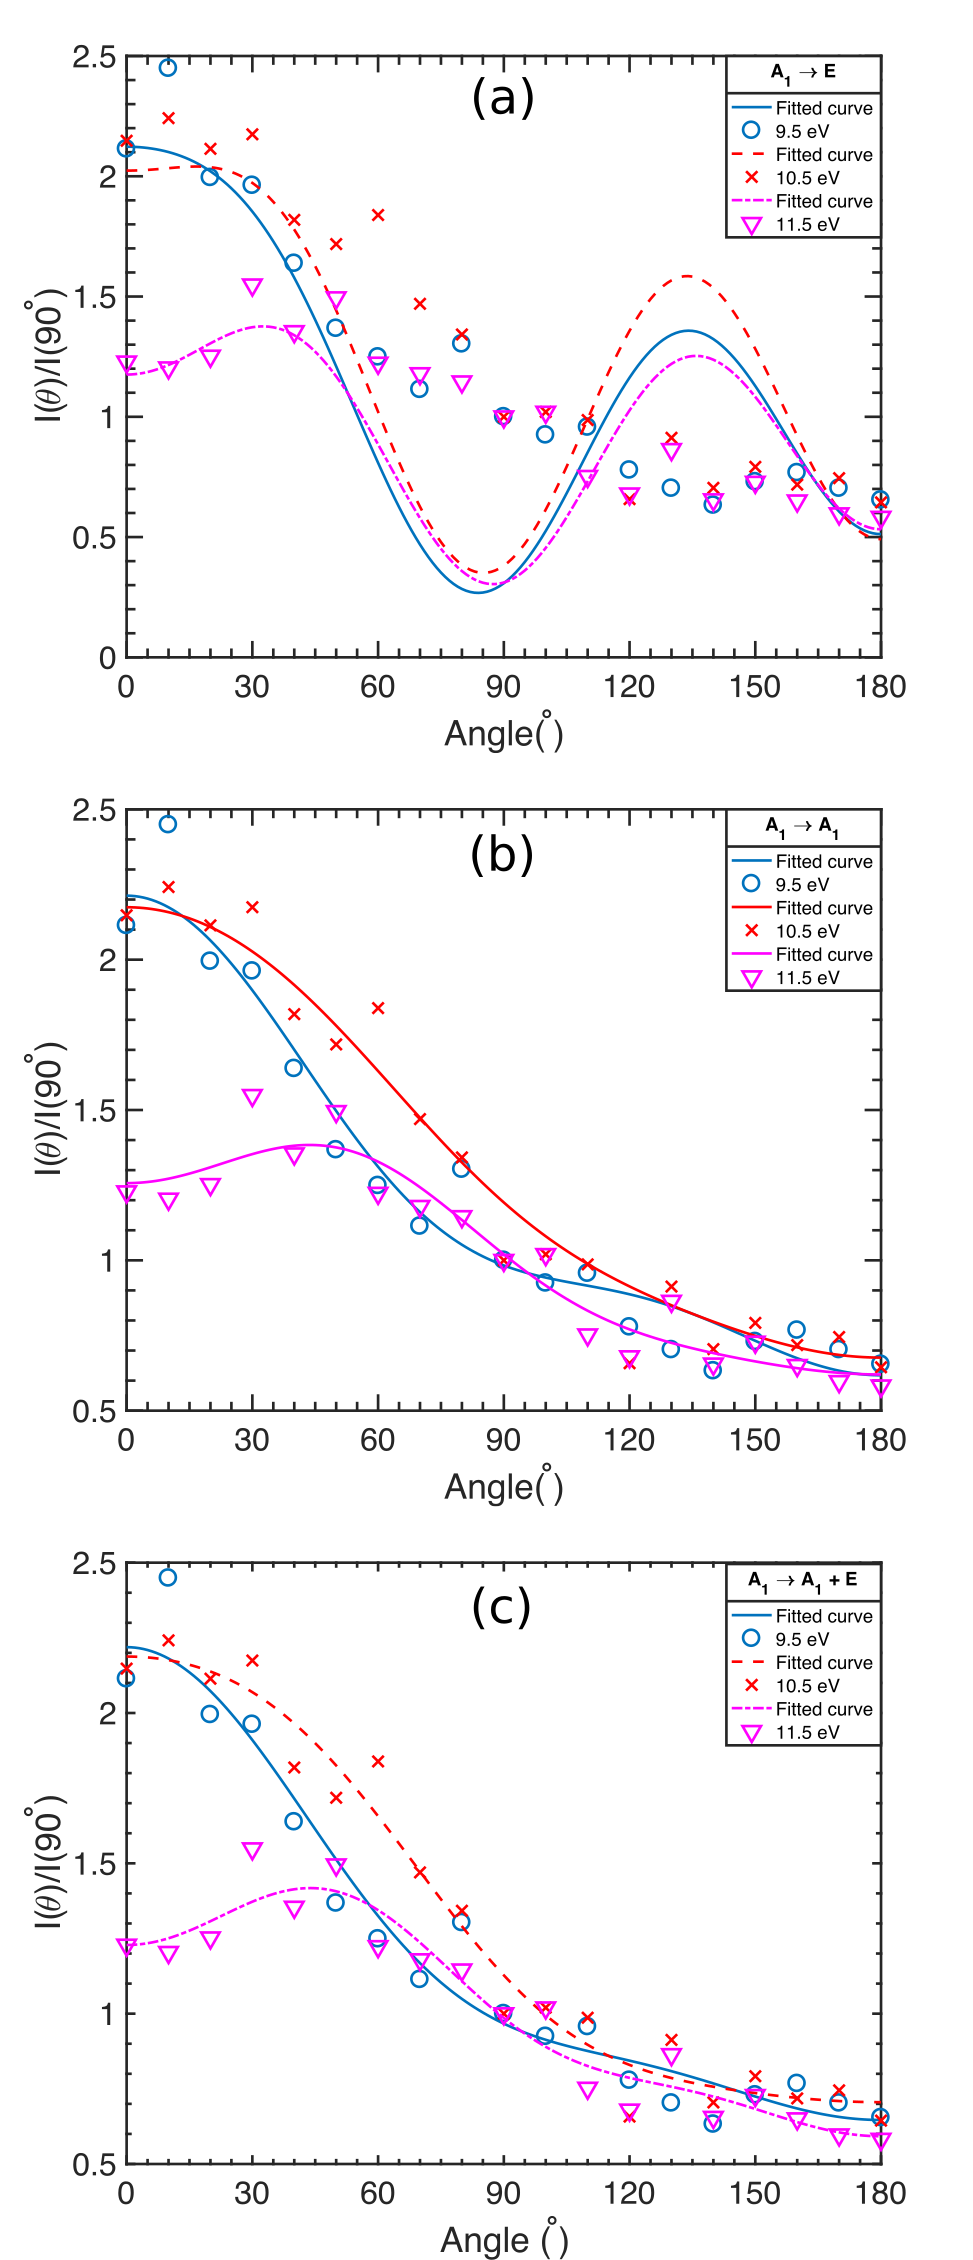
To know the symmetry of the associated resonance state, AD of the NH ions is extracted from the VSI images. From the AD data it can be observed that for 9.5 and 10.5 eV energies, most of the ions are formed in the forward direction. The AD data is fitted with the procedure as discussed in Section 3. Following the same procedure, we fit our AD data for A A1, A E and A AE final state transition.
The results for the A E and A A1 final state transitions are shown in Fig. (8a) and (8b). Here the lowest two partial waves for E final state transition and lowest three partial waves for A1 final state transition are considered because the contributions of the higher partial waves are increasingly small. From the fitted AD curve, it is clear that A E transition is inadequate to reflect the symmetry of the TNI state whereas, A A1 final state transition gives us a better fit with good R2 value (over 0.9) which clearly indicates that A1 state is present in this resonance. From the current experimental understanding and from the previous studies we propose that two closely lying resonant states with symmetry A1 and E are present within this 10.5 eV resonance. The H- ions are formed due to the E symmetry state whereas, the NH ions contribution came mainly due to the A1 symmetry state. It will be interesting to see whether the A1 symmetry is also responsible for the H- ions. But with the current experimental facilities, it is not possible to detect the H- ions. The fitted AD data for AA E final state transition is also shown in Fig. (8c), which is almost the same as Fig. (8b). Hence the E state contribution can be ruled out. Only for 9.5 eV energy, slightly better-fitted AD curve is observed for A AE transition. This little contribution from E state can be in due to the presence of NH- ions via three body dissociation process, which is possible in this energy region. The fitting parameters for AA1 and AAE transition are given in Table 4 and 5. Theoretical calculations by Dr. P. C. Minaxi Vinodkumar (private communications) confirms the presence of A1 and/or E state around 10.2 eV energy region which, further supports our conclusion [38]. It is to be mentioned here that, the dissociation dynamics of ammonia molecule in higher resonance is complex. When the Rydberg transition occurs, the NH3 molecule no longer holds the C3v symmetry. So the resonance starts with a C3v geometry before it goes to some other symmetry. A high-level time-dependent theoretical calculation is imperative to understand the dynamics properly.
5 Conclusion
Complete DEA dynamics of ammonia molecule is studied using VSI technique. Two resonances around 5.5 eV and 10.5 eV are observed. The VSI images of NH fragment ions are measured around the 5.5 eV and 10.5 eV resonance energies. KE distribution and AD of the NH ions are extracted from the slice images. From the KE and AD measurements, we reconfirm the presence of A1 symmetry in the 5.5 eV resonance energy. KE distribution of the 10.5 eV resonance indicates the involvement of three body dissociation process. Our AD measurements clearly indicates the presence of A1 symmetry state in the 10.5 eV resonance.
6 Acknowledgements
D. N. gratefully acknowledges the partial financial support from “Science and Engineering Research Board (SERB)” under the project No. “EMR/2014/000457”. DC is thankful to IISER Kolkata for providing research fellowship.
References
- [1] P. Nag and D. Nandi, Phys. Chem. Chem. Phys. 17, 7130 (2015).
- [2] P. Nag and D. Nandi, Phys. Rev. A 91, 052705 (2015).
- [3] F. H. Ómarsson, E. Szymanska, N. J. Mason, E. Krishnakumar, and O. Ingólfsson, Phys. Rev. Lett. 111, 063201 (2013).
- [4] E. Illenberger and J. Momigny, Gaseous Molecular Ions: An Introduction to Elementary Processes Induced by IonizationTopics in Physical Chemistry (Steinkopff, 2013).
- [5] B. Boudaı˝̈ffa, P. Cloutier, D. Hunting, M. A. Huels, and L. Sanche, Science 287, 1658 (2000).
- [6] A. Keller et al., Sci. Rep. 4, 7391 EP (2014).
- [7] E. Alizadeh, T. M. Orlando, and L. Sanche, Annu. Rev. Phys. Chem. 66, 379 (2015).
- [8] X. Luo, Y. Zheng, and L. Sanche, J. Chem. Phys. 140, 155101 (2014).
- [9] X. Pan, P. Cloutier, D. Hunting, and L. Sanche, Phys. Rev. Lett. 90, 208102 (2003).
- [10] H. Abdoul-Carime, P. Cloutier, and L. Sanche, Radiat. Res. 155, 625 (2001).
- [11] D. Antic, L. Parenteau, M. Lepage, and L. Sanche, J. Phys. Chem. B 103, 6611 (1999).
- [12] B. Liu, P. Hvelplund, S. Brøndsted Nielsen, and S. Tomita, J. Chem. Phys. 121, 4175 (2004).
- [13] V. Rangroo Thrane et al., Nat. Med. 19, 1643 EP (2013).
- [14] A. Cheung, D. M. Rank, C. H. Townes, D. D. Thornton, and W. J. Welch, Phys. Rev. Lett. 21, 1701 (1968).
- [15] J. A. Nuth, III, S. B. Charnley, and N. M. Johnson, Meteorites and the Early Solar System II (, 2006).
- [16] R. Briggs et al., Orig. Life Evol. Biosph. 22, 287 (1992).
- [17] G. M. Muñoz Caro et al., Nature 416, 403 EP (2002).
- [18] T. E. Sharp and J. T. Dowell, J. Chem. Phys. 50, 3024 (1969).
- [19] R. Compton, J. A. Stockdale, and P. W. Reinhardt, Phys. Rev. X 180, 111 (1969).
- [20] P. Rawat et al., J Phys: Conf. Ser. 80, 012018 (2007).
- [21] K. L. Stricklett and P. D. Burrow, J. Phys. B 19, 4241.
- [22] N. B. Ram and E. Krishnakumar, J. Chem. Phys. 136, 164308 (2012).
- [23] T. N. Rescigno et al., Phys. Rev. A 93, 052704 (2016).
- [24] D. Chakraborty, P. Nag, and D. Nandi, Phys. Chem. Chem. Phys. 18, 32973 (2016).
- [25] O. Jagutzki et al., IEEE Trans. Nucl. Sci. 49, 2477 (2002).
- [26] P. Nag and D. Nandi, Meas. Sci. Technol. 26, 095007 (2015).
- [27] D. Nandi and E. Krishnakumar, Int. J. Mass Spectrom. 289, 39 (2010).
- [28] D. S. Slaughter et al., J. Phys. B: At. Mol. Opt. Phys. 44, 205203.
- [29] T. F. O’Malley and H. S. Taylor, Phys. Rev. 176, 207 (1968).
- [30] R. Azria, Y. L. Coat, G. Lefevre, and D. Simon, J. Phys. B 12, 679.
- [31] N. B. Ram, Dissociation dynamics in polyatomic molecules due to electron attachmentPh.D thesis, Tata Institute of Fundamental Research (, 2010).
- [32] D. Chakraborty, P. Nag, and D. Nandi, Rev. Sci. Instrum. 89, 025115 (2018).
- [33] D. H. Mordaunt, M. N. R. Ashfold, and R. N. Dixon, J. Chem. Phys. 104, 6460 (1996).
- [34] C. T. Wickham‐Jones, K. M. Ervin, G. B. Ellison, and W. C. Lineberger, J. Chem. Phys. 91, 2762 (1989).
- [35] A. D. Walsh and P. A. Warsop, Trans. Faraday Soc. 57, 345 (1961).
- [36] M. B. Robin, Higher excitedd states of polyatomic molecules (Vol. 1) (Academic, 1974).
- [37] S. R. Langford et al., J. Chem. Phys. 108, 6667 (1998).
- [38] P. C. M. Vinodkumar, Private communications .