PTrix: Efficient Hardware-Assisted Fuzzing for COTS Binary
Abstract.
Despite its effectiveness in uncovering software defects, American Fuzzy Lop (AFL), one of the best grey-box fuzzers, is inefficient when fuzz-testing source-unavailable programs. AFL’s binary-only fuzzing mode, QEMU-AFL, is typically 2-5 slower than its source-available fuzzing mode. The slowdown is largely caused by the heavy dynamic instrumentation.
Recent fuzzing techniques use Intel Processor Tracing (PT), a light-weight tracing feature supported by recent Intel CPUs, to remove the need of dynamic instrumentation. However, we found that these PT-based fuzzing techniques are even slower than QEMU-AFL when fuzzing real-world programs, making them less effective than QEMU-AFL. This poor performance is caused by the slow extraction of code coverage information from highly compressed PT traces.
In this work, we present the design and implementation of PTrix, which fully unleashes the benefits of PT for fuzzing via three novel techniques. First, PTrix introduces a scheme to highly parallel the processing of PT trace and target program execution. Second, it directly takes decoded PT trace as feedback for fuzzing, avoiding the expensive reconstruction of code coverage information. Third, PTrix maintains the new feedback with stronger feedback than edge-based code coverage, which helps reach new code space and defects that AFL may not.
We evaluated PTrix by comparing its performance with the state-of-the-art fuzzers. Our results show that, given the same amount of time, PTrix achieves a significantly higher fuzzing speed and reaches into code regions missed by the other fuzzers. In addition, PTrix identifies 35 new vulnerabilities in a set of previously well-fuzzed binaries, showing its ability to complement existing fuzzers.
1. Introduction
Fuzz-testing, or fuzzing, is an automated software testing technique for unveiling various kinds of bugs in software. Generally, it provides invalid or randomized inputs to programs with the goal of discovering unhandled exceptions and crashes. This easy-to-use technique has now become the de facto standard in the software industry for robustness testing and security vulnerability discovery.
Among all the fuzzing tools, American Fuzzy Lop (AFL) requires essentially no a-priori knowledge to use and can handle complex, real-world software (lcamtuf, 2005). Therefore, AFL and its extensions have been widely adopted in practice, constantly discovering unknown vulnerabilities in popular software packages (such as nginx, OpenSSL, and PHP).
A major limitation of AFL is its low speed in fuzzing source-unavailable software. Given a commercial off-the-shelf (COTS) binary, AFL needs to perform a black box on-the-fly instrumentation using a customized version of QEMU running in the “user space emulation” mode. Despite the optimizations (Bellard, 2005), QEMU still incurs substantial overhead in this mode and thus slows down AFL’s binary-only fuzzing. According to the AFL white paper (afl, 2014), AFL gets decelerated by 2 - 5 in this QEMU-based mode, which is significant enough to make AFL much less used for binary-only fuzzing.
Previous research primarily focused on improving AFL’s code coverage so that it could potentially find more bugs. To the best of our knowledge, only a few works aimed to improve the efficiency/speed of AFL (Schumilo et al., 2017; Xu et al., 2017; hon, 2015). Since quickly identifying software flaws can expedite patches and narrow exploit windows of vulnerabilities, the goal of this work is to improve AFL’s efficiency at uncovering bugs in COTS binaries.
Unlike the prior work that achieves efficiency improvement through syscall re-engineering (Xu et al., 2017), we propose a new fuzzing mechanism utilizing a recent hardware tracing feature, namely Intel PT (int, 2013), to enhance the performance of binary-only fuzzing. We design and develop PTrix, an efficient hardware-assisted fuzzing tool. The intuition of using PT to accelerate fuzzing is as follows. The success of AFL is largely attributable to the use of code coverage as feedback. To obtain code coverage information, AFL traces the program execution with QEMU, which incurs significant overhead. Alternatively, Intel PT can trace program execution on the fly with negligible overhead. By replacing QEMU with lightweight hardware tracing, we can improve the efficiency for binary-only fuzzing.
Intel PT stores a program execution trace in the form of compressed binary packets. To implement PTrix, an instinctive reaction (Schumilo et al., 2017) is to sequentially trace the program execution, decode the binary packets, and translate them into code coverage that AFL needs as feedback. We refer to this implementation as Edge-PT. However, as we demonstrate in Section 5, Edge-PT introduces significant run-time overhead to fuzzing and does not actually benefit binary-only fuzzing with efficiency improvement. This is due to the fact that binary packet decoding and code translation both incur high computation cost.
To address the above issue, we first introduce a parallel, elastic scheme to parse a PT trace. This scheme mounts a concurrent thread to process the execution trace in parallel with the target program execution. Due to a hardware restriction, the boundary of the execution trace can only be updated when PT is paused. This frequently defers the parsing thread until the next boundary update which may arrive after termination of the target program. To overcome this limitation, our scheme leverages an elastic approach to automatically adjust the time window of target program execution (as well as PT tracing). Our approach ensures that the trace boundary gets safely and timely updated and the parsing thread are used efficiently.
Despite the above parallel scheme, we still observe that the parsing thread frequently and dramatically falls behind the program execution. The major cause is the aforementioned high cost of code coverage reconstruction. To this end, we replace the code-coverage feedback used by AFL with a newly invented PT-friendly feedback mechanism. Our mechanism directly encodes the stream of PT packets as feedback. This makes PTrix no longer need to perform code coverage reconstruction, which ultimately enables the parsing thread to accomplish its job almost at the same time as the target program finishes executing on the fuzzing input. Facilitated by these new designs, PTrix executes 4.27x faster than AFL running in QEMU mode.
Functionality wise, our new feedback does not reduce the guidance that code coverage can provide. In essence, the stream of PT packets keeps track of the execution paths, which carries not only information about code coverage but also orders and combinations among code block transitions. This means our new feedback is inclusive of that used by AFL. As we demonstrate in Section 5, our feedback allows PTrix to cover code space quicker, explore code chunks that would otherwise have not been touched, and follow through long code paths to unveil deeply hidden bugs. By the time of writing, PTrix has identified 35 previously unknown security defects in well-fuzzed programs.
We note that this work is not the first that applies Intel PT to fuzz testing (Schumilo et al., 2017; hon, 2015; win, 2017). To the best of our knowledge, PTrix, however, is the first work that explores Intel PT to accelerate fuzzing. Going beyond the higher efficiency it brings, PTrix also exhibits better fuzzing effectiveness and new ability to find unknown bugs. While our prototype of PTrix is built upon Linux on x86 platform, our design can be generally applied to other operating systems across various architectures which also support hardware-assisted execution tracing.
In summary, this paper makes the following contributions.
-
•
We explored Intel PT and utilized it to design an efficient hardware-assisted fuzzing mechanism to improve efficiency and effectiveness for binary-only fuzzing.
-
•
We prototyped our proposed fuzzing mechanism with PTrix on Linux and compared it with other fuzzing techniques, demonstrating it can accelerate a binary-only fuzzing task for about 4.27.
-
•
We devised a rigorous evaluation scheme and showed: (i) Intuitively applying PT does not produce an efficient binary-compatible fuzzer; (ii) PTrix not only improves fuzzing efficiency but also has the potential to explore deeper program behaviors. As of the preparation of this paper, PTrix has identified 35 unknown software bugs, 11 of them have CVE IDs assigned.
2. Background
Recall that we build PTrix on top of AFL through Intel PT with the goal of improving efficiency and effectiveness for fuzzing. In this section, we describe the background of AFL and that of Intel PT.
2.1. American Fuzzy Lop
AFL consists of two main components – an instrumentor and a fuzzer. Given a target program, the instrumentor performs program instrumentation by assigning an ID to each basic block (BB) and inserting a routine at the entry site of that BB. With the routine along with the ID tied to each BB, the fuzzer follows the workflow below to interact with the target program and perform continuous fuzz testing.
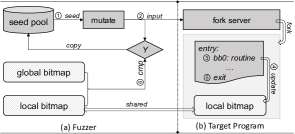
As is illustrated in Figure 1, the fuzzer starts a fuzzing round by scheduling a seed from the pool (①). It then mutates this seed via approaches such as bit-flip to produce new test cases. Using each of these test cases as input, the fuzzer launches the target program (②). With the facilitation of the routine instrumented, the target program computes hit counts pertaining to the edge indicated by each pair of consecutively executed BBs (③) and stores this information to a local bitmap (④). As depicted in Figure 1, the local bitmap is in a memory region shared by the target program and the fuzzer.
As is shown in the figure, when the execution of the target program is terminated (⑤), the fuzzer measures the quality of the input by comparing the information held in the local bitmap with that in the global one (⑥). To be more specific, it examines whether there exists new coverage that has not yet been observed in the global bitmap. By new coverage, it means the edges or the hit counts tied to the edges that have not yet been observed in previous fuzzing rounds. For the new coverages identified, the fuzzer includes them into the global bitmap and then appends the corresponding input to The fuzzer would then select a new seed for the consecutive rounds of fuzz testing.
To improve the efficiency, as is illustrated in Figure 1, AFL also introduces a fork server mode (for, 2014), where the target program goes through execve() syscall and the linking process and then turns to a fork server. Then for each round of fuzz testing, the fuzzer clones a new target process from the copy-on-write fork server that is perpetually kept in a virgin state. With this design, AFL could avoid the overhead incurred by heavy and duplicate execution prefix, and thus significantly expedite the fuzzing process.
The aforementioned description indicates how AFL works on source-available programs. In the situation where source code is unavailable, the aforementioned technique, however, cannot be directly applied to a target program because binary instrumentation could potentially introduce unexpected errors. To address this issue, AFL performs dynamic instrumentation using the user-mode emulator of QEMU. Technically, this design does not vary the fuzzer component residing in AFL. As a result, a binary-only fuzzing process still follows the workflow depicted in Figure 1. More details could be referred to at (afl, 2014).
2.2. Intel Processor Tracing
Intel PT is a low-overhead hardware feature available in recent Intel processors (e.g., Skylake series). It works by capturing information pertaining to software execution. To minimize the storage cost, Intel PT organizes the information captured in different forms of data packets. Of all the data packets, Taken Not-Taken (TNT) and Target IP (TIP) packets are the ones most commonly adopted. Technically speaking, TNT packets take the responsibility of recording the selection of conditional branches, whereas TIP packets are used for tracking down indirect branches and function returns. Along with some other packets such as Packet Generation Enable (PGE) and Packet Generation Disable (PGD), Intel PT also utilizes TIP packets to trace exceptions, interrupts and other events.
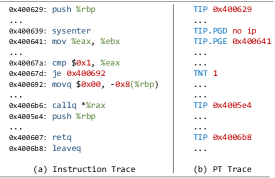
Using the packet trace captured by Intel PT along with the corresponding target program in the binary form, a software developer or a security analyst could fully and perfectly reconstruct the instruction trace pertaining to the execution of the target program. To demonstrate this, we depict the packet trace as well as the target program in disassembly side by side in Figure 2. As we can observe from the figure, Intel PT records the address of the entry point with TIP packet TIP 0x400629 and then the conditional jump with a TNT packet indicated by TNT 1. Following these two packets, Intel PT also encloses packets TIP 0x4005e4 and TIP 0x4006b8 in the packet trace. Using the first two packets shown in the trace, we can easily infer that the program enters its execution at the site 0x400629 and then takes the true branch redirecting the execution from the site 0x40067d to the site 0x400692. As is indicated by consecutive packets TIP 0x4005e4 and TIP 0x4006b8, we can further conclude that the target program invokes a subroutine located at the site 0x4005e4 and then returns to the site 0x4006b8.
3. Design
3.1. Overview
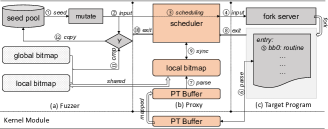
As is depicted in Figure 3, PTrix shares with conventional AFL the same architecture except for a PT module as well as a proxy sitting between the fuzzer and the target program. Within this new fuzzing system, the proxy component takes the responsibility of coordinating fuzz testing, and the PT module is used for supporting the parallel and elastic parsing of Intel PT trace packets. In the following, we briefly describe how each component coordinates with each other at the high level. Note that a more detailed description of the workflow will be provided in Section 3.2.
Similar to AFL, PTrix starts with generating an input for the target program (\raisebox{-0.9pt}1⃝ \raisebox{-0.9pt}2⃝). Instead of passing the input directly to the program or more precisely the embedded fork server, PTrix however sends it through the proxy component which leverages a scheduler to coordinate fuzz testing (\raisebox{-0.9pt}3⃝ \raisebox{-0.9pt}4⃝).
With the facilitation of Intel PT, PTrix uses a PT module to monitor the execution of the target program and store the trace packets in a pre-allocated buffer shared between kernel and user space (\raisebox{-0.9pt}6⃝). Carried on simultaneously with the execution of the target program, the proxy parses the PT trace, computes feedback and updates the local bitmap accordingly (\raisebox{-0.9pt}7⃝).
At the time of the termination of fuzz testing, the proxy receives a notification (\raisebox{-0.9pt}8⃝). To enforce correct synchronization between consecutive rounds of fuzz testing, the scheduler of the proxy does not pass the notification back to the fuzzer until it confirms the completion of packet parsing (\raisebox{-0.9pt}9⃝ ⑩).
On the fuzzer side, right after receiving the fuzzing completion notification from the proxy, it follows the same procedure as AFL to conclude one round of fuzz testing, i.e., comparing the local and global bitmaps and, if necessary, appending the input into the queue for the consecutive rounds of fuzz testing (⑪ ⑫). It should be noted that, throughout the fuzzing process described above, the key characteristic of PTrix is to compute path coverage using PT trace. As is mentioned earlier in Section 1, this could significantly reduce the overhead introduced by instruction trace reconstruction. In Section 3.3, we will elaborate on our design of PTrix to enable this practice.

3.2. Workflow Detail
Now, we specify the workflow details that have not yet been discussed above.
3.2.1. Initializing Fuzz Testing Workflow
First, PTrix mounts the PT module and sets it to listen to a netlink channel. Second, PTrix starts the fuzzer component, which forks a child process running as the proxy seating between the fuzzer and the target program. By passing the information pertaining to a fuzzing task to the proxy, PTrix triggers the proxy to send a notification to the PT module through the established netlink channel.
On receiving the above notification, the PT module allocates a buffer for storing PT data packets. In addition, it instantiates a variable pt_off and uses it to indicate the offset of the buffer, from which to the head of the buffer is the space where the data packets are stored. In this work, we design PTrix to map the buffer and the variable into the user-space of the proxy process. In this way, we can ensure that the proxy process can retrieve data packets without crossing the user-kernel privilege boundary, making the performance overhead minimal.
After the PT module initialization, the proxy receives a confirmation and further performs the following operations. First, it forks a child process running as the fork server. Second, the proxy process notices the fuzzer to generate an input and passes it to the fork server to start execution.
3.2.2. Enforcing the Correctness of the Workflow
With the completion of the initialization above, PTrix can perform fuzz testing by following the workflow specified in Section 3.1. However, a simple design of this workflow could potentially incur an incorrect synchronization issue, particularly given the situation where the fuzzer, proxy, PT module and fork server components all run concurrently. To ensure the correctness of fuzz testing, we augment PTrix with three callbacks planted into the tracepoints inside three kernel events – fork, context_switch, and exit. Note that we use the tracepoints instead of explicit interactions (such as system calls) to avoid additional communication costs. In the following, we specify the functionality of each of these callbacks.
Fork callback. PTrix uses PT module to monitor the process of a target program (for brevity target process) and the proxy component to coordinate the entire fuzzing test. To facilitate this, we introduce a fork callback. On the one hand, when the fork server forks the target process 111More precisely, the target process means the master thread, this callback registers the target process to the proxy and makes the PT module ready for tracing. As such, we can ensure that the target process does not execute until the proxy is ready and the PT module is set up. On the other hands, this callback captures child threads forked by the target process, prepares these threads with the aforementioned initialization we perform to the target process, and ensures the synchronization before these threads start. By doing so, PTrix can handle multi-threading programs.
Context_switch callback. When the target process enters execution status, the CPU might switch it in and out periodically and a context_switch event would occur. In the context_switch, we introduce a callback for two reasons. First, we design the callback to enable Intel PT to trace a CPU core whenever the target process switches into it, and disable the tracing at the time when the target process is switched out. In addition, this callback updates pt_off when the target process is switched out. In this way, we guarantee that PT always writes to the right place. Second, as PT cannot separate the traces from different threads, we use this callback to distinguish the target process and its child threads. More specifically, this callback sets up PT to write in the buffer associated with a thread when this thread is switched in and updates the corresponding pt_off when this thread is switched out.
Exit callback. After the target process terminates, an exit event would occur. To use it as a signal for concluding one round of fuzz testing, we introduce a callback in exit. This callback is responsible for coordination among the fuzzer, PT module and proxy components. To be specific, whenever the callback is triggered, PTrix first disables Intel PT. Then, it examines whether the data packets have been processed completely. Only with the confirmation of data packet processing completion, PTrix further resets the PT module, coordinates with the fuzzer to compare the bookkeeping bitmaps and thus concludes one round of fuzzing testing. With this callback, we can ensure that the fuzzer does not conclude fuzz testing prior to the packet parsing and local bitmap computation.
3.3. Efficiency Improvement
To illustrate the coordination and synchronization enforced through the aforementioned callbacks, we present the chronological order of each component in Figure 4. As we can observe from the figure, parsing data packets and computing local bitmaps sit on the critical path of each round of fuzz testing. If these operations start after the termination of the target process, or launch nearly simultaneously with the target process but take a significant amount of time to complete, the fuzzing efficiency would be significantly jeopardized and these operations would become the performance bottleneck for PTrix. To avoid these situations and improve performance, we propose a parallel and elastic PT parsing scheme and a new PT-friendly feedback.
3.3.1. Parallel and Elastic PT Parsing
As is mentioned above, it obviously increases the time needed for a single round of fuzz testing if PTrix parses data packets right after the termination of a target process. As a result, we carefully design the following scheme to perform data packet decoding simultaneously with the target process execution.
After starting a target process, the proxy process creates a parser thread to decode the data packets recorded through Intel PT. Depending upon how fast the data packets are yielded, the parser thread adjusts its working status. For example, if the parser exhausts the packets quicker than they are recorded, it would enter an idle state until new data packets become available. In the process of parsing data packets, we design PTrix to maintain a variable last_off, indicating the ending position where the parser thread completes packet decoding last time. With this variable, the parser could easily pinpoint the offset from which it could retrieve the data packets while it is awakened from an ideal state.
In our design, PTrix initializes the last_off variable with zero. Every time when last_off is less than pt_off – the variable indicating the end of the buffer that stores data packets – the parser thread could decode data packets and update last_off accordingly. With this, we can ensure that the parser can always correctly identify the packets that have not yet been decoded and, more importantly, guarantee that the parser does not retrieve data packets out of the boundary. In addition, with the facilitation from the exit callback, PTrix can ensure all data packets are processed behind the termination of the target process. It should be noted that we design PTrix to maintain these variables on the basis of each individual thread for the simple reason that this could allow PTrix to handle multi-threading.
While the aforementioned design is intuitive, it is still challenging to follow the design and perform data parsing simultaneously with the execution of a target program. The reason is that, in order to perform data packet decoding and execute the target process in parallel, we have to design PTrix to update the variable pt_off significantly frequently. However, due to the limitation imposed by hardware, we can update the variable pt_off only at the time when a CPU core switches out the target process. This is simply because a correct offset can be reliably obtained only when PT tracing is disabled. In practice, our observation, however, indicates that context switch does not frequently occur and, oftentimes, a target process completes one round of fuzz testing without experiencing context switch. As a result, it is infeasible to perform simultaneous data packet parsing without disrupting the execution of the target program.
To address the challenge above, we introduce an elastic scheme, which leverages a timer mechanism provided by kernel to adjust the frequency of disabling process tracing in an automated fashion. To be more specific, we first attach a timer to a CPU core that ties to a target process. Then, we register a handler to that timer. With this, process tracing can be enabled or disabled, and the variable pt_off can be updated. For example, whenever the timer alarm is triggered, the handler could disable the tracing, update pt_off and set up the timer to arm for the next shot.
To determine the countdown for the next alarm, we measure the length of the data packets by retrieving the value held in the variable pt_off. Then, we compare it with the variable pt_last, indicating the length of the data packets that have been correctly decoded by the parser thread. Since the value difference in these variables demonstrates the amount of data packets that have not yet been parsed, which reflects the speed of the parser thread in decoding the packets. We set up the next timer alarm in an elastic manner based on the following criteria. If the amount of the data packets left behind exceeds a certain threshold, PTrix decreases the countdown so that parser’s workload will be reduced. Otherwise, the countdown is incremented and thus ensuring that parser has sufficient packets to perform decoding. In Section 5, we demonstrate the efficiency gain obtained from this elastic scheme by comparing it with a naive scheme in which the parsing process starts after the execution termination of the target process.
<< 3 Number of bits in
>> (64 - )
>>
3.3.2. New PT-friendly Feedback Scheme
As is mentioned earlier, if parsing data packets incurs significant latency, the improvement in fuzzing efficiency obtained from the aforementioned parallel parsing scheme would become a futile attempt. Therefore, in addition to taking advantage of parallelization for improving the efficiency of fuzz testing, we need an efficient approach to decode data packets and thus expedite each round of fuzz testing.
Intuitively, we can perform data packet decoding by following the footprints of previous works (win, 2017; Schumilo et al., 2017), in which fuzzing tools are designed to reconstruct instructions executed – using the technique discussed in Section 2 – and then compute the bitmaps by following the bitmap update algorithm introduced by AFL. However, as we demonstrated in Section 5, using such an approach, dubbed Edge-PT, as part of our fuzzing system does not actually introduce any efficiency improvement. This is simply because recovering instructions from data packets incurs a significant amount of latency even when we cache the disassembling results.
To address this issue, we introduce a new scheme to compute and update bitmaps needed for fuzz testing. At the high level, we concatenate the TIP and TNT packets into “strings” and then hash those strings into indices for bitmap updating. We describe the details of our algorithm as follows.
The overall algorithm is presented in Algorithm 1. As fuzzing continues, the UPDATETRACEBITS procedure consumes the TIP and TNT packets produced by our decoder. Note that for better efficiency, single-bit TNTs are concatenated into byte-aligned packets. In UPDATETRACEBITS, each packet is taken by the UpdateHash routine to update a hash value. UpdateHash implements the SDBM hash function which supports streaming data (Seltzer and Yigit, 1991). We selected SDBM because it has been demonstrating great over-all distribution for various data sets (Henke et al., 2008) and it has low computation complexity.
When UPDATETRACEBITS sees MAX_TIP TIP packets, it encodes the accumulated hash value as an index to update the bitmap. This essentially cuts the packets stream into slices and record each slice with a bit. Shortly we will explain the rationale behind this design and how we determine MAX_TIP. Encoding of the hash value is achieved using Algorithm 2. It transforms a 64-bit hash to a value in , where represents the number of bits in the bitmap. To be more specific, this encoding splits the hash value into multiple pieces with each piece converged into . Then it exclusively-ors these pieces to form the index. Given a set of equally distributed hash values, Algorithm 2 will ensure that they are mapped into with uniform distribution.
In this design, we only spare one bit to record the appearance of a slice. This differs from the design of AFL — AFL uses one byte to log not only the appearance of an edge but also its hit count. Our design is motivated by the observation that most of the slices (under the MAX_TIP we select) only arise once, which only require single bits for recording. As a result, our scheme uses x less space than the hit-count-recording scheme in AFL. This, in turn, enables bit_map to better reside in L1 cache. As we will show in Section 5, this choice brings around an additional 8% speed up.
The above algorithm avoids the expensive re-construction of instruction trace. As we will shortly show in Section 5, it brings us over 10x acceleration on execution speed. Essentially, this algorithm alters AFL’s code-coverage based feedback in AFL to “control-flow” based feedback. In the following, we discuss how our design maintains the functionality and gains the efficiency.
Functionality wise, our new feedback provides guidance that is inclusive of code coverage (the feedback natively used by AFL). The guidance requires that the feedback to diverge when inputs incur different execution behaviors. The feedback to guide AFL captures new code edges and their new hitting counts. Going beyond AFL, our feedback acutally approaches a higher level of guidance — path guidance. More specifically, our feedback encodes the control flow packets, which uniquely represents an execution path. Following inputs that lead to different execution paths, our feedback produces different outputs. Therefore, it captures not only new code edges and new hitting counts of code edges, but also new orders and new combinations among code edges, since all the four events result in new execution paths.
Efficiency wide, our new feedback may encounter two caveats when mounted for fuzzing. In the following, we introduce their details and explain our solutions.
First, we need a giant bitmap to record the tremendous volume of distinct execution paths. This greatly impacts the frequent bitmap updating and comparison, mainly because of a reduced cache hit ratio and increased comparing operations. To mitigate this, we split an entire path into slices aligned by MAX_TIP TIPs. The rationale behind is that a smaller MAX_TIP reduces the size of a slice, which consequently shrinks the permutation space of slices and the needed bitmap. However, intuition suggests that decreasing MAX_TIP will also reduce the path guidance. To better balance the efficiency and guidance, we pick MAX_TIP following two criteria: (1) PTrix works with a 64KB bitmap 222The 64KB bitmap is used in AFL by default — We confirm this if the bitmap increases no faster than 30% per 24 hours; (2) PTrix achieves an equivalent (if not better) guidance than AFL — We confirm this if PTrix rarely runs into collisions using a corpus of seeds generated by AFL in 24 hours.
Second, our new feedback may cause PTrix to overly explore or even get trapped in localized code segments (in particular loops), which slows down or impedes PTrix to explore new code. We invest two-fold efforts in addressing this issue. At first, we restrict the number of TNTs between two TIPs (line 18 in Algorithm 1) and we call this approach descending path guidance. Our reason is that extremely long TNT sequences are typically due to massive iterations in loops. Limiting the number of TNTs can effectively prevent PTrix from trapping into deep loops. Note that determination of MAX_TNT is explained in Section 4. In addition, we adjust the fuzzing scheduling in PTrix to prefer seeds producing small TNT sequences. As we will show in Section 5, the two ideas well avoid over-exploration of localized code and enable PTrix to achieve high fuzzing efficiency.
3.4. Side Benefits of New Feedback Scheme
Our testing with PTrix on benchmark programs illustrates that the newly designed feedback truly has stronger guidance which brings side benefits to fuzzing.
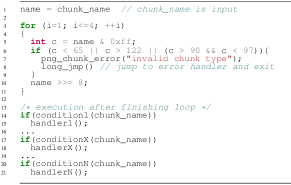
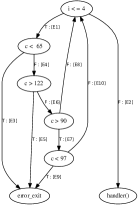
Better code coverage. Recall that our feedback has the advantage of capturing the orders and combinations of traversed code edges. This property benefits PTrix in covering code that AFL is unable to reach. Figure 5(a) showcases such an example in libpng-1.6.31. The code verifies a 4-byte field chunk_name in the image header through a loop (line 3 - 11). Any one of the four bytes violating the checks (line 6) will break the loop and result in an early exit (line 8). A valid chunk_name, will be processed by a handler corresponding to its type (line 14 - 21).
In the fuzz testing, AFL generated inputs whose first byte violated the three checks in different ways (line 7). These inputs followed different execution paths (as shown in Figure 5(b)), including {E1 E3}, {E1 E4 E5}, {E1 E4 E6 E7 E9}. By further mutating those inputs, AFL produced test cases which chronologically explored the following paths: {E1 E4 E6 E8 E1 E3}, {E1 E4 E6 E8 E1 E4 E6 E8 E1 E3} and {E1 E4 E6 E8 E1 E4 E5}. As the third test case led to neither new edge nor new hitting count, it was ignored by AFL. But in fact, permutating this input would result in a valid chunk_name, which matches conditionX and makes handlerX executed. Different from AFL, PTrix values this discarded input since it triggered new combinations of code edges, which enables PTrix to ultimately reach conditionX.
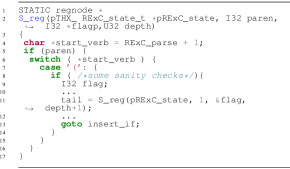
Uncover deep bugs. As our new feedback provides additional guidance, PTrix explores code segments more comprehensively, leading to coverage of deeper execution space. This helps the discovery of not only new code space but also deeper defects. In Figure 6, we demonstrate such a case PTrix identified in perl-5.26.1. With an input containing over 3500 “(”, one can trigger a stack exhaustion error. Specifically, each of those “(” would trigger a recursive call to function S_reg at line 11, which gradually exhausted the stack region.
AFL records the feedback pertaining to an edge with a single byte, which may log at most 255 hits. As such, AFL ignores inputs that invokes more than 255 recursions. This prevents AFL from mutating those inputs towards chasing down the bug. While in PTrix, deeper recursions produce new TNT sequences, which is captured by the new feedback.
4. Implementation
We implemented PTrix on 64-bit Ubuntu 14.04-LTS and released our prototype implementation at https://github.com/junxzm1990/afl-pt. We tested PTrix on a set of machines armed with various Intel processors, including Core i7-6770HQ, Core i7-6700K Skylake-H series and Core i5-7260U Kaby Lake series. In the following, we highlight the important implementation details.
Fuzzer. To provide PTrix with better usability, we integrate the main fuzzing logic of PTrix into the fuzzer of AFL (afl-fuzz). In this way, a user of PTrix only needs to specify a flag (-P) along with other options that are identical to those defined by AFL.
Proxy. Recall that one of the major tasks for the proxy is to parse PT packets. To obtain the optimal performance in terms of parsing efficiency, we implement the packet parser by porting the decoder of Griffin (Ge et al., 2017). We trim the decoder by removing the control flow reconstruction steps and add supports for our elastic decoding. Our new decoder contains less than 300 lines of code. As is described in Section 3.3, the proxy component of PTrix sets up a threshold to restrict the number of TNT packets in a sub-trace. To determine this threshold, we also implement a subroutine for the proxy component, which utilizes angr (Shoshitaishvili et al., 2016) – a binary analysis tool – to count the number of basic blocks in a target program and then deems that number as the value of the threshold. The reason behind this is that we observed the number of TNT packets is proportionate to the size of the traced program.
PT Module. We developed the PT module as a separate loadable kernel module (LKM). At the high level, the module manages Intel PT and communicates with the proxy component. Technically, we implement the module to enable PT to run in the Table of Physical Addresses (ToPA) mode. In this mode, Intel PT can store the tracing packets in multiple discontinuous physical memory areas. For flexibility, the size of the overall trace buffer can be configured via a parameter when installing the PT module. Considering the tracing buffer could get fully occupied, we implement the PT module to handle that situation by clearing the END bit and setting the INT bit in the last ToPA entry. By doing this, Intel PT could trigger a performance-monitoring interrupt when the tracing buffer is fully occupied. Since this interrupt may have a skid and result in a loss of PT packets, we further append an entry to the end of ToPA which also points to a 4 MB physical memory area.
Fork Server. We compiled the fork server into the GNU ld linker and used it through a series of configurations. During the target program initialization, our linker gets started and completes its works on linking and loading. It then enters the forking loop as we described in Section 2.
5. Evaluation
| Program | Settings | |||
|---|---|---|---|---|
| Name | Version | Driver | Seeds | Options |
| libpng | 1.6.31 | readpng | supplied by AFL | empty |
| libjpeg | jpeg-9b | djpeg | supplied by AFL | “-gif” |
| libxml | 2.29 | xmllint | supplied by AFL | empty |
| c++filt | 2.29 | cxxfilt | empty byte | empty |
| nm | 2.29 | nm-new | supplied by AFL | empty |
| objdump | 2.29 | objdump | supplied by AFL | “-D” |
| exif+libexif | 0.6.21 | exif | (ian, 2013) | empty |
| perl | 5.26.1 | perl | (Labs, 2016) | empty |
| mupdf | 1.11 | mutool | supplied by AFL | “show” |
In this section, we present the evaluation of PTrix in terms of fuzzing efficiency and vulnerability discovery.
For efficiency, we performed two sets of experiments. First, we compare PTrix with QEMU-AFL, Edge-PT, and PTFuzzer (Zhang et al., 2018) on execution speed. QEMU-AFL refers to AFL running in the QEMU mode and Edge-PT is a ported version of kAFL (Schumilo et al., 2017) that supports user space application. This set of experiments aims to illustrate the efficiency improvement of PTrix on executing the same amount of inputs. Second, following the best practise (Klees et al., 2018), we evaluated PTrix on efficiency of code coverage, which is a widely accepted utility metric of fuzzers (Lemieux and Sen, 2017; Li et al., 2017). Recall that PTrix uses feedback that has higher path-sensitivity than QEMU-AFL. To show that our new feedback indeed allows PTrix to discover new code space, we also conducted a study to compare the code space explored by PTrix and QEMU-AFL.
To evaluate its vulnerability discovery ability, we applied PTrix on a set of commonly used and exhaustively fuzzed programs. As we will present shortly, PTrix discovers 35 new vulnerabilities. Among them, at least 10 were discovered due to our new feedback.
5.1. Experiment Settings
To support our evaluation, we selected a set of 9 programs. Details about these programs and the corresponding fuzzing settings are presented in Table 1. All these programs are either commonly used for fuzzing evaluation (Rawat et al., 2017; Böhme et al., 2016) or treated as core software by the Fuzzing Project (Böck, 2014). In addition, they represent a high level of diversity in functionality and complexity. Considering that different seed inputs and execution options could lead to varying fuzzing results (Godefroid et al., 2012), we used the seeds suggested by AFL and configured the options following the existing works.
For consistency, we conducted all the experiments on machines equipped with Intel Core i5-7260U and 8 GB RAM running 64-bit Ubuntu 14.04-LTS. To minimize the effect of randomness introduced during software fuzzing, we ran each fuzzing test 5 times and reported the average results with standard deviation.
5.2. Execution Speed Evaluation
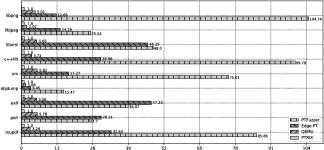
To show how fast is PTrix, we compared its execution speed with QEMU-AFL, Edge-PT, and PTFuzzer. To be specific, we ran these fuzzers with an identical input corpus and examined their execution time. In this evaluation, different inputs could trigger different types of fuzzing operations/decisions. For example, an input that results in no new coverage will be discarded without further processing. To avoid such difference in fuzzing runs, we selected inputs which make all the fuzzers to go through the entire fuzzing procedure. For this, we ran QEMU-AFL with the settings shown in Table 1 for 24 hours and only kept inputs that led to new coverage. Note that these inputs also resulted in new coverage in PTrix due to its highly sensitive feedback.
In this test, we utilized the dry-run mode of AFL. It allows the fuzzers to repeatedly process the above input corpus. In Figure 7, we show the evaluation results that have been normalized with PTrix as baseline. On average, PTrix ran 4.3x, 25.8x, and 54.9x faster than QEMU-AFL, Edge-PT, and PTFuzzer 333Our evaluation on PTFuzzer shows much worse performance than the results reported in (Zhang et al., 2018). We believe this is mainly because our benchmarks have higher complexities and the seeds we use trigger deeper execution., respectively. In addition, we observed that Edge-PT ran 6.0x slower than QEMU-AFL with all our optimization enabled (i. e., parallel decoding, optimized communication and caching instruction trace), and PTFuzzer ran 13.5x slower than QEMU-AFL. Considering that Edge-PT, PTFuzzer and AFL-QEMU share the identical feedback, this observation indicates that the design with control flow reconstruction cannot truly expose the potential of PT in improving fuzzing efficiency.
| Program | Optimization | ||
|---|---|---|---|
| Name |
New Feedback
Scheme |
Parallel
Parsing |
Bitmap
Optimization |
| libpng | 1038.16% | 22.19% | 9.51% |
| libjpeg | 1412.96% | 36.54% | 14.04% |
| libxml | 2856.08% | 51.02% | 5.80% |
| c++filt | 1208.11% | 28.70% | 10.58% |
| nm | 1145.90% | 18.22% | 6.61% |
| objdump | 393.58% | 6.63% | 4.40% |
| exif+libexif | 2695.03% | 41.64% | 8.60% |
| perl | 845.71% | 63.14% | 9.37% |
| mupdf | 1426.82% | 47.61% | 3.68% |
| Average | 1446.93% | 35.08% | 8.07% |
PTrix optimization breakdown: To better understand how PTrix achieves the high execution speed, we inspected the improvement that each of our optimization introduces. We first re-ran PTrix without our new feedback scheme, parallel trace decoding and bitmap optimization. Then we enabled the optimization one by one and measured the increase of execution speed independently. The results are shown in Table 2. On average, our new coverage scheme increases the execution speed by over 14X. The major reason, we believe, is that the new scheme avoids the time-consuming instruction reconstruction. In addition, the parallel parsing introduces 35% increase in execution speed and our bitmap optimization contributes around 8% to the speedup.
5.3. Code Coverage Measurements
As above shown, the design of PTrix substantially accelerates the fuzzing process. Next, we show that PTrix is not just faster but also covers more code. In fact, code coverage is the most widely acknowledged metric (Lemieux and Sen, 2017; Böhme et al., 2016; Li et al., 2017; Rawat et al., 2017; Wang et al., 2017; Szekeres, 2017) for evaluating fuzzers.
We run PTrix and AFL for 72 hours or until QEMU-AFL saturates444When QEMU-AFL finishes all inputs that lead to new coverage, we consider it has saturated. The rationale is after that, QEMU-AFL may only discover new coverage through random attempts instead of strategic exploration., whichever comes first. This long-term evaluation reduces potential random noise in results and gives a more comprehensive view of the coverage efficiency across time. Note that in this evaluation, we excluded Edge-pt and PTFuzzer. The reason is that Edge-pt and PTFuzzer explore code even slower than QEMU-AFL, as echoed by our observations on the above 24 hour tests.
In the following, we first present the efficiency comparison between PTrix and QEMU-AFL. Then we examine the difference between code covered by the two fuzzers and discuss the possible reasons.
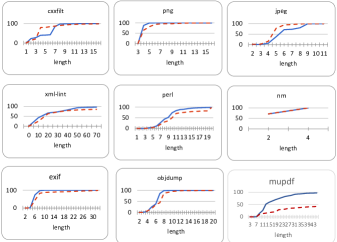
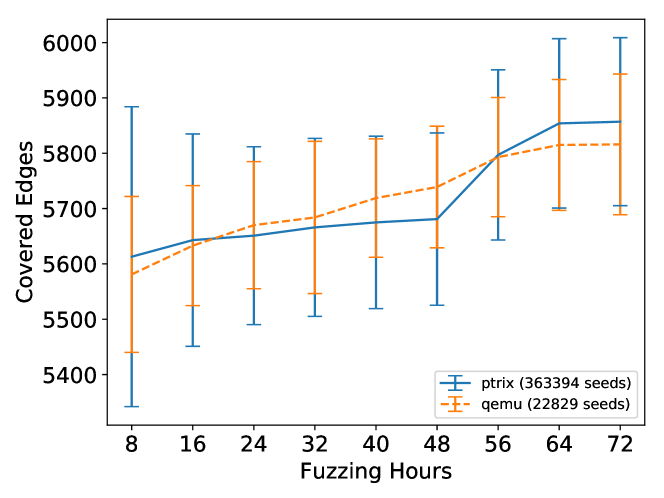
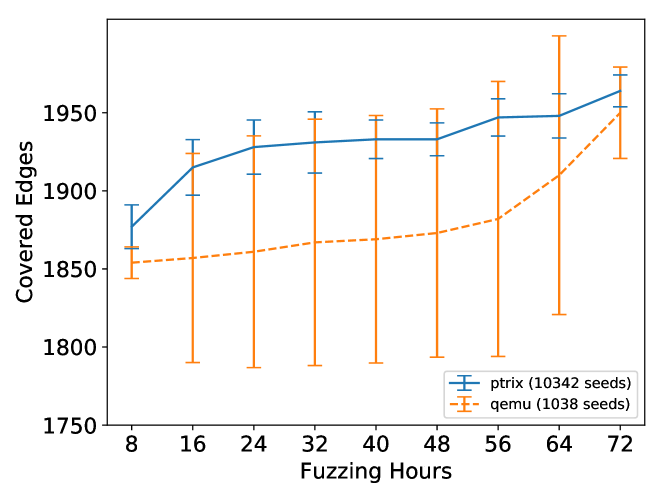
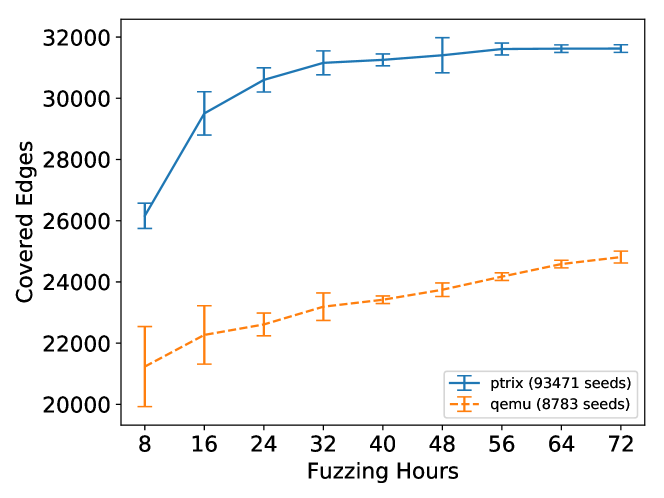
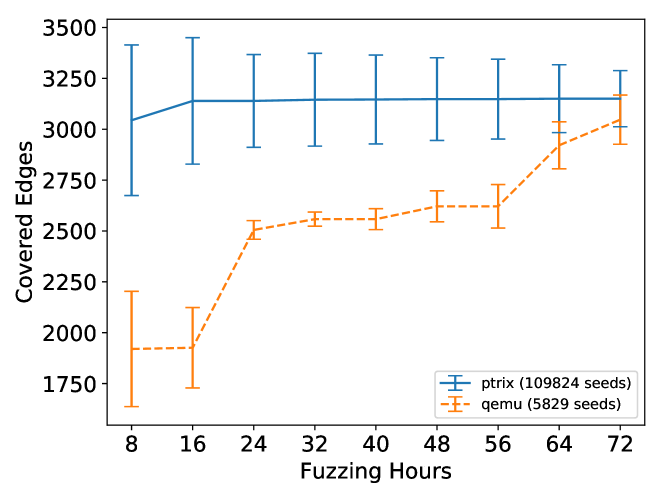
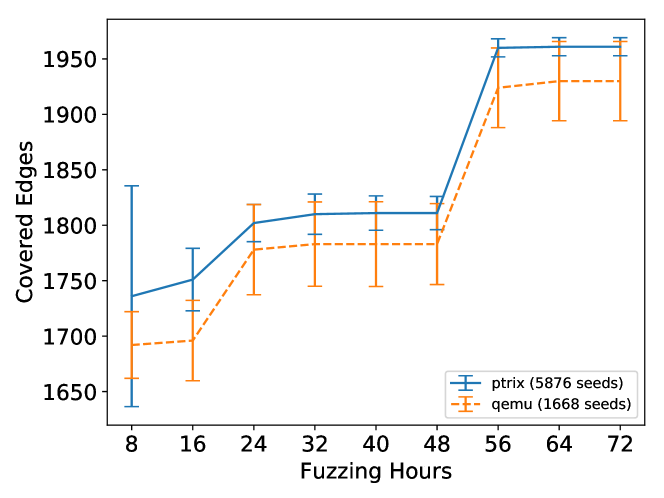
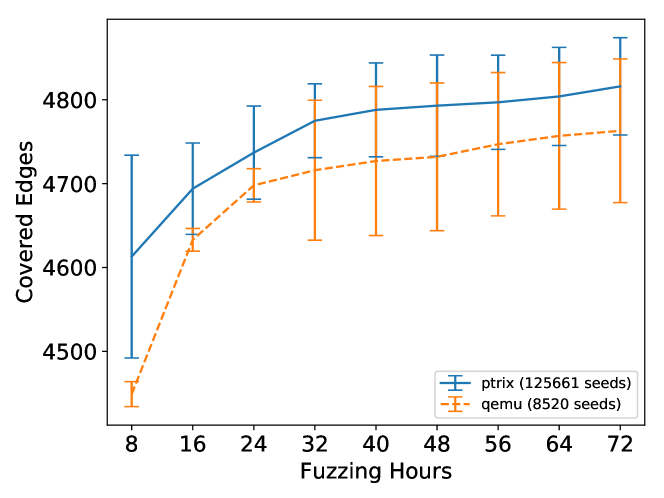
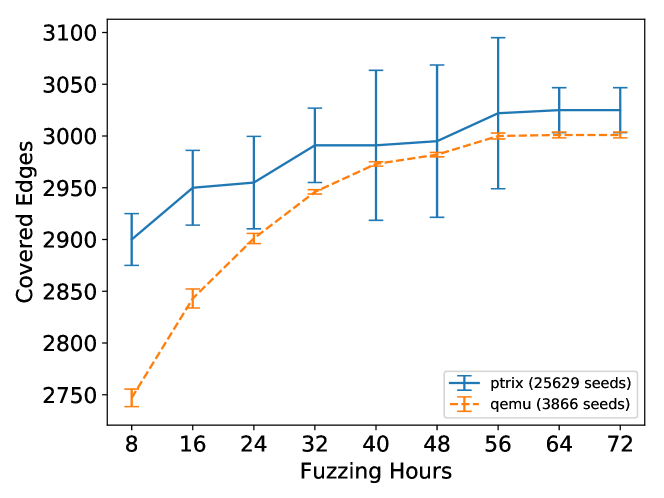
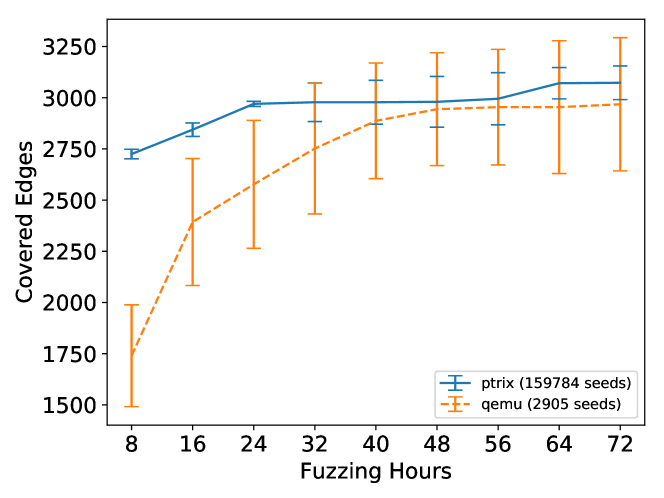
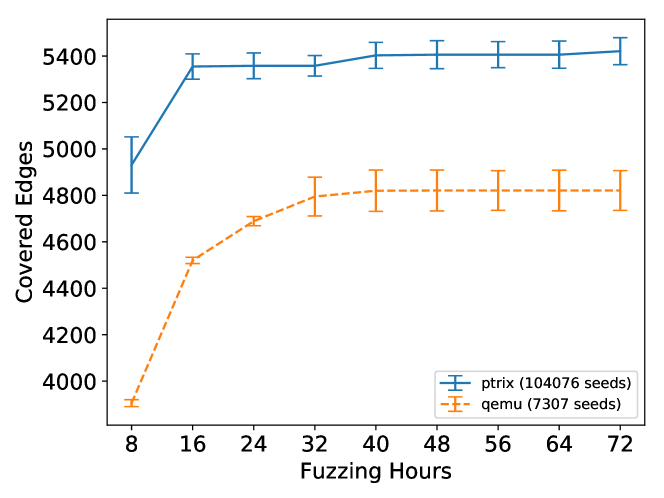
Code exploration efficiency: We calculated the code coverage using a representative quantification — number of edges between basic blocks (Lemieux and Sen, 2017) and summarize the results in Figure 8.
As is shown in the Figure, PTrix generally explored code space quicker than QEMU-AFL across the timeline. Only in the case of c++filt, PTrix fell behind QEMU-AFL from the 24th hour to the 48th hours. We believe this was mainly because PTrix spent more time on a local code region, which is reflected by its increased pace after 48 hours. For all the 9 programs, PTrix covered more edges than QEMU-AFL at the end. In particular for objdump and libpng, PTrix significantly increased the code coverage for over 5%. In the cases of c++filt, nm and mupdf, PTrix covered a similar amount of edges as QEMU-AFL after 72 hours. A possible reason for PTrix not achieving an obvious increase is that the fuzzers were reaching the first code coverage plateau, as their new edge discovering rate drops almost to 0.
PTrix uses a feedback scheme with higher sensitivity, which tends to explore localized code more thoroughly. By theory, this will make PTrix move slowly around code regions. However, our evaluation shows an opposite conclusion. We believe this is largely attributable to the high execution speed of PTrix. This fast execution not only offsets the delay by localizing into code regions but also accelerates the travel between different regions. Also note that the comprehensive exploration by PTrix is not running in vain. It gains new opportunities to reach new code regions and vulnerabilities. We will shortly discuss this with evaluation results.
| Program | Code coverage | ||
|---|---|---|---|
| Name | overlap | PTRIX only | QEMU-AFL only |
| libpng | 95.60% | 2.80% | 1.60% |
| libjpeg | 89.50% | 10.00% | 0.50% |
| c++filt | 89.93% | 5.85% | 4.22% |
| mupdf | 96.51% | 2.12% | 1.37% |
| Average | 92.89% | 5.19% | 1.92% |
Code exploration effectiveness: PTrix and QEMU-AFL use different feedback schemes. Intuition suggests that the two fuzzers may explore code in different favors. To explore this intuition, we compared the difference of edges discovered by PTrix and QEMU-AFL. Essentially, we took the union of edges from the two fuzzers as the baseline. Then we calculated the proportion that was covered by both PTrix and QEMU-AFL, by PTrix only, and by QEMU-AFL only. The average results are organized in Table 3. We only included the cases where QEMU-AFL has saturated. In those cases, QEMU-AFL has sufficiently expressed its exploration capability following the strategic approach, which enables us to better inspect whether PTrix can really outperform QEMU-AFL.
As shown in the table, the two fuzzers were mostly covering the same set of edges, but they indeed explored different code regions. For instance, in the case of cxxfilt, over 10% of code edges were individually discovered. Taking a closer look, PTrix missed significantly fewer edges than QEMU-AFL. Particularly in the case of libpng, PTrix nearly covered all the edges by QEMU-AFL. This indicates the path-sensitive feedback improves the code exploration of PTrix. More importantly, during the long-term running, PTrix never saturated. For example, when we ended the tests on c++filt, PTrix’s pending favorite metric was still about 1,000. This demonstrated the potential of PTrix to cover all edges that have been explored by QEMU-AFL.
We have also manually inspected the different edges covered by PTrix and QEMU-AFL. Due to limited time, we have only analyzed a subset of them. We have identified two code regions which we believe shall only be covered by PTrix. We have explained one case from libpng in Section 3 and will present the other case from objdump in Section 5.4.
Code exploration comprehensiveness: As shown above, PTrix and QEMU-AFL may cover different code given the same amount of time. Presumably, this is due to their different feedback schemes. To verify this intuition, we performed an additional analysis named call chain analysis. This analysis takes as inputs the corpus from PTrix and QEMU-AFL in the long-term run. It re-executed each test case and collected the call chains. A call chain is defined as follows — When the execution reaches a leaf node on the program’s call graph, the sequence of functions on the stack is deemed as a call chain. The length of a call chain represents a “locally maximal” execution depth.
To give an overview of the call chains, we aggregated them by their lengths and present the cumulative distribution in Figure 9. Generally speaking, PTrix produced higher proportion of shorter call chains than QEMU-AFL. We also observed that PTrix usually generates the shorter call chains before the longer ones. This shows that PTrix spends more efforts in the beginning on shorter call chains and then later moves onto longer ones, which is consistent with our expectation — PTrix explores local code more comprehensively and does not easily skip code paths or regions.
| Program | Vulnerability Type | CVE | |
|---|---|---|---|
| Name | Memory Error | DOS | |
| objdump | 4 | 1 | 0 |
| c++filt | 3 | 2 | 2 |
| perl | 3 | 0 | 1 |
| nm | 4 | 1 | 0 |
| gifview | 1 | 0 | 1 |
| gdk-pixbuf | 1 | 0 | 1 |
| nasm | 7 | 2 | 5 |
| glibc ld | 1 | 0 | 0 |
| libxml | 0 | 2 | 1 |
| tcpdump | 1 | 0 | 0 |
| unrtf | 1 | 0 | 0 |
| libjpeg | 0 | 1 | 0 |
| Total | 25 | 10 | 11 |
5.4. Discovery of Real-world Vulnerabilities
Going beyond evaluation on fuzzing efficiency and code coverage, we further applied PTrix to hunt unknown bugs in the wild. We selected a set of programs as shown in Table 1 and four other well-tested programs including gnu-ld, curl, nasm, and tcpdump. Due to constraints of computation resources and time, we only ran each program for 24 hours.
PTrix triggered 19,000 unique exceptions — unique crashes and hangs based on the measurement of AFL. We have manually analyzed a subset of them and confirmed 35 new vulnerabilities. Among those vulnerabilities, 25 are memory corruptions vulnerabilities and 10 are Denial-of-Service (DoS) flaws that could lead to endless computation or resource exhaustion. 11 CVE numbers have been created for those vulnerabilities. We have been communicating with the developers for patches. When those patches are available, we will disclose the details of those vulnerabilities.
Taking a closer look at the results, we observe that the discovery of certain vulnerabilities was indeed benefited from our new feedback. Among the 10 DoS vulnerabilities, 9 are due to recursive calls or deep loops, which follow the same pattern as the example shown in Figure 6. As we have explained in Section 3, QEMU-AFL unlikely would catch them. For the memory corruption vulnerabilities, although most of them locate in execution space that QEMU-AFL will also cover with high likelihood, we have identified a case that can only be discovered using our new feedback. In the following, we the above memory corruption case and a DoS vulnerability (all the other DoS vulnerabilities share the same pattern).
Stack Overflow/Exhaustion in c++filt. c++filt shipped in binutils-2.29 can run into stack exhaustion with a long sequence of “F”. More specifically, each “F” leads to a recursive call chain including demangle_nested_args, demangle_args, do_arg and do_type. Stack frames of those recursive functions gradually occupy the whole stack.
Integer Overflow in objdump. In objdump from binutils-2.29, an integer could overflow, which further causes memory corruption. To be specific, objdump utilizes qsort for sorting an array and uses the return value of bfd_canonicalize_dynamic_reloc to specify the array size. When exception happens, bfd_canonicalize_dynamic_reloc may return -1. However, this is ignored by objdump and consequently, qsort wrongly casts -1 to the largest unsigned value (which is taken as the array size) and ultimately makes out-of-bound memory accesses. The bfd_canonicalize_dynamic_reloc function implements a logic close to Figure 5(a). Because of a similar reason as we explained in Section 3, QEMU-AFL is unable to make bfd_canonicalize_dynamic_reloc return -1.
6. Discussion
In this section, we discuss the limitations of our current design, insights we learned and possible future directions.
Path explosion: PTrix implements a gray-box fuzzing scheme with path-sensitive feedback. This feedback metric, however, may lead to the problem of path explosion. That is, the fuzzer may explore a huge number of paths and correspondingly produce an extremely large corpus. This could further result in the exhaustion of available bitmap entries used by the fuzzer to record coverage. As we detailed in Section 3, PTrix mitigates the path explosion problem by incorporating the technique of descending path sensitivity. This technique favors the prefix of an execution path and suppresses long paths, which prevents PTrix from generating a large corpus and trapping into localized code regions.
Generality: PTrix leverages PT to trace the target program. However, PT is only equipped on x86 platforms. We believe this will not impede the generality of the design philosophy behind PTrix. Probably due to the motivation to assist debugging, hardware tracing has become a common feature in major architectures. Besides x86, ARM also incorporates a hardware feature called Embedded Trace Macrocell (ETM) to support runtime tracing. ETM, similar to PT, can trace the instructions with negligible performance impacts. In addition, ETM also provides a rich set of configuration options which can serve the requirement of PTrix. We, therefore, believe PTrix can be ported to other platforms without any modifications to the design.
7. Related Works
This work focuses on leveraging PT to escalate efficiency of grey-box fuzzing on COST binaries. With regard to this problem, the closely related research includes binary compatible coverage-based fuzzing, improvement of coverage-based fuzzing, and combination of fuzzing and other techniques.
7.1. Binary Compatible Coverage-based Fuzzing
Coverage-based fuzzing requires feedback from the target program, which can be obtained via lightweight program instrumentation when source code is available. This is, however, very challenging when only a binary is present. In the literature, various options have been explored.
7.1.1. Fuzzing with Dynamic Instrumentation
Dynamic instrumentation based solutions (afl, 2014, 2016; tri, 2016; Li et al., 2017) dynamically translate the binary code, the fuzzer can then intercept and collect coverage information. This approach, however, significantly slows down the fuzzing process. The fastest tool produced by this research line (QEMU-AFL) reportedly introduces 2 to 5 times of overhead.
7.1.2. Hardware-assisted Fuzzing
Motivated by the inefficiency of dynamic instrumentation based fuzzing systems, hardware-assisted fuzzing techniques were proposed recently (Zhang et al., 2018). Similar to PTrix, by leveraging the newly available hardware tracing component–Intel PT (int, 2013), Honggfuzz (hon, 2015) and kAFL (Schumilo et al., 2017) efficiently collect the execution trace from the target program. In contrast to PTrix, the two systems do not fully exploit the potential of PT. Honggfuzz only collects coarse-grained coverage information trading for execution throughput, which in fact degrades the code exploring capability. kAFL and PTFuzz, however, spend too much bandwidth on reconstructing the execution flow from PT trace.
7.2. Improvement of Coverage-based Fuzzing
7.2.1. Improving Seed Generation
Many programs take as inputs highly structured files and process these inputs over different stages (Rebert et al., 2014; Stephens et al., 2016; Chen et al., 2020; Peng et al., 2018; Böhme et al., 2017). As a result, most randomly generated inputs will be rejected at the early stages and cannot reach the core logic of the target program. Therefore, based on a priori knowledge about inputs taken by the fuzzed programs, more targeted seeds can be generated. Skyfire (Wang et al., 2017) establishes a probabilistic context-sensitive grammar model by learning through a large corpus of valid inputs. It then uses the grammar to generate inputs that are accepted by target programs. Similarly, Godefroid et al. aid white-box fuzzing with a grammar-based input generator (Godefroid et al., 2008; Pham et al., 2016).
7.2.2. Improving Fuzzing Scheduling
When there are plenty of seeds in the input queue, the strategy to select seeds for the following runs is very critical for the efficiency of fuzzing test (Woo et al., 2013). AFL (lcamtuf, 2005) develops a scheduling algorithm in a round-robin flavor which prefers seeds that bring new edge coverage and take less time to run. Böhme et al. (Böhme et al., 2016) propose to change that algorithm to prioritize inputs that follow less frequently visited paths. This strategy significantly accelerates the code coverage and bug discovery.
7.2.3. Improving Coverage Guidance
Providing a more informative coverage guidance is a new trend on tuning the effectiveness of fuzz-testing techniques. CollAFL (Gan et al., 2018) reduced path collision introduced by AFL’s over-approximated counted edge coverage feedback, and thus make the fuzzer more sensitive to new program paths. Along the same route, recent works (Chen and Chen, 2018; Seo and Kim, 2014) introduced context-aware branch coverage to decide on whether to follow inputs cover branches with new context. Both techniques showed that a path-based feedback is a promising direction to help boost fuzzer’s effectiveness. PTrix aims to provide a higher level of path guidance, which helps PTrix achieve high fuzzing throughput.
8. Conclusion
We present PTrix, a binary compatible fuzz-testing tool featuring efficient code exploration capability. PTrix is carefully designed and engineered to take full advantage of Intel Processor Trace as its underpinning tracing component. Using PTrix, we demonstrate newly available hardware feature can significantly accelerate binary-only fuzzing through two elaborate designs, including a parallel scheme of trace parsing and a newly designed PT-friendly feedback. Also because of the new feedback provides more guidance than code coverage, PTrix is able to identify 35 new software bugs in well-tested programs that have not yet been uncovered, among them 11 CVEs have been assigned thus far.
9. ACKNOWLEDGMENTS
The authors would like to thank the anonymous reviewers for their constructive comments. This project was supported by the National Science Foundation (Grant#: CNS-1718459, Grant#: CNS-1748334, Grant#: CNS-1718459) and the Army Research Office (Grant#: W911NF-17-1-0039). Any opinions, findings, and conclusions or recommendations expressed in this paper are those of the authors and do not necessarily reflect the views of the funding agencies.
References
- (1)
- int (2013) 2013. Intel Processor Trace. https://software.intel.com/en-us/blogs/2013/09/18/processor-tracing.
- ian (2013) 2013. Sample images for testing Exif metadata retrieval. https://github.com/ianare/exif-samples.
- afl (2014) 2014. AFL technical details. http://lcamtuf.coredump.cx/afl/technical_details.txt.
- for (2014) 2014. Fuzzing random programs without execve(). https://lcamtuf.blogspot.com/2014/10/fuzzing-binaries-without-execve.html.
- hon (2015) 2015. Honggfuzz. http://honggfuzz.com.
- afl (2016) 2016. AFL-dyninst. https://github.com/vrtadmin/moow/tree/master/afl-dyninst.
- tri (2016) 2016. Project Triforce: Run AFL on Everything! https://www.nccgroup.trust/us/about-us/newsroom-and-events/blog/2016/june/project-triforce-run-afl-on-everything/.
- win (2017) 2017. Harnessing Intel Processor Trace on Windows for fuzzing and dynamic analysis. https://recon.cx/2017/brussels/talks/intel_processor_trace.html.
- Bellard (2005) Fabrice Bellard. 2005. QEMU, a Fast and Portable Dynamic Translator. In Proceedings of the Annual Conference on USENIX Annual Technical Conference (USENIX ATC). USENIX Association.
- Böhme et al. (2017) Marcel Böhme, Van-Thuan Pham, Manh-Dung Nguyen, and Abhik Roychoudhury. 2017. Directed greybox fuzzing. In Proceedings of the 2017 ACM SIGSAC Conference on Computer and Communications Security (CCS). ACM.
- Böhme et al. (2016) Marcel Böhme, Van-Thuan Pham, and Abhik Roychoudhury. 2016. Coverage-based greybox fuzzing as markov chain. In Proceedings of the 2016 ACM SIGSAC Conference on Computer and Communications Security (CCS). ACM.
- Böck (2014) Hanno Böck. 2014. The Fuzzing Project - apps. https://fuzzing-project.org/software.html.
- Chen and Chen (2018) Peng Chen and Hao Chen. 2018. Angora: Efficient Fuzzing by Principled Search. arXiv preprint arXiv:1803.01307 (2018).
- Chen et al. (2020) Yaohui Chen, Peng Li, Jun Xu, Shengjian Guo, Rundong Zhou, Yulong Zhang, Tao Wei, and Long Lu. 2020. SAVIOR: Towards Bug-Driven Hybrid Testing. In To appear in the 2020 IEEE Symposium on Security and Privacy (SP). IEEE.
- Gan et al. (2018) S. Gan, C. Zhang, X. Qin, X. Tu, K. Li, Z. Pei, and Z. Chen. 2018. CollAFL: Path Sensitive Fuzzing. In 2018 IEEE Symposium on Security and Privacy (SP). IEEE.
- Ge et al. (2017) Xinyang Ge, Weidong Cui, and Trent Jaeger. 2017. Griffin: Guarding control flows using intel processor trace. In Proceedings of the Twenty-Second International Conference on Architectural Support for Programming Languages and Operating Systems (ASPLOS). ACM.
- Godefroid et al. (2008) Patrice Godefroid, Adam Kiezun, and Michael Y. Levin. 2008. Grammar-based Whitebox Fuzzing. In Proceedings of the 29th ACM SIGPLAN Conference on Programming Language Design and Implementation (PLDI). ACM.
- Godefroid et al. (2012) Patrice Godefroid, Michael Y. Levin, and David Molnar. 2012. SAGE: Whitebox Fuzzing for Security Testing. Queue 10, 1, Article 20 (Jan. 2012), 8 pages.
- Henke et al. (2008) Christian Henke, Carsten Schmoll, and Tanja Zseby. 2008. Empirical Evaluation of Hash Functions for Multipoint Measurements. SIGCOMM Comput. Commun. Rev. 38, 3 (July 2008), 39–50.
- Klees et al. (2018) George Klees, Andrew Ruef, Benji Cooper, Shiyi Wei, and Michael Hicks. 2018. Evaluating Fuzz Testing. In Proceedings of the 2018 ACM SIGSAC Conference on Computer and Communications Security (CCS). ACM.
- Labs (2016) Geeknik Labs. 2016. Fuzzing Perl: A Tale of Two American Fuzzy Lops. http://www.geeknik.net/71nvhf1fp.
- lcamtuf (2005) lcamtuf. 2005. american fuzzy lop. http://lcamtuf.coredump.cx/afl/.
- Lemieux and Sen (2017) Caroline Lemieux and Koushik Sen. 2017. FairFuzz: Targeting Rare Branches to Rapidly Increase Greybox Fuzz Testing Coverage. CoRR abs/1709.07101 (2017).
- Li et al. (2017) Yuekang Li, Bihuan Chen, Mahinthan Chandramohan, Shang-Wei Lin, Yang Liu, and Alwen Tiu. 2017. Steelix: program-state based binary fuzzing. In Proceedings of the 2017 11th Joint Meeting on Foundations of Software Engineering (FSE). ACM.
- Peng et al. (2018) Hui Peng, Yan Shoshitaishvili, and Mathias Payer. 2018. T-Fuzz: fuzzing by program transformation. In 2018 IEEE Symposium on Security and Privacy (SP). IEEE.
- Pham et al. (2016) Van-Thuan Pham, Marcel Böhme, and Abhik Roychoudhury. 2016. Model-based Whitebox Fuzzing for Program Binaries. In Proceedings of the 31st IEEE/ACM International Conference on Automated Software Engineering (ASE). ACM.
- Rawat et al. (2017) Sanjay Rawat, Vivek Jain, Ashish Kumar, Lucian Cojocar, Cristiano Giuffrida, and Herbert Bos. 2017. Vuzzer: Application-aware evolutionary fuzzing. In Proceedings of the Network and Distributed System Security Symposium (NDSS).
- Rebert et al. (2014) Alexandre Rebert, Sang Kil Cha, Thanassis Avgerinos, Jonathan Foote, David Warren, Gustavo Grieco, and David Brumley. 2014. Optimizing Seed Selection for Fuzzing. In Proceedings of the 23rd USENIX Conference on Security Symposium (USENIX Security). USENIX Association.
- Schumilo et al. (2017) Sergej Schumilo, Cornelius Aschermann, Robert Gawlik, Sebastian Schinzel, and Thorsten Holz. 2017. kAFL: Hardware-Assisted Feedback Fuzzing for OS Kernels. In Proceedings of the 26rd USENIX Conference on Security Symposium (USENIX Security). USENIX Association.
- Seltzer and Yigit (1991) Margo I Seltzer and Ozan Yigit. 1991. A New Hashing Package for UNIX.. In USENIX Winter. USENIX.
- Seo and Kim (2014) Hyunmin Seo and Sunghun Kim. 2014. How we get there: A context-guided search strategy in concolic testing. In Proceedings of the 22nd ACM SIGSOFT International Symposium on Foundations of Software Engineering (FSE). ACM.
- Shoshitaishvili et al. (2016) Yan Shoshitaishvili, Ruoyu Wang, Christopher Salls, Nick Stephens, Mario Polino, Audrey Dutcher, John Grosen, Siji Feng, Christophe Hauser, Christopher Kruegel, and Giovanni Vigna. 2016. SoK: (State of) The Art of War: Offensive Techniques in Binary Analysis. In Proceedings of the 2016 IEEE Symposium on Security and Privacy (SP). IEEE.
- Stephens et al. (2016) Nick Stephens, John Grosen, Christopher Salls, Andrew Dutcher, Ruoyu Wang, Jacopo Corbetta, Yan Shoshitaishvili, Christopher Kruegel, and Giovanni Vigna. 2016. Driller: Augmenting Fuzzing Through Selective Symbolic Execution.. In Proceedings of the Network and Distributed System Security Symposium (NDSS).
- Szekeres (2017) László Szekeres. 2017. Memory corruption mitigation via hardening and testing. Ph.D. Dissertation. Stony Brook University.
- Wang et al. (2017) Junjie Wang, Bihuan Chen, Lei Wei, and Yang Liu. 2017. Skyfire: Data-driven seed generation for fuzzing. In Proceedings of the 2017 IEEE Symposium on Security and Privacy (SP). IEEE.
- Woo et al. (2013) Maverick Woo, Sang Kil Cha, Samantha Gottlieb, and David Brumley. 2013. Scheduling black-box mutational fuzzing. In Proceedings of the 2013 ACM SIGSAC conference on Computer and Communications Security (CCS). ACM.
- Xu et al. (2017) Wen Xu, Sanidhya Kashyap, Changwoo Min, and Taesoo Kim. 2017. Designing New Operating Primitives to Improve Fuzzing Performance. In Proceedings of the 2017 ACM SIGSAC Conference on Computer and Communications Security (CCS). ACM.
- Zhang et al. (2018) Gen Zhang, Xu Zhou, Yingqi Luo, Xugang Wu, and Erxue Min. 2018. PTfuzz: Guided Fuzzing with Processor Trace Feedback. IEEE Access (2018).
Appendix A Supplementary Figures and Evaluation Data