Different Signatures of Chromospheric Evaporation
in Two Solar Flares Observed with IRIS
Abstract
We present different signatures of chromospheric evaporation in two solar flares observed by the Interface Region Imaging Spectrograph (IRIS). In the B1.6 flare on 2016 December 6 (SOL2016-12-06T10:40), the transition region Si iv line and the chromospheric C ii and Mg ii lines show blueshifts with low velocities up to 20 km s-1 at the flare loop footpoints in the rise phase, indicative of a gentle chromospheric evaporation. While in the C1.6 flare on 2015 December 19 (SOL2015-12-19T10:51), the Si iv, C ii, and Mg ii lines exhibit redshifts with velocities from several to tens of km s-1 at the footpoints, which might suggest an explosive chromospheric evaporation. Explosive evaporation has been observed in many flares that were captured by IRIS; however, gentle evaporation, especially manifested as blueshifts in the cool Si iv, C ii, and Mg ii lines, has scarcely been reported. Our results bring some new insights into chromospheric evaporation in the IRIS era.
1 Introduction
Chromospheric evaporation refers to drastic mass motions as a result of rapid energy deposition (or plasma heating) in the dense chromospheric layer during solar flares. From a modeling perspective, there are two kinds of dynamic responses of the solar atmosphere to the local plasma heating mainly depending on the heating flux of the electron beam (Fisher et al., 1985a, b, c). For electron beams with an energy flux 1010 erg cm-2 s-1, the heated plasma expands upward at a relatively low velocity (tens of km s-1) without significant downflows, which is called “gentle evaporation”. When the energy flux reaches 31010 erg cm-2 s-1, an overpressure causes not only upflows of hot plasma at hundreds of km s-1 but also downflows of cooler material (or chromospheric condensation) at tens of km s-1. This process is referred to as “explosive evaporation”. Both types of chromospheric evaporation are confirmed in observations (e.g., Milligan et al. 2006a, b).
Chromospheric evaporation can be well diagnosed through spectroscopic observations. For a gentle evaporation, the upgoing plasma causes blueshifts (or blueshifted components) in some chromospheric lines and/or spectral lines formed above the chromosphere. While in an explosive evaporation, the upward mass motions generate blueshifts (or blueshifted components) usually in hot coronal lines, and the downward moving plasma produces redshifts (or red-wing enhancements) in cool chromospheric or transition region lines. Blueshifts/redshifts due to chromospheric evaporation/condensation have been reported in a large number of studies using spectroscopic data from different instruments. Early observations from the Bent and Bragg Crystal Spectrometer (BCS) on board the Solar Maximum Mission and Yohkoh/BCS detected blueshifted components at a few hundreds of km s-1 in the Ca xix 3.18 Å line (e.g., Doschek et al. 1980; Antonucci et al. 1982; Antonucci & Dennis 1983; Canfield et al. 1990; Wülser et al. 1994; Ding et al. 1996). Blueshifted line profiles of Fe xix 592.23 Å with velocities from tens to hundreds of km s-1 were observed by the Coronal Diagnostic Spectrometer (CDS) on board the Solar and Heliospheric Observatory (e.g., Brosius 2003; Teriaca et al. 2003; Brosius & Phillips 2004; Harra et al. 2005; Del Zanna et al. 2006; Teriaca et al. 2006). Using CDS data, some redshifts at tens of km s-1 were observed in the chromospheric line of He i 522.21 Å or 584.33 Å (e.g., Del Zanna et al. 2006; Milligan et al. 2006a) and the transition region O v 629.73 Å line (Czaykowska et al., 1999; Kamio et al., 2005; Del Zanna et al., 2006; Milligan et al., 2006a). Similar redshifts were also detected in the chromospheric He ii 256.32 Å line and the transition region O vi 184.12 Å line from the Extreme-ultraviolet (EUV) Imaging Spectrometer (EIS) on board Hinode (Milligan & Dennis, 2009; Watanabe et al., 2010; Li & Ding, 2011; Doschek et al., 2013; Young et al., 2013; Li et al., 2015b). With a good temperature coverage, EIS observed not only redshifts (or multiple redshifted components) but also blueshifts (or blueshifted components) indicative of explosive evaporation in major flares as well as in microflares (Chen & Ding, 2010; Watanabe et al., 2010; Li & Ding, 2011; Doschek et al., 2013; Young et al., 2013; Li et al., 2015b; Brosius et al., 2016). In particular, the velocities of blueshifts and redshifts were found to scale with the temperature (Milligan & Dennis, 2009; Chen & Ding, 2010; Watanabe et al., 2010; Young et al., 2013).
In recent years, high spatial (subarcsecond) and temporal (several seconds) resolution observations from the Interface Region Imaging Spectrograph (IRIS; De Pontieu et al. 2014) have revealed some new results for chromospheric evaporation. Entirely blueshifted Fe xxi 1354.08 Å line profiles indicating evaporation flows have been observed in many IRIS flares (Tian et al., 2014; Battaglia et al., 2015; Brosius & Daw, 2015; Graham & Cauzzi, 2015; Li et al., 2015a, b; Polito et al., 2015, 2016; Sadykov et al., 2015, 2016; Young et al., 2015; Dudík et al., 2016; Zhang et al., 2016a; Li et al., 2017a, b, 2018). This may suggest that the subarcsecond resolution of IRIS is sufficient to resolve the evaporation flow (Brosius & Daw, 2015; Li et al., 2015b; Tian et al., 2015; Polito et al., 2016). Redshifts (or red-wing enhancements) caused by chromospheric condensation were also detected in the chromospheric lines of Mg ii 2803.52 Å (or 2796.35 Å and 2791.59 Å) and C ii 1335.71 Å (or 1334.53 Å) and the transition region line of Si iv 1402.77 Å (or 1393.76 Å) (e.g., Tian et al. 2014; Brosius & Daw 2015; Li et al. 2015b; Graham & Cauzzi 2015; Kerr et al. 2015; Zhang et al. 2016b; Brosius & Inglis 2017, 2018; Tian & Chen 2018). It should be mentioned that the cool Si iv, C ii, and Mg ii lines usually show redshifts at flare footpoints, which suggests an explosive evaporation, in particular, when blueshifts in the hot Fe xxi line are also observed. Table 1 gives the Doppler shift measurements related to chromospheric evaporation using IRIS data from previous studies. It is seen that explosive evaporation is detected in nearly all these flares above C-class. By contrast, gentle evaporation, especially manifested as blueshifts in the cool Si iv, C ii, and Mg ii lines, has rarely been reported.
| Flare | Date | Cadence | Blueshifts | Redshifts | References |
|---|---|---|---|---|---|
| Class | (s) | (Evaporation) | (Condensation) | ||
| C1.6 | 2014-04-19 | 31 | Fe xxi | Si iv, C ii, Mg ii | Tian et al. (2014) |
| C1.9 | 2014-11-19 | 9.5 | - | Si iv, C ii, Mg ii | Warren et al. (2016) |
| C3.1 | 2014-03-15 | 16.5 | Fe xxi | Si iv, C ii | Brosius & Inglis (2017) |
| C3.1 | 2015-10-16 | 6 | - | Si iv | Zhang et al. (2016b) |
| C4.2 | 2015-10-16 | 9.4 | Fe xxi | Si iv | Zhang et al. (2016a) |
| C6.5 | 2014-02-03 | 75 | Fe xxi | - | Polito et al. (2015) |
| M1.0 | 2014-06-12 | 21 | Fe xxi | C ii | Sadykov et al. (2015, 2016) |
| M1.1 | 2014-09-06 | 9.5 | Fe xxi | Si iv | Tian et al. (2015) |
| M1.6 | 2015-03-12 | 5.2 | Fe xxi | Si iv, Mg ii | Tian & Chen (2018) |
| Fe xxi | Si iv | Brannon (2016) | |||
| M1.8 | 2014-02-13 | 42 | - | Mg ii | Kerr et al. (2015) |
| M2.3 | 2014-11-09 | 37 | Fe xxi | Si iv, C ii, Mg ii | Li et al. (2017b) |
| M3.7 | 2017-09-09 | 9.4 | Fe xxi | Si iv, C ii, Mg ii | Brosius & Inglis (2018) |
| M7.1 | 2014-10-27 | 16.2 | Fe xxi | Si iv | Li et al. (2017a, 2018) |
| M7.3 | 2014-04-18 | 9.4 | Fe xxi | Si iv, O iv, C i | Brosius & Daw (2015) |
| - | Si iv | Brannon et al. (2015) | |||
| X1.0 | 2014-03-29 | 75 | Fe xxi | Si iv, C ii, Mg ii | Battaglia et al. (2015) |
| Fe xxi | Si iv, C ii, Mg ii | Li et al. (2015b) | |||
| Fe xxi | - | Young et al. (2015) | |||
| - | Fe ii | Kowalski et al. (2017) | |||
| X1.6 | 2014-09-10 | 9.4 | Fe xxi | Si iv | Tian et al. (2015) |
| Fe xxi | Mg ii | Graham & Cauzzi (2015) | |||
| Fe xxi | - | Dudík et al. (2016) | |||
| Fe xxi | C i | Li et al. (2015a) | |||
| X1.6 | 2014-10-22 | 131 | Fe xxi | C i | Li et al. (2015a) |
| Fe xxi | Si iv | Lee et al. (2017) | |||
| X2.0 | 2014-10-27 | 26 | Fe xxi | Si iv | Polito et al. (2016) |
The hyphen “-” means that the authors did not include any hot lines (i.e., Fe xxi) or cool lines (such as Si iv) from IRIS in their study.
In this paper, we present observational signatures of explosive as well as gentle chromospheric evaporation in two flare events with IRIS spectroscopic data. To our best knowledge, this is the first time to report a gentle evaporation, especially manifested as blueshifts in the cool Si iv, C ii, and Mg ii lines, from the high cadence observations of IRIS.
2 Instruments and Data Reduction
The observational data we used here are mainly from IRIS, whose spatial, temporal, and spectral (or velocity) resolution can be as high as , 2 s, and 1 km s-1, respectively. IRIS provides slit-jaw images (SJIs) in four different passbands (1330, 1400, 2796, and 2832 Å) as well as spectra in the near-ultraviolet (NUV, 2783–2834 Å) and far-ultraviolet (FUV, 1332–1358 Å and 1389–1407 Å) wavelengths with either a raster scan or sit-and-stare mode. The NUV and FUV passbands contain some important spectral lines, such as Mg ii h at 2803.52 Å and Mg ii k at 2796.35 Å, C ii at 1334.53 Å and 1335.71 Å, Si iv at 1393.76 Å and 1402.77 Å, and Fe xxi at 1354.08 Å. We focus on the Si iv 1402.77 Å (with a formation temperature of 104.8 K), C ii 1335.71 Å111Note that the C ii 1335.71 Å line is blended with another C ii 1335.66 Å line (Judge et al., 2003). However, we still choose this line rather than the C ii 1334.53 Å line because the former one is stronger and thus has a better signal-to-noise ratio than the latter one, especially in small flares. The effect of the blending on line parameters is talked about below. (104.3 K), and Mg ii k 2796.35 Å (104.0 K) lines in the present study. The IRIS level 2 data are used here, which have been subtracted for dark current and corrected for flat field, geometrical distortion, and wavelength.
Regarding the spectral analysis, since the observed Si iv line profiles show a good Gaussian shape in general, we use a single Gaussian fitting to derive the total intensity, Doppler velocity, and width of this line. For the optically thick C ii and Mg ii lines, a moment analysis is performed to the observed line profiles. When measuring the Doppler velocity, we use the average line center over the flaring region as the reference wavelength (because outside the flaring region for our events here, the Si iv and C ii lines have a very low signal-to-noise ratio). The obtained reference wavelengths are 1402.771 Å, 1335.706 Å, and 2796.357 Å for Si iv, C ii, and Mg ii, respectively, which are similar to the values used in some previous studies (e.g., 1402.7750.020 Å for Si iv in Jeffrey et al. 2018, and 1402.78470.0309 Å for Si iv and 1335.70590.0267 Å for C ii in Brosius & Inglis 2018). The uncertainties in measured Doppler velocities are estimated to be about 6, 5222This includes the uncertainty coming from the C ii line blending, which is about 1 km s-1., and 3 km s-1 for the Si iv, C ii, and Mg ii lines, respectively.
We also employ the EUV images at 131 Å observed from the Atmospheric Imaging Assembly (AIA; Lemen et al. 2012) on board the Solar Dynamics Observatory (SDO), which represent the emission primarily from the hot plasma at a temperature of 11 MK during flares. AIA observes EUV and UV images in multiple channels with a spatial resolution of or pixel-1 and a cadence of 12 s or 24 s. Moreover, GOES provides the soft X-ray 1–8 Å fluxes for the two flare events that are described in the following Section.
3 Observations and Results
3.1 The B1.6 Flare on 2016 December 6
3.1.1 Observation Overview
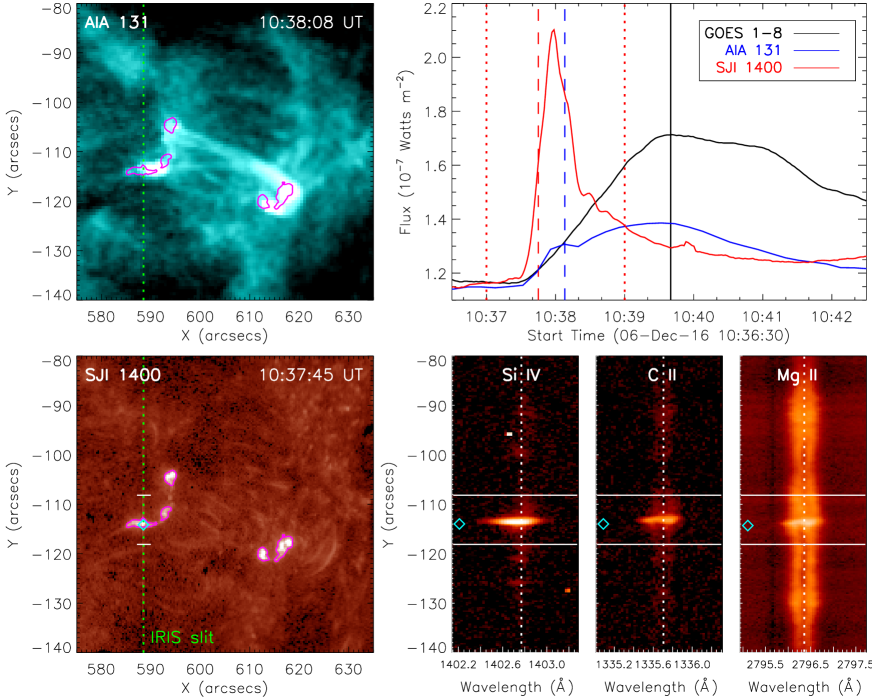
The B1.6 microflare on 2016 December 6 has been reported by Jeffrey et al. (2018) on the topic of lower atmosphere turbulence deduced mainly from the Si iv line at flare ribbons, which will be discussed in Section 4. The observations of this flare is summarized in Figure 1. Based on the GOES 1–8 Å soft X-ray flux, the flare started at 10:37:00 UT, peaked at 10:39:40 UT, and ended around 10:43:10 UT, lasting for only several minutes. Using a sit-and-stare mode, IRIS obtained the spectra of this flare for the whole period with an unprecedented high cadence of 1.7 s. SJIs were also recorded but only in 1400 Å with a cadence of 2 s and a pixel scale of . From the AIA 131 Å image during the rise phase of the flare, we can clearly see that the flare loops filled with hot (11 MK) plasma map to some bright footpoints (the purple contours) in the SJI 1400 Å passband. The IRIS slit cuts across some of the footpoints (denoted by the cyan diamond) where the spectra of Si iv, C ii, and Mg ii are fairly bright and show some blueshifts.
3.1.2 Blueshifts in the Si iv, C ii, and Mg ii Lines
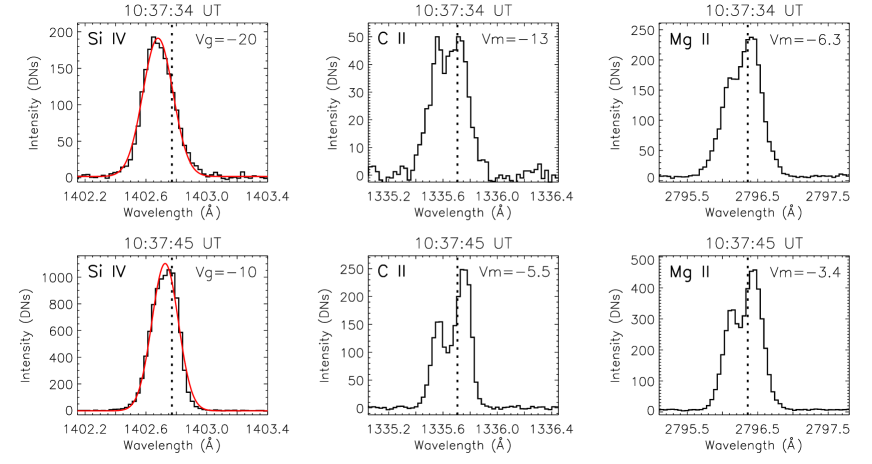
Figure 2 shows the Si iv, C ii, and Mg ii line profiles at the footpoint location denoted by the diamond (see Figure 1) for two times. It is seen that all the three lines are blueshifted, especially at an earlier time (10:37:34 UT, top panels). The blueshift velocities are measured to be 20, 13, and 6.3 km s-1 for the Si iv, C ii, and Mg ii lines, respectively, namely decreasing as the line formation temperature decreases. A few seconds later (10:37:45 UT, bottom panels), all the velocities decrease nearly by half. Note that some of the Mg ii (and also C ii) line profiles are almost singly peaked, i.e., without a central reversal, which is a common feature for flaring footpoints.
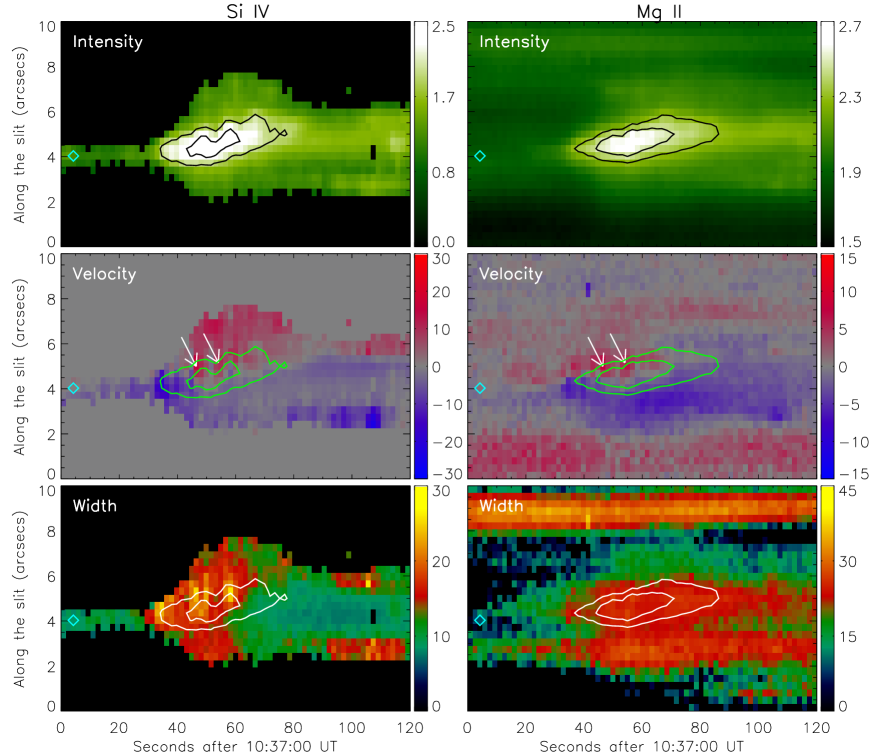
The spatio-temporal variations of the total intensity, Doppler velocity, and line width of the Si iv and Mg ii lines are plotted in Figure 3. From the intensity map we can see that the bright footpoints (the contours) show some apparent motion toward the north. Interestingly, at the footpoints (e.g., the ones denoted by the diamond), both of the Si iv and Mg ii lines exhibit blueshifts particularly at an early time. Such a blueshift in cool lines has scarcely been reported before. A similar result is also obtained in the C ii line as can be seen in Figure 4. In addition, these blueshifts are accompanied by relatively large line widths. Note that some of the pixels also show redshifts and large line widths, which, however, are mostly located outside the core region of the bright footpoints.
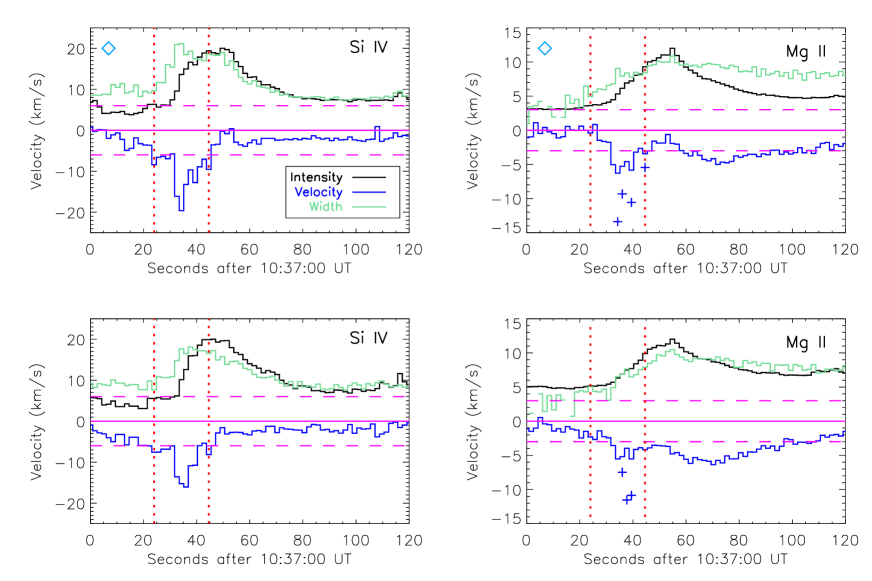
Figure 4 plots the temporal evolution of the total intensity, Doppler velocity, and line width at the diamond location (top panels) and its adjacent location (bottom panels). It is seen that, as the intensity increases, the Si iv and Mg ii (and also C ii) lines begin to show some blueshifts with velocities up to 20 km s-1, as well as large line widths, at both locations. The blueshift velocity reaches its maximum a few seconds earlier than the intensity. The deduced blueshifts above the uncertainty level in all of the three lines last for only about 10–20 s (from 10:37:24 UT to 10:37:45 UT, denoted by the two vertical dotted lines). Note that the Mg ii line still exhibits notable blueshifts when its intensity decreases.
3.1.3 Interpretation: Signatures of Gentle Chromospheric Evaporation
The blueshifts, indicative of upflows, in the Si iv, C ii, and Mg ii lines at the flare footpoints are consistent with the gentle evaporation scenario (Fisher et al., 1985a; Milligan et al., 2006b), in which the plasma in the upper chromosphere and above moves upward with a relatively low velocity. In this microflare, all the three lines formed in the chromosphere or transition region are blueshifted with velocities up to only 20 km s-1 when the line intensity increases. After the intensity peak, only the cooler Mg ii line continues showing blueshifts. A possible reason is that at a later time, when the heating rate becomes smaller, the evaporated plasma is not heated to a high temperature as visible in the Si iv and C ii lines. We also notice that all the blueshifts are accompanied by relatively large line widths, which is often an observational signature for the evaporation plasma (Li et al., 2015b, 2017b). Note that, besides gentle evaporation, we also find evidence of explosive evaporation, i.e., redshifts of the lines at some specific footpoint locations (see the white arrows in Figure 3), where the heating, reflected from the line intensity, seems to be stronger than the flaring regions that exhibit blueshifts.
3.2 The C1.6 Flare on 2015 December 19
3.2.1 Observation Overview
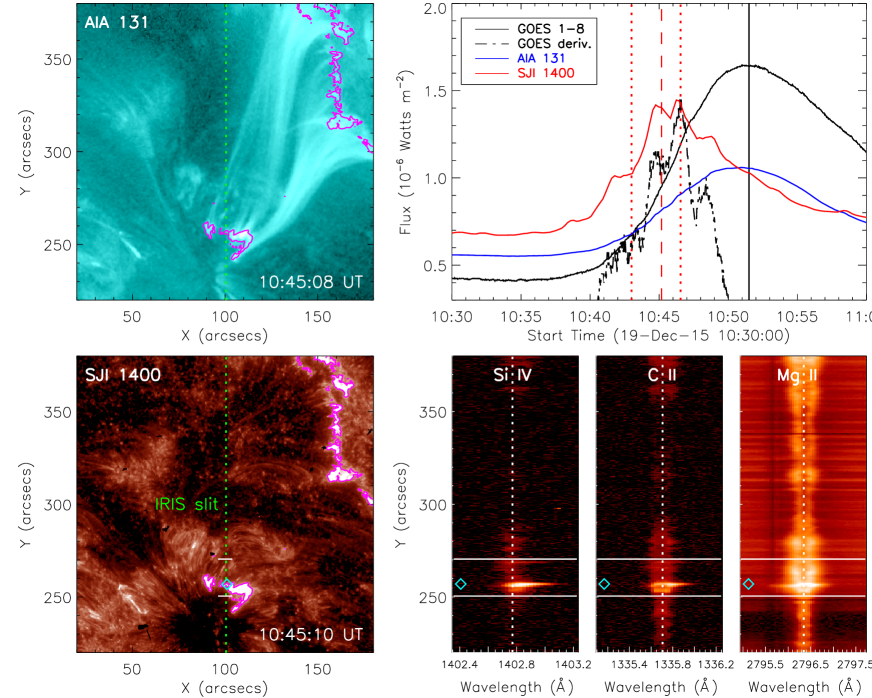
Figure 5 gives an observation overview of the C1.6 flare on 2015 December 19. This flare started at 10:40 UT and peaked around 10:51 UT based on the GOES 1–8 Å soft X-ray flux. IRIS captured the whole flare period with a sit-and-stare mode that yields spectral data with a very high cadence of 3 s, and also recorded SJIs in 1400, 1330, 2796, and 2832 Å passbands with a cadence of 13 s and a pixel scale of . Here we only focus on part of the rise phase from 10:43 UT to 10:46 UT (denoted by the two vertical dotted lines in the top right panel of Figure 5). After 10:47 UT, there is a severe contamination in the IRIS data due to some compact cosmic rays. From the AIA 131 Å image, we can see that some flare loops filled with hot (11 MK) plasma show up in the rise phase with their footpoints (or flare ribbons) clearly visible in the SJI 1400 Å passband (see the purple contours). The IRIS slit cuts across one of the ribbons, as denoted by the cyan diamond, where the Si iv, C ii, and Mg ii lines show significant emissions with some redshifts.
3.2.2 Redshifts in the Si iv, C ii, and Mg ii Lines
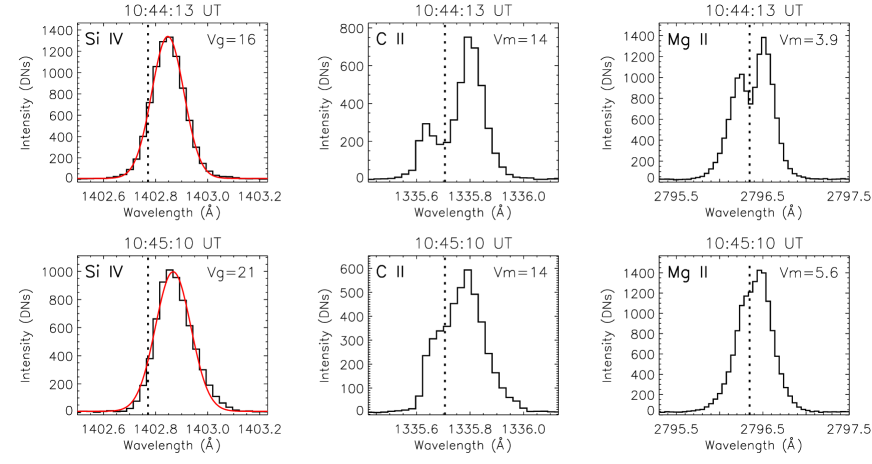
Figure 6 shows the Si iv, C ii, and Mg ii line profiles at the footpoint location denoted by the diamond (see Figure 5) for two times. It is seen that all the three lines are redshifted or show a red wing enhancement. At an earlier time (10:44:13 UT, top panels), the redshift velocities are measured to be 16, 14, and 3.9 km s-1 for the Si iv, C ii, and Mg ii lines, respectively. The velocities again show a decreasing trend as the temperature decreases. About 1 minute later (10:45:10 UT, bottom panels), the redshift velocities of Si iv and Mg ii increase to 21 and 5.6 km s-1, respectively. Note that some of the Mg ii and C ii line profiles are singly peaked without a central reversal.
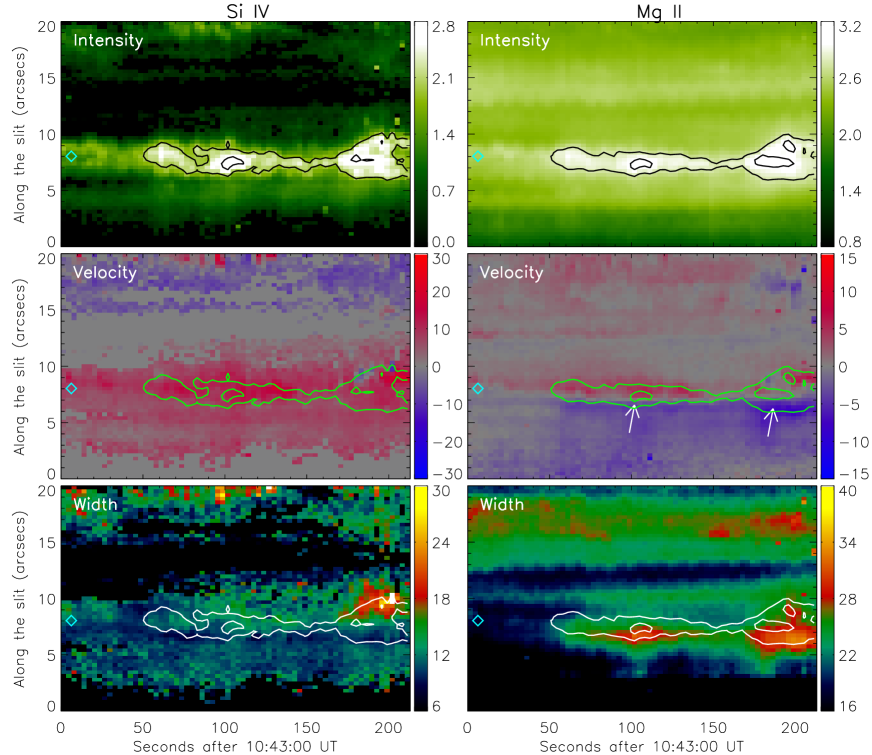
The spatio-temporal variations of the total intensity, Doppler velocity, and line width of Si iv and Mg ii are plotted in Figure 7. It is seen that the ribbon crossed by the IRIS slit stays there but brightens up repetitively. Around the footpoint location marked by the diamond, both of the Si iv and Mg ii lines exhibit redshifts with a velocity of several tens of km s-1, which has been reported in many studies before (see Table 1). A similar result is also shown in the C ii line as can be seen in Figure 8. Note that, at some footpoints, the Mg ii line displays weak blueshifts (denoted by the white arrows) while the Si iv line still shows redshifts, which will be discussed in Section 3.2.3.
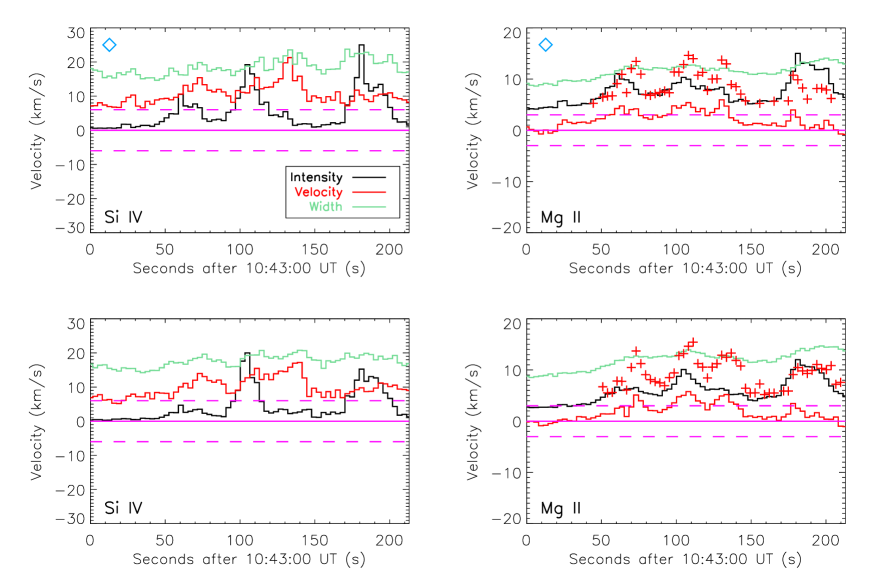
Figure 8 plots the temporal evolution of the total intensity, Doppler velocity, and line width at the diamond location (top panels) and its adjacent location (bottom panels). It is seen that, as the intensity increases, the Si iv and Mg ii (and also C ii) lines begin to show some redshifts with velocities up to 20 km s-1 at both locations. The intensity and Doppler velocity (and also line width) seem to exhibit an oscillation pattern, although these quantities do not reach the maximum values at the same time.
3.2.3 Interpretation: Signatures of Explosive Chromospheric Evaporation
The redshifts, indicative of downflows, in the Si iv, C ii, and Mg ii lines at the flare footpoints are supposed to be signatures of chromospheric condensation, which is usually associated with an explosive evaporation (Fisher et al., 1985a; Milligan et al., 2006a). In this scenario, the chromosphere is unable to fully radiate away the flare energy deposited there resulting in an overpressure which causes the local plasma going downward. In such a case, the cool lines are seen to be redshifted. We also check the hot emission line of Fe xxi 1354.08 Å (10 MK), which is usually used to study the evaporation signatures. However, no visible Fe xxi emission is found in this microflare. It seems that the flare is not strong enough to produce sufficient Fe xxi photons within a short exposure time of 2 s. Nevertheless, we do see some hot (11 MK) plasma in AIA 131 Å images (see the top left panel in Figure 5), which fills the flare loop quickly after the footpoints brighten up. In fact, the time profile of the UV emission at the footpoints matches the derivative of the GOES 1–8 Å flux very well (see the top right panel of Figure 5). This relationship is similar to the Neupert effect (Neupert, 1968) that is often quoted as a manifestation of chromospheric evaporation driven by nonthermal electrons (e.g., Dennis & Zarro 1993; Tian et al. 2015). In this flare, the redshifts of the Si iv, C ii, and Mg ii lines display an oscillation pattern, which may imply a multi-episode explosive evaporation caused by episodic heating (Tian & Chen, 2018). There is also a possibility that some redshifts of the Si IV line, mainly those strong ones after the episodic intensity peaks, could be caused by cooling downflows (Tian & Chen, 2018). However, we think that the condensation scenario is mostly valid for this flare. Note that we also detect blueshifts in the cooler Mg ii line (with a central reversal in the line core) but redshifts in the Si iv (and also C ii) lines at some footpoints. This is similar to the finding by Tei et al. (2018) who explained it as a result of cool plasma lifted up by evaporated hot plasma due to the penetration of nonthermal electrons into the chromosphere.
4 Summary and Discussions
In this paper, we present different signatures of chromospheric evaporation in two flare events observed by IRIS with an unprecedented high cadence. In the B1.6 flare, the cool Si iv, C ii, and Mg ii lines show blueshifts with the velocities up to 20 km s-1 at the footpoints, consistent with a gentle evaporation scenario. While in the C1.6 flare, all the three lines exhibit redshifts with velocities from several to tens of km s-1, implying an explosive evaporation. Explosive evaporation has been detected in lots of flares that were observed by IRIS. However, this is the first time, to the best of our knowledge, to report a gentle evaporation in IRIS flares, especially manifested as blueshifts appearing simultaneously in the Si iv, C ii, and Mg ii lines.
Blueshifts (or bulk velocities) as well as large line widths (or line broadenings) in the Si iv line have been observed at the footpoints in the same B1.6 microflare by Jeffrey et al. (2018). However, the authors focused on the line broadenings at the flare onset, which oscillate two or three times with a period of 10 s, and interpreted them as a result of turbulence in the lower solar atmosphere contributing to plasma heating. Here, we do find that the Si iv line widths (maybe also blueshifts) exhibit a weak fluctuation pattern at some footpoints, such as the diamond location as shown in the top left panel of Figure 4. However, such fluctuation behavior in line widths (or blueshifts) do not show at some other footpoints, for instance, the slit pixel adjacent to the diamond location (the bottom left panel of Figure 4). More importantly, the notable blueshifts in our study are well associated with enhanced intensities indicative of plasma heating. This is different from the case in Jeffrey et al. (2018) that the blueshifts as well as line broadenings appear well before the intensity rises.
Gentle evaporation has been observed in a few flares by EIS (e.g., Li & Ding 2011), CDS (e.g., Milligan et al. 2006b), and some other instruments (e.g., Schmieder et al. 1990), though most of the studies were based on spectral data at only one time instant and at some of the footpoints. It has rarely been reported by using the IRIS data in previous studies possibly for the two following reasons. First, the majority of the flares that were selected for study on chromospheric evaporation are large ones (at least two thirds are M-class or above as seen in Table 1), which are more likely to produce an explosive evaporation according to numerical simulations (e.g., Fisher et al. 1985a). Second, for the weak flares (i.e., C-class), the cadence of IRIS spectra (6 s as seen in Table 1) seems not high enough to capture the short-lived gentle evaporation process (say, several seconds). Moreover, a gentle evaporation may only appear at a small part of footpoint pixels, which is not easy to be identified in most cases. In fact, in the microflare under study, there exist some footpoint pixels showing signatures of explosive evaporation, just like the footpoints of the C1.6 flare. In the future, it is worth checking more low-class flares observed by IRIS with a high cadence (say, 5 s) to study the signatures of chromospheric evaporation, particularly combined with radiative hydrodynamic simulations.
Blueshifts in the Si iv line caused by chromospheric evaporation have actually been reproduced in radiative hydrodynamic simulations (Polito et al., 2018; Kerr et al., 2019). In particular, it is found that the lifetime of Si iv blueshifts becomes shorter when the heating flux is increased. For example, Kerr et al. (2019) showed that, assuming a constant heating rate for 10 s, the Si iv line exhibits blueshifts for more than 10 s in reletively weak heating cases (i.e., heating fluxes of , , and erg cm-2 s-1), for 10 s in moderate heating cases (heating fluxes of and erg cm-2 s-1), and for only 5 s in a strong heating case (heating flux of erg cm-2 s-1). In the latter one, the Si iv line can also show redshifts. These indicate that in small flares, the Si iv line blueshifts could be more likely observed than in large flares. This also confirms the general point of view that gentle evaporation more probably appears in small flares, while explosive evaporation more likely shows up in large flares. Our observational results are consistent with this picture.
Overall, the different observational signatures of chromospheric evaporation in these two flare events bring some new insights into chromospheric evaporation in the IRIS era. In particular, we report blueshifts in the Si iv line that are rarely observed by IRIS. Such line blueshifts can be well reproduced by the state-of-the-art radiative hydrodynamic simulations and thus provide observational support to the present flare heating models. We should also point out that, for the flares under study, the Si iv line profiles are well Gaussian shaped and are usually blueshifted or redshifted as a whole at the footpoints, while this line shows only a red asymmetry (a rest component plus a redshifted component) in many other flares (e.g., Li et al. 2015b; Tian et al. 2015). Such different spectral features have some implications on the flare heating and line formation processes that will be explored using radiative hydrodynamic simulations in the future.
References
- Antonucci et al. (1982) Antonucci, E., et al. 1982, Sol. Phys., 78, 107
- Antonucci & Dennis (1983) Antonucci, E., & Dennis, B. R. 1983, Sol. Phys., 86, 67
- Battaglia et al. (2015) Battaglia, M., Kleint, L., Krucker, S., & Graham, D. 2015, ApJ, 813, 113
- Brannon (2016) Brannon, S. R. 2016, ApJ, 833, 101
- Brannon et al. (2015) Brannon, S. R., Longcope, D. W., & Qiu, J. 2015, ApJ, 810, 4
- Brosius (2003) Brosius, J. W. 2003, ApJ, 586, 1417
- Brosius & Daw (2015) Brosius, J. W., & Daw, A. N. 2015, ApJ, 810, 45
- Brosius et al. (2016) Brosius, J. W., Daw, A. N., & Inglis, A. R. 2016, ApJ, 830, 101
- Brosius & Inglis (2017) Brosius, J. W., & Inglis, A. R. 2017, ApJ, 848, 39
- Brosius & Inglis (2018) Brosius, J. W., & Inglis, A. R. 2018, ApJ, 867, 85
- Brosius & Phillips (2004) Brosius, J. W., & Phillips, K. J. H. 2004, ApJ, 613, 580
- Canfield et al. (1990) Canfield, R. C., Metcalf, T. R., Zarro, D. M., & Lemen, J. R. 1990, ApJ, 348, 333
- Chen & Ding (2010) Chen, F., & Ding, M. D. 2010, ApJ, 724, 640
- Czaykowska et al. (1999) Czaykowska, A., de Pontieu, B., Alexander, D., & Rank, G. 1999, ApJ, 521, L75
- De Pontieu et al. (2014) De Pontieu, B., Title, A. M., Lemen, J. R., et al. 2014, Sol. Phys., 289, 2733
- Del Zanna et al. (2006) Del Zanna, G., Berlicki, A., Schmieder, B., & Mason, H. E. 2006, Sol. Phys., 234, 95
- Dennis & Zarro (1993) Dennis, B. R., & Zarro, D. M. 1993, Sol. Phys., 146, 177
- Ding et al. (1996) Ding, M. D., Watanabe, T., Shibata, K., et al. 1996, ApJ, 458, 391
- Doschek et al. (1980) Doschek, G. A., Feldman, U., Kreplin, R. W., & Cohen, L. 1980, ApJ, 239, 725
- Doschek et al. (2013) Doschek, G. A., Warren, H. P., & Young, P. R. 2013, ApJ, 767, 55
- Dudík et al. (2016) Dudík, J., Polito, V., Janvier, M., et al. 2016, ApJ, 823, 41
- Fisher et al. (1985a) Fisher, G. H., Canfield, R. C., & McClymont, A. N. 1985a, ApJ, 289, 414
- Fisher et al. (1985b) Fisher, G. H., Canfield, R. C., & McClymont, A. N. 1985b, ApJ, 289, 425
- Fisher et al. (1985c) Fisher, G. H., Canfield, R. C., & McClymont, A. N. 1985c, ApJ, 289, 434
- Graham & Cauzzi (2015) Graham, D. R., & Cauzzi, G. 2015, ApJ, 807, L22
- Harra et al. (2005) Harra, L. K., Démoulin, P., Mandrini, C. H., et al. 2005, A&A, 438, 1099
- Jeffrey et al. (2018) Jeffrey, N. L. S., Fletcher, L., Labrosse, N., & Simões, P. J. A. 2018, Science Advances, 4, 2794
- Judge et al. (2003) Judge, P. G., Carlsson, M., & Stein, R. F. 2003, ApJ, 597, 1158
- Kamio et al. (2005) Kamio, S., Kurokawa, H., Brooks, D. H., Kitai, R., & UeNo, S. 2005, ApJ, 625, 1027
- Kerr et al. (2019) Kerr, G. S., Carlsson, M., Allred, J. C., Young, P. R., & Daw, A. N. 2019, ApJ, 871, 23
- Kerr et al. (2015) Kerr, G. S., Simões, P. J. A., Qiu, J., & Fletcher, L. 2015, A&A, 582, A50
- Kowalski et al. (2017) Kowalski, A. F., Allred, J. C., Daw, A., Cauzzi, G., & Carlsson, M. 2017, ApJ, 836, 12
- Lee et al. (2017) Lee, K.-S., Imada, S., Watanabe, K., Bamba, Y., & Brooks, D. H. 2017, ApJ, 836, 150
- Lemen et al. (2012) Lemen, J. R., Title, A. M., Akin, D. J., et al. 2012, Sol. Phys., 275, 17
- Li et al. (2017a) Li, D., Ning, Z. J., Huang, Y., & Zhang, Q. M. 2017a, ApJ, 841, L9
- Li et al. (2015a) Li, D., Ning, Z. J., & Zhang, Q. M. 2015a, ApJ, 813, 59
- Li et al. (2018) Li, D., Li, Y., Su, W., Huang, Y., & Ning, Z. 2018, ApJ, 854, 26
- Li & Ding (2011) Li, Y., & Ding, M. D. 2011, ApJ, 727, 98
- Li et al. (2015b) Li, Y., Ding, M. D., Qiu, J., & Cheng, J. X. 2015b, ApJ, 811, 7
- Li et al. (2017b) Li, Y., Kelly, M., Ding, M. D., et al. 2017b, ApJ, 848, 118
- Milligan & Dennis (2009) Milligan, R. O., & Dennis, B. R. 2009, ApJ, 699, 968
- Milligan et al. (2006a) Milligan, R. O., Gallagher, P. T., Mathioudakis, M., et al. 2006a, ApJ, 638, L117
- Milligan et al. (2006b) Milligan, R. O., Gallagher, P. T., Mathioudakis, M., & Keenan, F. P. 2006b, ApJ, 642, L169
- Neupert (1968) Neupert, W. M. 1968, ApJ, 153, L59
- Polito et al. (2016) Polito, V., Reep, J. W., Reeves, K. K., et al. 2016, ApJ, 816, 89
- Polito et al. (2015) Polito, V., Reeves, K. K., Del Zanna, G., Golub, L., & Mason, H. E. 2015, ApJ, 803, 84
- Polito et al. (2018) Polito, V., Testa, P., Allred, J., et al. 2018, ApJ, 856, 178
- Sadykov et al. (2016) Sadykov, V. M., Kosovichev, A. G., Sharykin, I. N., et al. 2016, ApJ, 828, 4
- Sadykov et al. (2015) Sadykov, V. M., Vargas Dominguez, S., Kosovichev, A. G., et al. 2015, ApJ, 805, 167
- Schmieder et al. (1990) Schmieder, B., Malherbe, J. M., Simnett, G. M., Forbes, T. G., & Tandberg-Hanssen, E. 1990, ApJ, 356, 720
- Tei et al. (2018) Tei, A., Sakaue, T., Okamoto, T. J., et al. 2018, PASJ, 70, 100
- Teriaca et al. (2003) Teriaca, L., Falchi, A., Cauzzi, G., et al. 2003, ApJ, 588, 596
- Teriaca et al. (2006) Teriaca, L., Falchi, A., Falciani, R., Cauzzi, G., & Maltagliati, L. 2006, A&A, 455, 1123
- Tian & Chen (2018) Tian, H., & Chen, N.-H. 2018, ApJ, 856, 34
- Tian et al. (2014) Tian, H., Li, G., Reeves, K. K., et al. 2014, ApJ, 797, L14
- Tian et al. (2015) Tian, H., Young, P. R., Reeves, K. K., et al. 2015, ApJ, 811, 139
- Warren et al. (2016) Warren, H. P., Reep, J. W., Crump, N. A., & Simões, P. J. A. 2016, ApJ, 829, 35
- Watanabe et al. (2010) Watanabe, T., Hara, H., Sterling, A. C., & Harra, L. K. 2010, ApJ, 719, 213
- Wülser et al. (1994) Wülser, J.-P., et al. 1994, ApJ, 424, 459
- Young et al. (2013) Young, P. R., Doschek, G. A., Warren, H. P., & Hara, H. 2013, ApJ, 766, 127
- Young et al. (2015) Young, P. R., Tian, H., & Jaeggli, S. 2015, ApJ, 799, 218
- Zhang et al. (2016a) Zhang, Q. M., Li, D., Ning, Z. J., et al. 2016a, ApJ, 827, 27
- Zhang et al. (2016b) Zhang, Q. M., Li, D., & Ning, Z. J. 2016b, ApJ, 832, 65