Quantitative understanding of negative thermal expansion in scandium trifluoride from neutron total scattering measurements
Abstract
Negative thermal expansion (NTE)—the phenomenon where some materials shrink rather than expand when heated—is both intriguing and useful, but remains poorly understood. Current understanding hinges on the role of specific vibrational modes, but in fact thermal expansion is a weighted sum of contributions from every possible mode. Here we overcome this difficulty by deriving a real-space model of atomic motion in the prototypical NTE material scandium trifluoride, ScF3, from total neutron scattering data. We show that NTE in this material depends not only on rigid unit modes—the vibrations in which the scandium coordination octahedra remain undistorted—but also on modes that distort these octahedra. Furthermore, in contrast with previous predictions, we show that the quasiharmonic approximation coupled with renormalisation through anharmonic interactions describes this behaviour well. Our results point the way towards a new understanding of how NTE is manifested in real materials.
I Introduction
Almost all materials expand when heated, but some shrink instead. This phenomenon of negative thermal expansion (NTE) Dove and Fang (2016); Chen et al. (2015); Lind (2012); Romao et al. (2013) is of fundamental interest from a structural and thermodynamic point of view, and also commercially important Takenaka (2012); Barrera et al. (2005); Liang (2010), for instance in preparing substrates resistant to thermal shock. It is among the most widely studied of the anomalous negative thermodynamic properties, others including auxetics with negative Poisson’s ratio Ren et al. (2018), and materials which soften under pressure (negative derivative of the bulk modulus with pressure) Fang and Dove (2013); Fang et al. (2013a); Wei et al. (2020).
At the present time we only have a qualitative understanding of the general principles underlying the origin of NTE arising from vibrational rather than magnetic or electronic reasons, based on an idea called the ‘tension effect’ Dove and Fang (2016); Barrera et al. (2005); Mittal et al. (2018). We illustrate this idea in Figure 1 for a linear arrangement of octahedral groups of atoms. Rotations of neighbouring polyhedra will give rise to a transverse displacement of the shared vertex atom. If the bonds between the central and vertex atoms are strong, the transverse displacement of this atom, , will pull its neighbours inwards rather than stretching the bond. If these transverse motions arise from phonons of angular frequency , classical harmonic phonon theory gives , where is the temperature. By geometry, if the bonds do not change their length, the thermal motion reduces the lattice parameter from a value at low temperature to , giving a negative value of the coefficient of linear thermal expansion, Dove and Fang (2016).
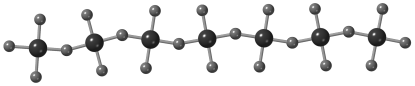
This simple picture is far from a good explanation. For one thing, we have to add to this the effects of all other phonons, many of which (including the bond-stretching vibration) will contribute towards positive thermal expansion. The tension effect therefore requires that the associated phonons must represent a sufficiently significant number of the total number of phonons. Furthermore, the fragment of a structure shown in isolation in Figure 1 is part of a three-dimensional crystal structure with the same type of connections in the other two directions. The connections to the rest of the structure give constraints that can significantly reduce the flexibility of the fragment and hence reduce the contribution of the tension effect to thermal expansion. For example, the modulation shown in Figure 1 will require distortions of polyhedra linked in other directions, and in fact in the plane of the diagram there is only one modulation—the one in which neighbouring polyhedra rotate in opposite senses of equal magnitude—that involves no distortions. The energy cost of polyhedral distortions may reduce the effect of such tension-effect vibrations. In view of this discussion, there is currently no physical understanding of why our subject material, ScF3, shows NTE, whereas almost every cubic perovskite material has positive thermal expansion, even though they all have the same basic network structure 111It may be argued that since, in comparison with the perovskite structure, ScF3 has no A-site cation, it should have more flexibility for rotational motions and hence for the tension effect to operate. However, this is a real-space intuition that doesn’t necessarily correspond directly with what is really found. Since vibrations are correctly resolved into a summation of normal modes with wave vectors in reciprocal space, any effects of the A-site cation should be interpreted in terms of their effect on the frequencies of the relevant phonon modes. And here we see that the effect is not to block the motion at all. First, comparing for ScF3 Li et al. (2011); Handunkanda et al. (2015); Oba et al. (2019); Handunkanda et al. (2015) and SrTiO3 Stirling (1972) the values of the lowest-frequency modes along the – directions in reciprocal space, as defined later, we find very similar frequency values and hence the capacity for similar RUM amplitudes. Furthermore, in many cubic perovskites there is a softening of the RUM phonon frequencies on cooling towards a displacive phase transition, which will increase the RUM amplitude..
We present here an experimentally-based atomic-scale analysis of NTE in the prototypical material \ceScF3 Greve et al. (2010); Hu et al. (2016); Li et al. (2011), obtained from neutron total scattering measurements analysed using the Reverse Monte Carlo (RMC) method. This approach is used to refine configurations of atoms so that both their long-range and their local structure are consistent with experimental data. Whilst there have been a few reports of total scattering measurements of NTE materials Hibble et al. (2002a, b); Tucker et al. (2005); Chapman et al. (2005); Tucker et al. (2007a); Dapiaggi et al. (2008); Chapman and Chupas (2009); Hibble et al. (2013); Bridges et al. (2014); Hu et al. (2016); Wendt et al. (2019)—including ScF3 itself Hu et al. (2016); Yang et al. (2016); Hu et al. (2018); Wendt et al. (2019); Bird et al. (2020)—in only one previous case, namely that of ZrW2O7 Tucker et al. (2005, 2007a), has the method been used to generate an atomic model of the fluctuations associated with NTE to provide a consistent examination of the tension effect. From our analysis of the atomic configurations across a wide range of temperatures generated in this study we show that the fluctuations associated with the tension effect are a mix of whole-body rotations and bond-bending distortions of ScF6 octahedra. We have determined the relative balance of these in ScF3 across the range of temperatures in our experiment, and evaluated how this balance leads to NTE in ScF3, whereas similar materials such as SrTiO3 show positive expansivity 222The authors of reference Li et al., 2011 give a slightly misleading qualitative opinion on the fexibility of the ScF6 octahedra on the basis of ab initio molecular dynamics simulations, because they constructed their atomic configuration with an odd number of unit cells along each direction. This choice automatically excludes all Rigid Unit Modes, and thus their simulation is unrealistic and their conclusions, albeit qualitative, are affected by this choice.. The picture that emerges here is consistent across the whole range of temperatures, and supported by simulations using a model system. We also analyse the effects of anharmonicity in ScF3 through the variation of the distribution of atomic displacements with temperature, given some recent calculations of single-model anharmonicity in ScF3 Li et al. (2011), and our growing understanding that anharmonicity has the effect of reducing NTE at high temperatures Fang et al. (2014); Oba et al. (2019). Total scattering data analysed using the Reverse Monte Carlo method is the only way to obtain information about these issues from experiment.
II Background: reciprocal-space model of negative thermal expansion in ScF3
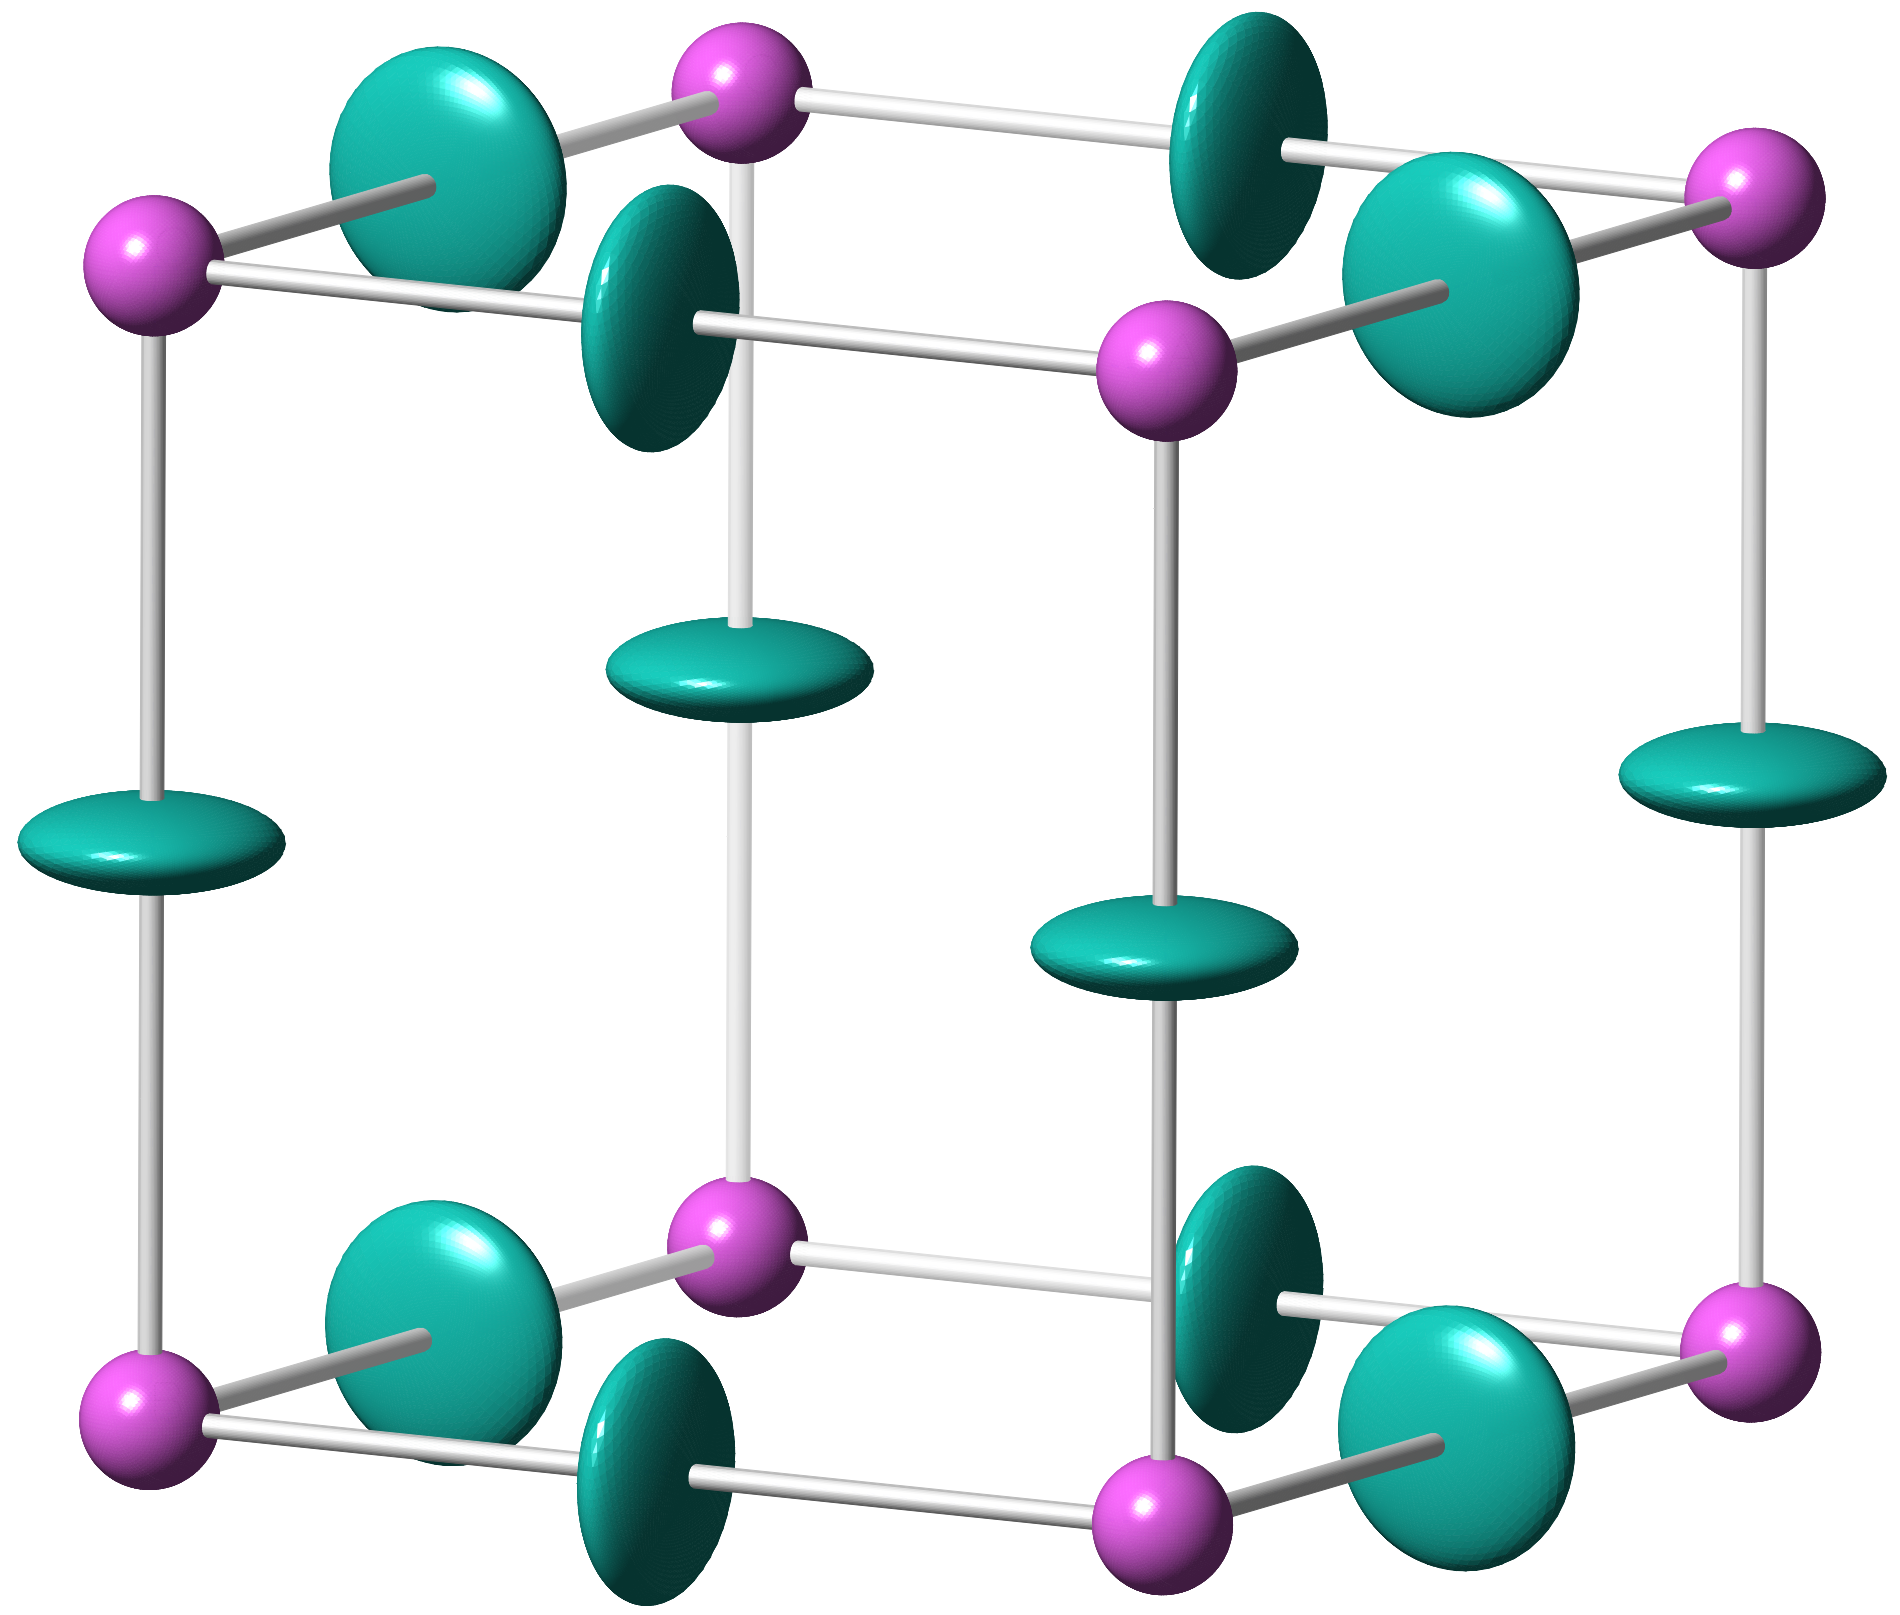
Scandium trifluoride, \ceScF3, has the rhenium trioxide structure, equivalent to the perovskite structure with a vacant A site (Figure 2). It displays isotropic negative thermal expansion over the range —our data are shown in Figure 3—with a linear coefficient of thermal expansion of at 200 K Greve et al. (2010).
Accurate calculations of the phonon dispersion curves of ScF3 using the Density Functional Theory (DFT) method Li et al. (2011); Handunkanda et al. (2015); Oba et al. (2019) show two important points. The first is that there is a line in reciprocal space (together with the symmetrically related lines) containing the lowest-energy phonons, namely for the wave vectors for ; the two special points and have labels and respectively. The eigenvectors of these modes correspond to transverse motions of the F atoms with whole-body rotations of the ScF6 octahedra. Measurements of inelastic x-ray scattering Handunkanda et al. (2015) and diffuse x-ray scattering Handunkanda et al. (2016) from single crystals support this picture exactly. The second point is that the frequencies of phonons away from the – line increase rapidly with frequency, and these modes have low frequency only for wave vectors near this line in reciprocal space. Again, this point is consistent with the inelastic and diffuse scattering measurements Handunkanda et al. (2015, 2016).
The low-frequency modes with wave vectors along the – line and with eigenvectors corresponding to octahedral rotations are what are called Rigid Unit Modes (RUMs) Giddy et al. (1993); Hammonds et al. (1996); Heine et al. (1999); Dove and Fang (2016); Dove (2019). Their low energy is a consequence of the fact that the force constants associated with bending the octahedral F–Sc–F angles are much larger than those associated with bending the linear Sc–F–Sc angles; our estimate discussed in the Supplemental Material is that the two force constants differ by a factor of around 50. Such a large factor accounts for the fact that the value of the frequency of the transverse acoustic mode at wave vector is much larger than that of the RUM frequency, seen in both the DFT calculations Li et al. (2011); Handunkanda et al. (2015); Oba et al. (2019) and inelastic x-ray scattering experiments Handunkanda et al. (2015). The same situation is seen in the experimental phonon dispersion curves of the cubic perovskite phase of SrTiO3 Stirling (1972). The existence of RUMs provides a natural mechanism for the tension effect in NTE materials since the rotations give rise to a shrinkage of the crystal structure and these modes have the necessary low energy Heine et al. (1999); Dove and Fang (2016); Dove (2019). Indeed, the DFT calculations show that the RUMs have a considerably larger contribution to NTE than all other individual phonons, by two orders of magnitude.333It is worth remarking about the origin of the stiffness in the structural polyhedra in general and more specifically in the case of the ScF6 octahedra in ScF3. Much of the original literature on RUMs concerned silica and silicates, which are conventionally considered to have strong covalent bonds defining the shape and stiffness of the structural SiO4 tetrahedra. However, it is important to understand that the rigidity of structural polyhedra do not rely on covalent bonding, because tension within the polyhedra in a system where the bonding is more ionic in nature can arise from mutual repulsions between the vertex ions because of size effects and Coulomb interactions. This is pertinent for ScF3. The Sc–F bond is relatively strong, as evidenced by the large value of the Sc–F stretching frequency in the phonon dispersion curves Li et al. (2011); Handunkanda et al. (2015); Oba et al. (2019), indicating some degree of covalent bonding, but it is more likely that the ionic size and electrostatic interactions will be most important in the F–Sc–F bond-bending forces.
As we have noted, pure RUMs exist along lines of wave vectors. A line of wave vectors of RUMs in ScF3 occupies only a tiny—effectively infinitesimal—fraction of reciprocal space, and virtually all phonons must necessarily involve distortions of the ScF6 octahedra. In particular, even though the pure RUM motions have the highest contribution to NTE of any phonon, their tiny weighting in reciprocal space means that any tension effect model must involve such distortions. The finite, as opposed to infinite, stiffness associated with distortions of the polyhedra are in fact an important part of the RUM model Dove (2019); we return to this point in §VIII. And in fact, the DFT phonon calculations Li et al. (2011); Handunkanda et al. (2015); Oba et al. (2019) show that in reciprocal space the tension effect will ‘bleed into’ the phonons whose wave vectors are close to, but not exactly on, the line –. These modes have a large component of rotation but an increasing component of polyhedral distortion on moving away from the – line in reciprocal space. They are, in effect, what we would call quasi-RUMs Hammonds et al. (1996). The extent to which the spectrum of quasi-RUMs can give rise to an overall NTE will depend on the extent to which the polyhedra can easily be distorted, a question that is analysed in detail in this paper. This will give us a new perspective of the role of RUMs in the tension effect that will be applicable to many NTE materials, and will enable us to understand, for the first time, why NTE can exist in some materials but not in other materials with close structural similarity.
At this point we note that the authors of reference Wendt et al., 2019 have proposed a radically different model. Their central idea is that the ScF6 octahedra have no internal rigidity in terms of bending of the bonds, and that the Sc–F bonds can rotate in an uncorrelated way as independent Einstein oscillators. In part this idea is based on a misleading interpretation of the first three peaks in the pair distribution function because of the use of inappropriate integration limits coupled with the effects of noise associated with the Fourier transforms. The idea of the Sc–F bonds being able to rotate in an uncorrelated motion implies the absence of a force constant associated with bending of the octahedral F–Sc–F bond, which is directly the opposite of the RUM model. This type of model would surely give rise to a significant tension effect. However, it would lead to an excitation spectrum with 6 low-frequency modes for all wave vectors, and an additional two low-frequency shear acoustic modes along the direction and one along the direction. Whist this model of uncorrelated Sc–F motion is appealing as an intuitive interpretation of the tension effect, it is completely inconsistent with our knowledge of the phonon dispersion curves by both ab initio calculation Li et al. (2011); Handunkanda et al. (2015); Oba et al. (2019) and inelastic x-ray scattering measurements Handunkanda et al. (2015). A recent paper based on new x-ray total scattering measurements Bird et al. (2020) supports the interpretation presented here, based on an earlier pre-print of this article, over the model of uncorrelated F-atom motions proposed in reference Wendt et al., 2019.
The RUM model with infinite stiffness and the uncorrelated model of reference Wendt et al., 2019 represent two opposite ends of a spectrum. We would argue that the calculated Li et al. (2011); Handunkanda et al. (2015); Oba et al. (2019) and measured Handunkanda et al. (2015) phonon dispersion curves actually mean that the balance is more towards a RUM model with more polyhedral flexibility than found in corresponding oxides. Where ScF3 actually sits in this balance is explored in detail in this paper.
III Methods
Neutron total scattering and diffraction experiments were performed on the Polaris diffractometer at the UK ISIS spallation neutron facility. The sample was obtained commercially, and x-ray and neutron powder diffraction measurements showed that the sample is of single phase within the limits of detection. The sample was packed into a cylindrical vanadium can of radius 8 mm. Measurements for 750 A.h were obtained over the temperature range 10–1200 K, with shorter runs at intermediate temperatures performed for crystal structure analysis. The POLARIS instrument can measure down to a wavelength of 0.1 Å POL (2019), which gives a maximum energy transfer far in excess of the upper limit of 85 meV required from the DFT phonon calculations on ScF3 Li et al. (2011) and therefore the experiments and subsequent analysis capture the full range of phonon excitations.
Rietveld refinement was carried out using the GSAS software Larson and Von Dreele (2004) with the EXPGUI interface Toby (2001). Data were prepared for Rietveld analysis using the MANTID software Arnold et al. (2014).
The RMC simulations were performed using the RMCprofile code Tucker et al. (2007b). The data sets used were the total scattering function after correction and subtraction of the self term, , the pair distribution function (PDF) obtained as Fourier transform of the function (the corrections to form and conversion to the PDF were performed using the GUDRUN package Soper (2012)), and the Bragg scattering profile. Key equations and data are given in the Supplemental Material, showing the high quality of the fitting we were able to achieve.
Molecular dynamics simulations were performed using the DL_POLY code Todorov et al. (2006), using a model developed by fitting the calculated dispersion curves to the DFT results of reference Li et al., 2011 using the GULP lattice simulation code Gale (1997); Gale and Rohl (2003). The model is described in more detail in Section VI, in the Supplemental Material, and in the parallel reference Wei et al., 2020.
IV Real-space analysis of negative thermal expansion
We collected total neutron scattering data from a powder sample of scandium trifluoride, measuring both the Bragg scattering—sensitive to the long-range order—and the diffuse scattering. Although several previous pair distribution function studies of ScF3 have used X-rays Hu et al. (2016); Yang et al. (2016); Hu et al. (2018); Bird et al. (2020), for our analysis neutron radiation was a more appropriate choice, for three reasons. First, the accessible range of scattering vector , and hence the resolution of the pair distribution function derived from it, is much greater: we were able to measure up to a maximum value of Å-1, while with X-rays the maximum achievable value of with a short-wavelength silver anode is , and is usually practically up to around 30 Å-1 with synchrotron radiation measurements. Second, the X-ray atomic form factor decays rapidly with scattering vector , which further limits the range in which useful data can be collected: even if we were somehow able to measure X-ray scattering at 50 Å-1, the scattering factor of Sc would be only 0.7% of its value at low . Finally, because this -dependence differs between atoms, calculating a scattering-weighted pair distribution function from a trial configuration of atoms is necessarily approximate.
Thus our neutron data enabled us to calculate high-resolution, bias-free pair distribution functions (see §III), which are effectively histograms of instantaneous interatomic distances. We then used the Reverse Monte Carlo (RMC) method Tucker et al. (2001); Dove et al. (2002); Keen et al. (2005); Tucker et al. (2007b) to obtain a set of atomic configurations consistent with these data, each of which can be regarded as a plausible snapshot of the instantaneous atomic positions in this material.
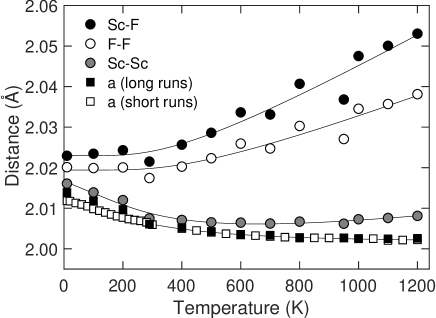
The experimental lattice parameter is shown in Figure 3, plotted as , showing the NTE over the temperature range 0–1100 K and positive expansion at higher temperatures consistent with previous data Greve et al. (2010). In this figure we also compare the mean nearest-neighbour Sc–F and F–F distances, and half the mean \ceSc\bond…Sc distance, all three obtained from analysis of the RMC configurations. The Sc–F and F–F distances are fully consistent with the positions of the peaks in the PDF data, but in the case of the \ceSc\bond…Sc distance, the peak in the PDF overlaps with that from the second-neighbour \ceF\bond…F distribution and thus we cannot extract this directly from the raw data. The prediction from the tension effect is that the distance between mean positions of two bonded atoms should be shorter than the actual mean bond length, and indeed as expected the Sc–F bond and F–F distances show normal positive thermal expansion (Sc–F expansion coefficient MK-1), whereas decreases on heating defining the negative thermal expansion. This result for the Sc–F bond is consistent with two recent measurements of the PDF Hu et al. (2016); Wendt et al. (2019). 444The recent study of Wendt et al Wendt et al. (2019) reports two anomalous findings, first that the mean F–F distance shrinks with increasing temperature, and second that the integrated area of the second F–F peak in the PDF decreases with temperature. In both cases these are contrary to what we have found. These two anomalous results may reflect the limitations of analysis of the PDF alone, without the support of a model. As the F–F peak broadens with temperature, the data become increasingly noisy, and the pair density within any fixed range will necessarily decrease. Furthermore, the analysis may also be affected by artefacts associated with untreated truncation effects at the maximum observable value of . Such problems highlight the value of making use of modelling approaches such as RMC, where the atomic model imposes reasonable physical constraints on the data analysis. The atomistic configuration RMC provides means that there is no ambiguity in assigning pair density where peaks are very broad or overlap, such as the 4 Å peak here, which encompasses both Sc–Sc and FF pairs. Figures S7–S9 in the Supplemental Material show the RMC-derived decomposition of the PDF into contributions from individual atomic pairs.
Figure 3 also shows the temperature dependence of the mean distance between neighbouring Sc atoms. One might expect, given the locations of the Sc atoms, for this distance to reflect exactly the lattice parameter. However, although slight, we see a difference between these two quantities that grows on heating, with the \ceSc\bond…Sc distance showing a slightly weaker dependence on temperature than for the linear dimensions of the crystal, and a change to positive expansivity at a lower temperature. A similar effect was seen in Zn(CN)2, where the (negative) expansivity of the \ceZn\bond…Zn distance is less negative than the linear expansivity of the crystal Chapman et al. (2005). In that case the difference is due to the fact that the primary mechanism for NTE is from the acoustic modes Fang et al. (2013b). This is of course different to ScF3, where the main NTE modes are rotational modes of optic character that lie along the edges of the Brillouin zone. However, by symmetry these modes transform into transverse acoustic modes as the wave vectors changes from the – line to zero, as seen in the dispersion curves reported in references Li et al., 2011 and Aleksandrov et al., 2002. We propose that the behaviour of the \ceSc\bond….Sc distance may be associated with the growing acoustic mode character of the NTE phonons moving away from the – line; indeed, the bending of the F–Sc–F right angle can be associated with the transverse acoustic (shear) mode.
V Local structural distortions from Reverse Monte Carlo analysis
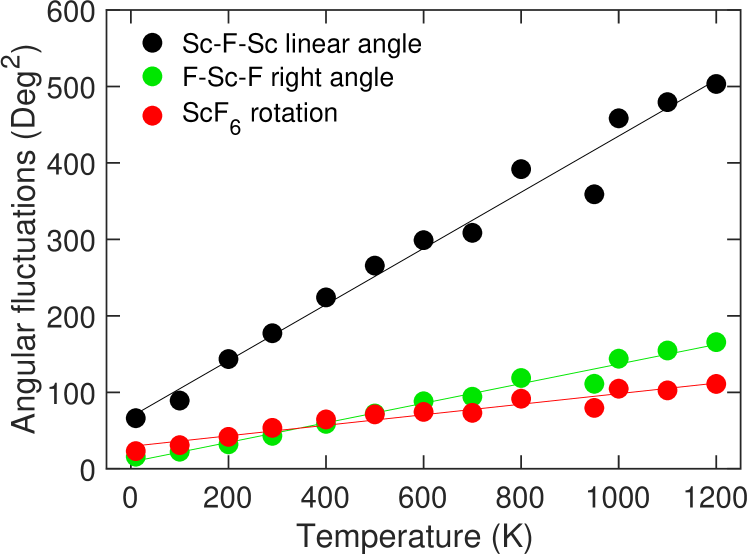
We now consider the local atomic motions that are associated with NTE. The fact that the Sc–F bond shows positive thermal expansion implies that the tension effect will provide the mechanism. Thus we need to consider effects associated with transverse motions of the F atom, and the extent to which this is correlated with the ScF6 octahedra moving as nearly-rigid objects or distorting. Figure 4(a) shows the behaviour of three angles with temperature: first the variance of Sc–F–Sc angles as they distort from the value of , second the variance of the F–Sc–F angles as they distort from the ideal octahedral angle of , and third the mean-square rotations of the ScF6 octahedra (calculated using the GASP tool; see below). The largest fluctuation, by a significant margin, is for the Sc–F–Sc angle, which is primarily associated with the transverse motions of the F anion and is consistent with both the thermal ellipsoids seen in Figure 2 and the role of the tension effect. The other two angles, namely of the ScF6 octahedral rotations and the bending of the F–Sc–F bond, are actually very similar to each other. Thus the transverse motions of the F atoms as reflected in the Sc–F–Sc angles are achieved by both rotations and bond-bending deformations of the ScF6 octahedra.
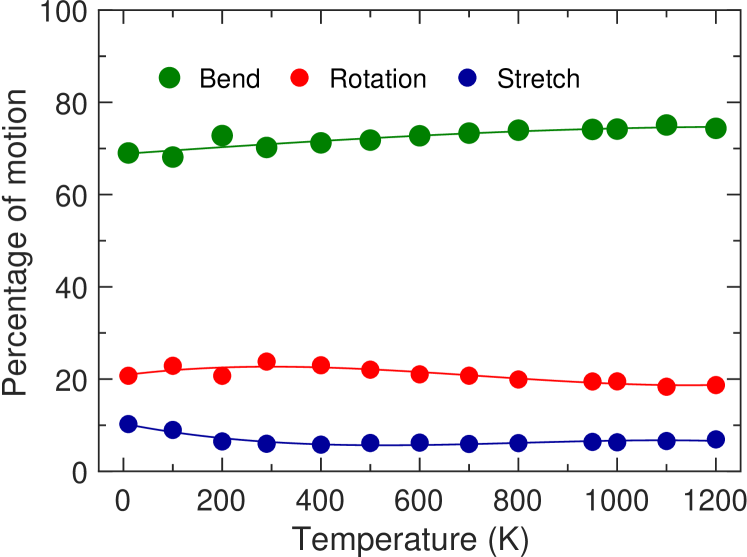
In Figure 4(b) we show the details of an analysis performed using the GASP method, based on using geometric algebra to represent the rotations of polyhedral groups of atoms Wells et al. (2002a, b, 2004). Given a set of bond vectors for an octahedron, , where runs over all the centroid-vertex bonds, we can compare the vectors in one configuration with those in another (here, the ideal average structure), which we denote as . The difference, which we call the mismatch, is . GASP uses a least-squares algorithm to find the rotation of each octahedron that minimises , where we sum over all bonds in the polyhedron. The residual value of per polyhedron is then decomposed into contributions from bending of bond angles and stretching of bonds, thereby accounting for the total motion involving non-uniform displacements of the F atoms. The results in Figure 4(b) compare the extent to which the sum of the atomic motions of the F atoms in each ScF6 octahedron can be separated into whole-body rotations of the octahedron, flexing of the F–Sc–F bond angle, and stretching/shrinking of the Sc–F bonds. 555In Figure 4(a) the sizes of the fluctuations of the ScF6 orientations and F–Sc–F angles are similar, but in Figure 4(b) the GASP analysis suggest that the motions of the F atoms associated with bond bending are rather larger than from rotations of the octahedra. These results are actually consistent with each other: the contribution to from the octahedral rotation will come from three axes, but there are 12 bending angles associated with deformation of the octahedra. This partition, which barely changes with temperature, is compared in summary form with corresponding results from a similar study of the TiO6 octahedra in the perovskite SrTiO3 Hui et al. (2005) in Table 1, together with results from a molecular-dynamics simulation on a model system (described in the Supplemental Material) in which the energy penalty for bending the \ceX-M-X angle tends to zero. Our results show that \ceScF3 is quite close to that limiting case 666But it would be wrong to say that it is the limiting case, because the model, being a simplified model, is not an exact representation of the actual material. In particular, the division between the three types of motion is not exactly the same. What we are demonstrating is that even in the limit of fairly flexible octahedra the GASP method will still identify whole-body rotations.. The analysis suggests, therefore, that the ScF6 octahedra in ScF3 are significantly more flexible with regard to bending the anion–cation–anion angles than are the TiO6 octahedra in SrTiO3; we will argue below that this is the key difference that gives rise to NTE in \ceScF3 but not in the cubic oxide perovskites. 777There are two important points to highlight in the two diagrams in Figure 4. The first is that the angular fluctuations in (a) increase linearly with temperature, in line with expectations from classical quasi-harmonic lattice dynamics. Second is that the distribution of atomic motion over the three components in (b) is more-or-less constant with temperature, reflecting phonon eigenvectors and again being fully consistent with classical quasi-harmonic lattice dynamics. In particular, although thermal motion is large at the higher temperature, it does not lead to any breakdown of the classical picture, contrary to the opinion expressed in reference Wendt et al., 2019.
| Material | Bend | Stretch | Rotation |
|---|---|---|---|
| \ceScF3 | 70% | 10% | 20% |
| Flexible model | 75% | 5% | 20% |
| \ceSrTiO3 | 44% | 19% | 37% |
Comparing absolute values of the fluctuations for ScF3 and SrTiO3 at a single temperature, say 300 K, we find that in SrTiO3 the linear Ti–O–Ti angle fluctuates by an average of around and the TiO6 octahedra orientation fluctuates by around Hui et al. (2005), while the corresponding sizes of the fluctuations in ScF3 are around and respectively (Figure 4(a)). On the other hand, the coefficient of thermal expansion of the Ti–O bond, 10 MK-1 is comparable to that of the Sc–F bond cited above, with similar Sc–F and Ti–O bond lengths.
We can also compare this analysis with the phonon dispersion curves for ScF3 calculated using ab initio methods Li et al. (2011) and calculated for SrTiO3 using a shell model fitted to inelastic neutron scattering and infrared spectroscopy Stirling (1972). We see that the octahedral cation–anion stretching frequencies are very similar (20 THz in ScF3 and 22 THz in SrTiO3), suggesting (given the similar masses of O and F) that the bonds in ScF3 and SrTiO3 are of similar stiffness. In both ScF3 and SrTiO3 the octahedral rigid-body rotational phonons between the and wave vectors are of very low frequency compared to the stretching mode in both materials, namely between 0.6 to 1.2 THz in ScF3 and between 1.3 to 2.5 THz in SrTiO3 at a temperature of 200 K. However, the bending frequencies are different. If we take, for example, the transverse acoustic mode frequency at , , which is a shear mode that reflects bending distortions of the octahedra, we find that it is lower in frequency by around a factor of 2 in ScF3 than in SrTiO3, meaning the corresponding force constants are 4 times smaller. This is consistent with our finding that the ScF6 octahedra are rather more flexible than the TiO6 octahedra. But care is needed not to go to the extreme viewpoint and imagine that there is no force constant associated with the bending of the F–Sc–F right angle. There is, and it directly gives rise to a non-zero shear elastic constant 888We consider models in which the Sc–F bond is the sole rigid entity, with complete flexibility of the ScF6 octahedra, as for example in reference Wendt et al., 2019, to be over-flexible and unable to provide useful insights, not least because such models will predict the wrong signs of the Grüneisen parameters for many phonon modes. A similar situation was discussed with regard to NTE in Cu2O in reference Rimmer et al., 2014, where the true rigid entity is the linear O–Cu–O trimer, and models that consider only the O–Cu bonds as the rigid entities are too flexible..
VI Molecular dynamics simulations with a simplified model
Simulation methods can often give insights into the relationship between the properties of materials and their atomic structure. For ScF3 there have been a number of simulation studies using the molecular dynamics (MD) method with with classical force fields or ab initio methods Lazar et al. (2015); Bocharov et al. (2019, 2020). What is less useful about such methods is that it is not easy to change parameters that directly affect one type of structure flexibility alone. Any change in some aspect of the model will affect everything. To address the question of the relative roles of the forces associated with the bending of the octahedral F–Sc–F bond angle or linear Sc–F–Sc bond angle we need to work with a simpler idealised model, and we explore this now.
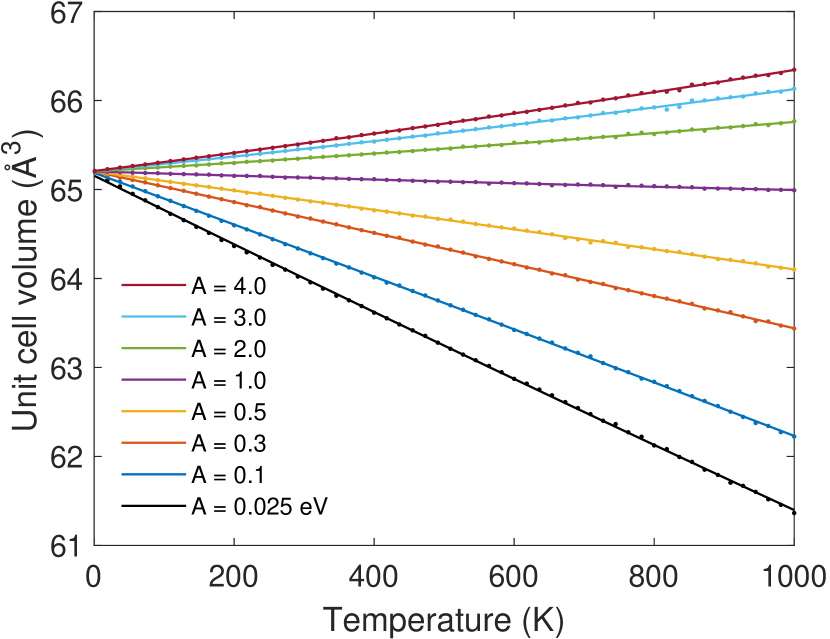
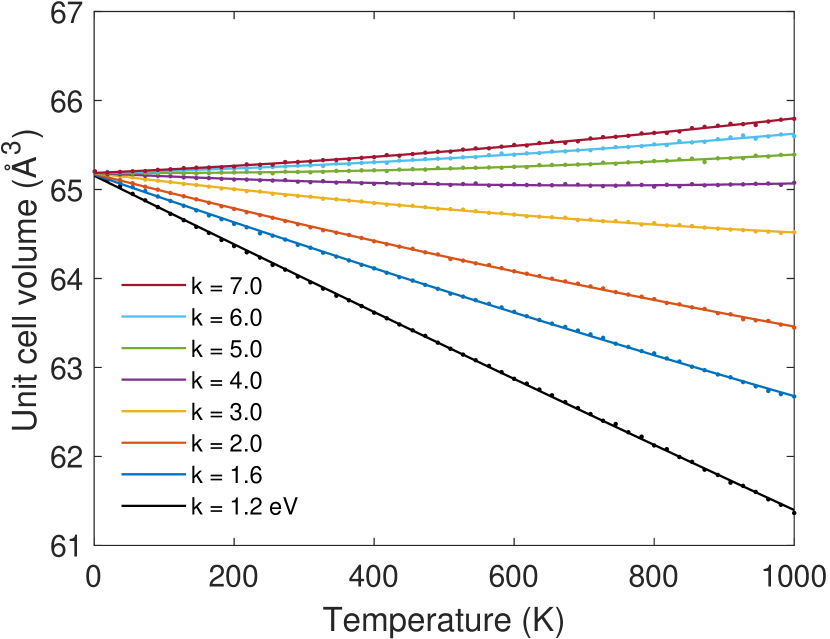
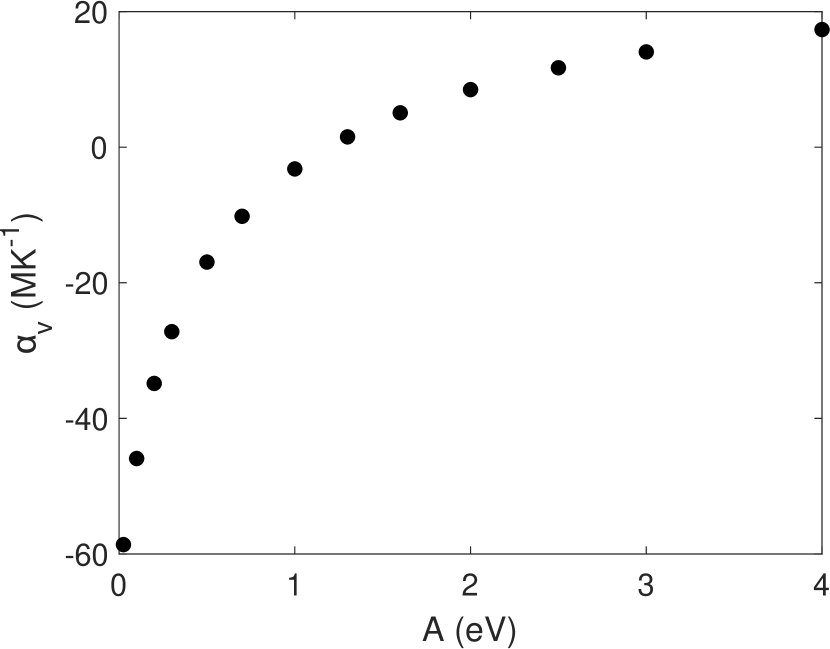
The model introduced briefly in the previous section, and in our parallel paper on pressure-induced softening in ScF3 Wei et al. (2020), is described in more detail in the Supplemental Material. The model has been designed and analysed to see the effect of various independent parameters on the NTE. There are two parameters that are of interest (a third parameter controls the bond stretching, which is tuned to a high stiffness by comparison with the DFT phonon calculations). The first, with symbol , controls flexing of the linear Sc–F–Sc bond and determines the frequency of the RUM along the – wave vectors. The value of this parameter was tuned directly by comparison of the calculated RUM frequencies with those given by the DFT phonon calculations. The second, with symbol , controls flexing of the F–Sc–F right-angle, and its value was tuned to reflect the variation of the shear acoustic modes from the DFT dispersion curves. Increasing both of these parameters will reduce the flexibility of the structure in their respective ways, and hence change the thermal expansion. We explicitly do not include ionic charges in the model because Coulomb interactions will affect the flexibilities of both the linear Sc–F–Sc bond and right-angle F–Sc–F bond. Nevertheless, the simple three-parameter model does a surprisingly good job of reproducing the phonon dispersion curves, comparing Figure S11 with the results, say, of reference Li et al., 2011.
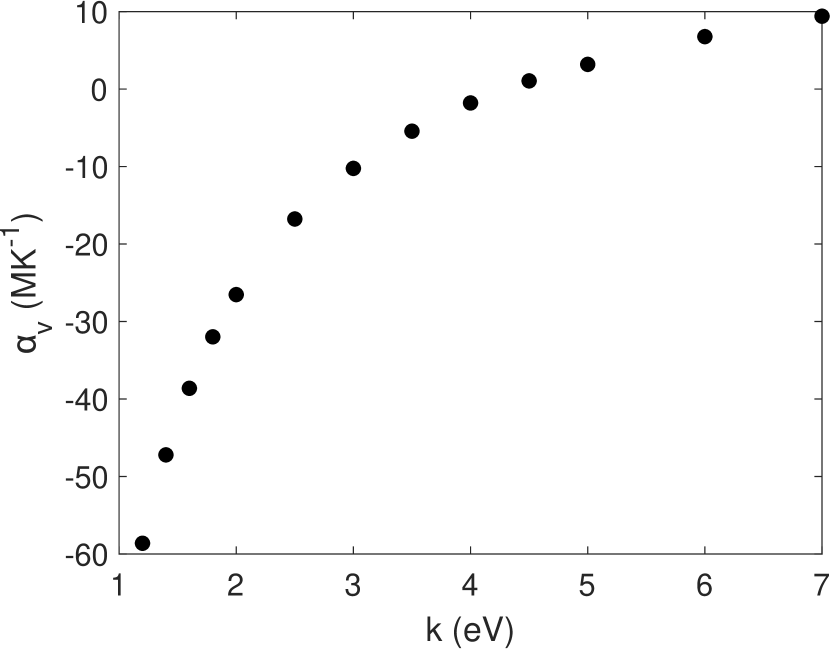
Figure 5 shows the results of varying both force constants starting from the model that best reproduces the DFT phonon dispersion curves. The first result from the data shown in Figure 5 is that increasing both force constants will reduce the negative thermal expansion, and eventually drive it positive. Increasing the F–Sc–F force constant will increase the frequencies of the modes close to the RUM – line, which will reduce the number of phonons contributing significantly to the overall NTE and hence leading to a reduction and eventual elimination of NTE. This is consistent with the narrative developed based on the RMC results presented above. On the other hand, the force constant associated with the linear Sc–F–Sc bond, , plays a role in increasing the frequencies of the RUMs but less of a role in shaping the dispersion curves, so will have a gradual effect in changing the NTE as the mode frequencies increase. The increased frequency of the RUMs will lead to a reduced transverse amplitude of the F atoms. In some ways, this is similar to the effects of the forces imparted in the analogous perovskites with an atom in the A site (such as Sr in SrTiO3). There is, however, one significant difference with regard to changing the two force constants. In the case of the F–Sc–F right angle, NTE vanishes by increasing the force constant value by a factor of 3.3, whereas in the case of the Sc–F–Sc angle, NTE vanishes by increasing the force constant value by around a factor of 40. Looking at dispersion curves in perovskites, for example in SrTiO3 Stirling (1972), suggests that in perovskites the size of this factor is not reached. On the other hand, the factor of 3.3 increase in the bending force constant is exactly consistent with the difference between ScF3 and SrTiO3 discussed in the previous section. Thus the difference strongly suggests that key effect in determining NTE is indeed the bond-bending flexibility of the ScF3 octahedra.
VII Anharmonicity
There is a lot of current interest in the role of anharmonic phonon interactions in NTE. Typically the most important ones are those involving fourth-order interactions, which have the effect of changing phonon frequencies. Several recent papers have studied anharmonicity in ScF3 in various ways Li et al. (2011); Handunkanda et al. (2015); van Roekeghem et al. (2016); Oba et al. (2019).
In renormalised phonon theory 999In common usage, the term quasiharmonic model considers the effect of changes in volume on the phonon frequencies through the consequent changes in harmonic force constants, giving new harmonic phonon frequencies as modified by the anharmonic coupling of force constants to volume. The term renormalised phonon model considers how a renormalised harmonic Hamiltonian can result from a mean-field treatment of the anharmonic interactions between phonons, typically focussing on the fourth-order interactions. the temperature-dependence of a phonon angular frequency ( labels the mode for any ) in the high- limit varies as Dove (2009); Oba et al. (2019)
where is the square of the harmonic angular frequency, and the interactions characterised by the fourth-order anharmonic parameters couple the phonon to all other phonons . This summation includes the case ; when this case is taken alone, it represents the independent-mode approximation. It is this approximation only that is probed in a frozen-phonon calculation Li et al. (2011), and it will give just a small part of the overall picture. That is, the contributions from the modes are normally much more important than only the modes in determining how phonon frequencies change with temperature. The DFT calculations of Li et al Li et al. (2011) suggested that for the -point mode the independent-mode anharmonic potential is quite large compared to the harmonic potential, but the summation over all modes may still mean that the primary anharmonic effects come instead from interactions across the Brillouin zone. Van Roekeghem et al van Roekeghem et al. (2016) recently studied the anharmonicity using both x-ray inelastic scattering and through calculations of the phonon frequencies via a renormalised phonon method. They showed, consistent with most perovskites, that the low frequency branch along the line – and the three lowest-frequency optic modes at zero wave vector soften on cooling, consistent with renormalised phonon theory, whereas the higher-frequency modes harden on cooling. Similar results were obtained by Oba et al Oba et al. (2019). The softening on cooling arises from direct anharmonic interactions via renormalised phonon theory as described here, whereas the hardening of the high-frequency modes arises primarily from thermal expansion of the Sc–F bond. In this model, the renormalised phonons continue to look like phonons with well-defined frequencies, with lifetimes substantially larger than the phonon frequency (See Figure 3 of reference van Roekeghem et al., 2016). Separately, in reference Fang et al., 2014 we showed from simple considerations that anharmonic renormalisation of phonon frequencies will cause NTE to shift towards positive expansivity at higher temperatures; the same result is obtained by more detailed renormalised phonon theory calculations van Roekeghem et al. (2016); Oba et al. (2019).
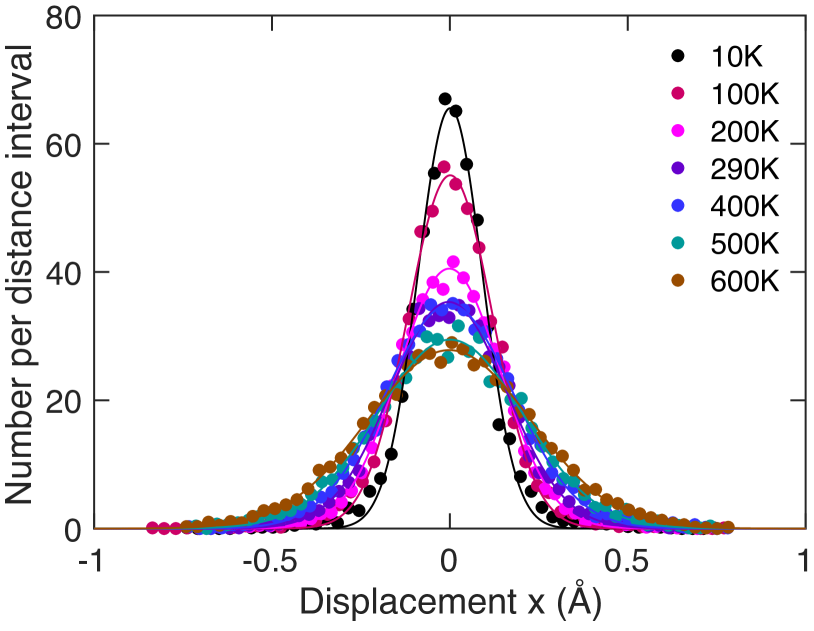
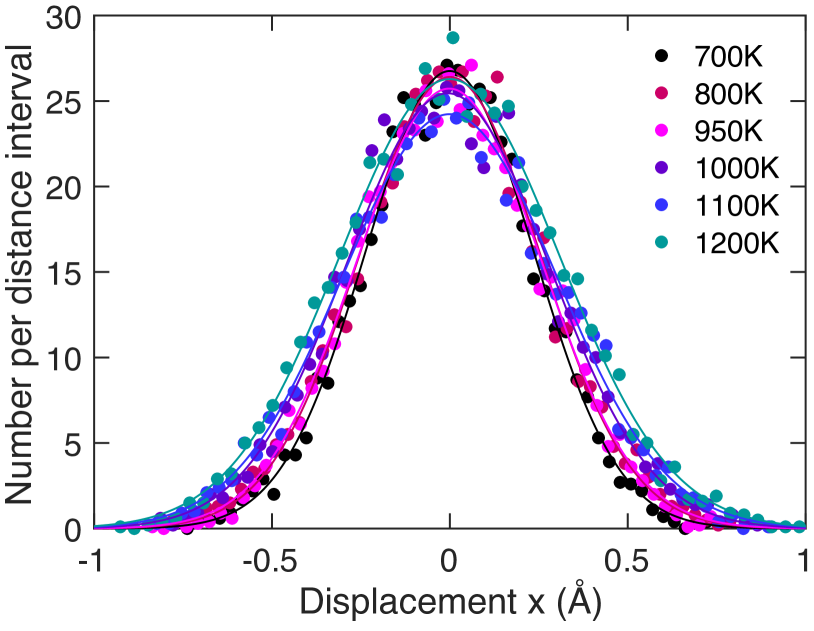
We have analysed our RMC configurations to look for any effects of anharmonicity in the distributions of transverse displacements of fluorine atoms. This particular atomic displacement was chosen since it is active in the -point RUM previously identified as having a dominant fourth-order term. Figure 6 shows the distribution of these displacements of F atoms away from the \ceSc\bond…Sc line as a function of temperature. Two features of these data are noteworthy. First, the distributions are well fitted by Gaussian functions at all temperatures. In particular, we find no evidence for a toroidal distribution of fluorine atoms, as conjectured in a recent PDF study Wendt et al. (2019). 101010Importantly, the reverse Monte Carlo method is indeed capable of generating such distributions in cases where they genuinely exist; one clear example is that of the cubic phase of cristobalite Tucker et al. (2000). Second, the fitted variance of these Gaussian distributions increases linearly with temperature, exactly as one would expect for a harmonic oscillator. We conclude that, to the extent to which anharmonicity is important in this material, it is completely described within the renormalised phonon approximation taken to fourth order. In other words, although fourth-order interactions seen by individual phonon modes may limit their amplitude at high temperature, there is an insufficient number of such modes with near-zero harmonic terms to make an appreciable difference to the distribution of atomic positions. Thus overall the most important anharmonic interactions involve couplings between different phonons, as described by the renormalised phonon approximation taken to fourth order rather than the independent mode approximation. Furthermore, our results also rule out the significant of higher-order terms because they too would lead to a different temperature dependence.
It is worth making a general comment here. It is very tempting to assume that because high temperatures lead to large-amplitude motions, they also lead to significant and unusual anharmonic effects. Actually this need not be so, given that large amplitudes are perfectly possible within the harmonic approximation. Our analysis here shows that high temperature does not necessarily produce unusual behaviour, such as envisaged in reference Wendt et al., 2019 for example. Instead, at high temperature ScF3 behaves as a typical harmonic crystal, or at least as one whose behaviour is only weakly perturbed by anharmonic effects. A similar conclusion was obtained from an RMC study of BiFeO3 based on neutron total scattering data; in spite of very large atomic motions at high temperature, the average structure remains robustly constant across a wide range of temperatures and there are no unusual changes in atom distributions Du et al. (2019).
VIII Discussion and conclusions
Our two key conclusions from the analysis of the RMC configurations discussed above are that that the NTE arises from a set of phonons with wave vectors around the lines of RUMs in reciprocal space and which are sufficiently extensive because of the relatively lower force constants associated with bending the bonds within the \ceScF6 coordination octahedra than in related systems, and that the transverse displacement of the F atoms, although associated with a quartic mode, can be well described by a Gaussian distribution whose width varies linearly with temperature, consistent with a renormalised harmonic phonon model. These results are closely related, since the RUMs are exactly the modes that will have small quadratic terms and in which the quartic terms are thus expected to be dominant. What they show is that the quasi-RUM vibrations make dominant contributions to the thermal expansion, and in particular to the NTE, of ScF3. A similar conclusion was reached by the authors of reference Bird et al. (2020) by a different type of analysis.
We need to state clearly that the deformations of the ScF6 octahedra allowed within the quasi-RUMs do not in any way repudiate the importance of RUMs. It is a common misconception that the RUM model requires the octahedra to be very rigid (a mistake propagated in reference Wendt et al., 2019), but in fact quite the opposite is true, as has been discussed in detail recently in reference Dove, 2019. The basic RUM model has always considered the structural polyhedra to have finite, rather than infinite, rigidity, which in the original application of the RUM model to displacive phase transitions is directly associated with the phase transition temperature Dove et al. (1992, 1995, 1996); Gambhir et al. (1997); Dove et al. (1999). In the same vein, the RUM model itself does not presuppose that any rigidity of the polyhedra arises only from covalent bonding. Polyhedral rigidity certainly can arise from Coulomb interactions or steric hindrance effects between anions within the structural polyhedra. In this sense our work here is also consistent with the viewpoint of reference Tkachenko and Zaliznyak (2019), which discusses RUMs and quasi-RUMs in the context of a model with ionic forces.
The point is this: the fact that the RUMs are restricted to wave vectors lying on lines in reciprocal space means that they are a vanishingly small fraction of the total number of phonon modes and therefore alone they cannot give overall NTE. Instead, to get overall NTE it is necessary that there is a sufficiently-large number of low-frequency RUM-like phonon modes—quasi-RUMs—close to the wave vectors of the RUMs. This is possible if the polyhedra (in this case the ScF6 octahedra) have some flexibility. Thus we propose firstly that the existence of the RUMs gives a set of phonons with the necessary low frequencies and appropriate mode eigenvectors for the tension effect to give NTE, and secondly that the flexibility of the polyhedra allows the contribution from the quasi-RUMs to spread across a sufficiently large volume in reciprocal space to have enough thermodynamic weighting to give an overall NTE. This explains concisely why there is NTE in ScF3 but only positive thermal expansion in other perovskites such as SrTiO3; both materials have stiff cation–anion (Sc–F or Ti–O) bonds, but the TiO6 octahedra are more resistant to bond-bending distortion than the ScF6 octahedra. This interpretation provides a plausible and reasonable explanation of the origin of NTE in ScF3: one that is predictive, that is based on standard concepts in condensed matter physics, and that is consistent with previous experimental data and simulations.
In conclusion, our real-space analysis of ScF3, based on using the Reverse Monte Carlo method with neutron total scattering data to generate configurations of atoms over a wide range of temperatures, has allowed us to establish a quantitative view of the structural fluctuations associated with NTE. Comparison with a similar study of SrTiO3, together with comparisons of published phonon dispersion curves, shows the importance of RUMs in giving rise to NTE, but that is also necessary to have some degree of polyhedral distortion to spread the contributions to NTE across a wider range of wave vectors than those associated with the pure RUMs. Fluorinated octahedra have bonds that are as stiff as in their oxygenated counterparts, but have more bond-bending flexibility. On this basis we suggest that in the search for materials with large negative coefficients of thermal expansion, fluorinated analogues of other oxides with NTE—one example being ZnF2 as an analogue of the rutile phase of TiO2 Wang et al. (2015)—might prove to be particularly fertile 111111The research group of Angus Wilkinson has explored several fluorides with crystal structures analogous to ScF3, including materials with various levels of doping Morelock et al. (2013, 2014); Hancock et al. (2015); Morelock et al. (2015); Hester and Wilkinson (2018). Many examples display phase transitions involving rotations of octahedra and which appear to be continuous (second-order). These phase transitions will be accompanied by the softening of the RUM phonons on cooling towards the transition temperature, through the types of anharmonic interactions discussed in this paper as described by equation VII. We have shown that such a variation of the renormalised phonon frequency with temperature will lead to a reduction, or even elimination, of NTE Fang et al. (2014), as also demonstrated in recent calculations van Roekeghem et al. (2016); Oba et al. (2019)..
Data availability
Original data sets are available directly from ISIS with Digital Object Identifier 10.5286/ISIS.E.RB1510519 Dove et al. (2015). Corrected data and atomic configurations are available on request from the corresponding author.
Acknowledgements
We are grateful to ISIS for provision of neutron beam time, supported under proposal number RB1510519. We also appreciate help from Helen Playford (ISIS) in preparation for the experimental beam time. J.D. is grateful to the China Scholarship Council and Queen Mary University of London for financial support. This research utilised the following computing resources: a) Queen Mary’s Apocrita HPC facility (DOI: 10.5281/zenodo.438045), supported by QMUL Research-IT and funded by EPSRC grants EP/K000128/1 and EP/K000233/1 (M.T.D.); b) Midlands Plus Tier-2 HPC facility, funded by EPSRC grant EP/P020232/1 (M.T.D.).
References
- Dove and Fang (2016) Martin T Dove and Hong Fang, “Negative thermal expansion and associated anomalous physical properties: review of the lattice dynamics theoretical foundation,” Reports on Progress in Physics 79, 066503 (2016).
- Chen et al. (2015) Jun Chen, Lei Hu, Jinxia Deng, and Xianran Xing, “Negative thermal expansion in functional materials: controllable thermal expansion by chemical modifications.” Chemical Society Reviews 44, 3522–3567 (2015).
- Lind (2012) Cora Lind, “Two Decades of Negative Thermal Expansion Research: Where Do We Stand?” Materials 5, 1125–1154 (2012).
- Romao et al. (2013) C P Romao, K J Miller, C A Whitman, M A White, and B A Marinkovic, “Negative thermal expansion (thermomiotic) materials.” in Comprehensive Inorganic Chemistry II: From elements to applications (Elsevier, 2013) pp. 127–151.
- Takenaka (2012) Koshi Takenaka, “Negative thermal expansion materials: technological key for control of thermal expansion.” Science and Technology of Advanced Materials 13, 013001 (2012).
- Barrera et al. (2005) G D Barrera, JAO Bruno, THK Barron, and N L Allan, “Negative thermal expansion,” Journal of Physics: Condensed Matter 17, R217–R252 (2005).
- Liang (2010) Er-Jun Liang, “Negative thermal expansion materials and their applications: A survey of recent patents.” Recent Patents on Materials Science 3, 106–128 (2010).
- Ren et al. (2018) Xin Ren, Raj Das, Phuong Tran, Tuan Duc Ngo, and Yi Min Xie, “Auxetic metamaterials and structures: a review,” Smart Materials and Structures 27, 023001–39 (2018).
- Fang and Dove (2013) Hong Fang and Martin T Dove, “Pressure-induced softening as a common feature of framework structures with negative thermal expansion.” Physical Review B 87, 214109 (2013).
- Fang et al. (2013a) Hong Fang, Anthony E Phillips, Martin T Dove, Matthew G Tucker, and Andrew L Goodwin, “Temperature-dependent pressure-induced softening in Zn(CN)2.” Physical Review B 88, 144103 (2013a).
- Wei et al. (2020) Zhongsheng Wei, Lei Tan, Guanqun Cai, Anthony E Phillips, Ivan da Silva, Mark G Kibble, and Martin T Dove, “Colossal pressure-induced softening in scandium fluoride,” Physical Review Letters 124, 255502 (2020).
- Mittal et al. (2018) R Mittal, M K Gupta, and S L Chaplot, “Phonons and anomalous thermal expansion behaviour in crystalline solids,” Progress in Materials Science 92, 360–445 (2018).
- Note (1) It may be argued that since, in comparison with the perovskite structure, ScF3 has no A-site cation, it should have more flexibility for rotational motions and hence for the tension effect to operate. However, this is a real-space intuition that doesn’t necessarily correspond directly with what is really found. Since vibrations are correctly resolved into a summation of normal modes with wave vectors in reciprocal space, any effects of the A-site cation should be interpreted in terms of their effect on the frequencies of the relevant phonon modes. And here we see that the effect is not to block the motion at all. First, comparing for ScF3 Li et al. (2011); Handunkanda et al. (2015); Oba et al. (2019); Handunkanda et al. (2015) and SrTiO3 Stirling (1972) the values of the lowest-frequency modes along the – directions in reciprocal space, as defined later, we find very similar frequency values and hence the capacity for similar RUM amplitudes. Furthermore, in many cubic perovskites there is a softening of the RUM phonon frequencies on cooling towards a displacive phase transition, which will increase the RUM amplitude.
- Greve et al. (2010) Benjamin K Greve, Kenneth L Martin, Peter L Lee, Peter J Chupas, Karena W Chapman, and Angus P Wilkinson, “Pronounced negative thermal expansion from a simple structure: Cubic ScF3.” Journal of the American Chemical Society 132, 15496–15498 (2010).
- Hu et al. (2016) Lei Hu, Jun Chen, Andrea Sanson, Hui Wu, Clara Guglieri Rodriguez, Luca Olivi, Yang Ren, Longlong Fan, Jinxia Deng, and Xianran Xing, “New Insights into the Negative Thermal Expansion: Direct Experimental Evidence for the “Guitar-String” Effect in Cubic ScF3.” Journal of the American Chemical Society 138, 8320–8323 (2016).
- Li et al. (2011) Chen W Li, Xiaoli Tang, J A Muñoz, J B Keith, S J Tracy, D L Abernathy, and B Fultz, “Structural relationship between negative thermal expansion and quartic anharmonicity of cubic ScF3.” Physical Review Letters 107, 195504 (2011).
- Hibble et al. (2002a) Simon J Hibble, Simon M Cheyne, Alex C Hannon, and Sharon G Eversfield, “Beyond Bragg scattering: the structure of AgCN determined from total neutron diffraction.” Inorganic Chemistry 41, 1042–1044 (2002a).
- Hibble et al. (2002b) Simon J Hibble, Simon M Cheyne, Alex C Hannon, and Sharon G Eversfield, “CuCN: a polymorphic material. Structure of one form determined from total neutron diffraction.” Inorganic Chemistry 41, 4990–4992 (2002b).
- Tucker et al. (2005) Matthew G Tucker, Andrew L Goodwin, Martin T Dove, David A Keen, Stephen A Wells, and John S O Evans, “Negative thermal expansion in ZrW2O8: mechanisms, rigid unit modes, and neutron total scattering.” Physical Review Letters 95, 255501 (2005).
- Chapman et al. (2005) Karena W Chapman, Peter J Chupas, and Cameron J Kepert, “Direct observation of a transverse vibrational mechanism for negative thermal expansion in Zn(CN)2: an atomic pair distribution function analysis.” Journal of the American Chemical Society 127, 15630–15636 (2005).
- Tucker et al. (2007a) Matthew G Tucker, David A Keen, John S O Evans, and Martin T Dove, “Local structure in ZrW2O8 from neutron total scattering.” Journal of Physics: Condensed Matter 19, 335215 (2007a).
- Dapiaggi et al. (2008) Monica Dapiaggi, HyunJeong Kim, Emil S Božin, Simon J L Billinge, and Gilberto Artioli, “Study of the negative thermal expansion of cuprite-type structures by means of temperature-dependent pair distribution function analysis: Preliminary results.” Journal of Physics and Chemistry of Solids 69, 2182–2186 (2008).
- Chapman and Chupas (2009) Karena W Chapman and Peter J Chupas, “Anomalous thermal expansion of cuprites: A combined high resolution pair distribution function and geometric analysis.” Chemistry of Materials 21, 425–431 (2009).
- Hibble et al. (2013) Simon J Hibble, Ann M Chippindale, Elena Marelli, Scott Kroeker, Vladimir K Michaelis, Brandon J Greer, Pedro M Aguiar, Edward J Bilbé, Emma R Barney, and Alex C Hannon, “Local and average structure in zinc cyanide: toward an understanding of the atomistic origin of negative thermal expansion.” Journal of the American Chemical Society 135, 16478–16489 (2013).
- Bridges et al. (2014) F Bridges, T Keiber, P Juhas, S J L Billinge, L Sutton, J Wilde, and Glen R Kowach, “Local vibrations and negative thermal expansion in ZrW2O8.” Physical Review Letters 112, 045505 (2014).
- Wendt et al. (2019) David Wendt, Emil Bozin, Joerg Neuefeind, Katharine Page, Wei Ku, Limin Wang, Brent Fultz, Alexei V Tkachenko, and Igor A Zaliznyak, “Entropic elasticity and negative thermal expansion in a simple cubic crystal,” Science Advances 5, eaay2748–8 (2019).
- Yang et al. (2016) C Yang, P Tong, J C Lin, X G Guo, K Zhang, M Wang, Y Wu, S Lin, P C Huang, W Xu, W H Song, and Y P Sun, “Size effects on negative thermal expansion in cubic ScF3,” Applied Physics Letters 109, 023110 (2016).
- Hu et al. (2018) Lei Hu, Feiyu Qin, Andrea Sanson, Liang-Feng Huang, Zhaoo Pan, Quang Li, Qiang Sun, Lu Wang, Fangmin Guo, Umut Aydemir, Yang Ren, Chengjun Sun, Jinxia Deng, Guiliana Aquianti, James M Rondinelli, Jun Chen, and Xianran Xing, “Localized symmetry breaking for tuning thermal expansion in ScF3 nanoscale frameworks,” Journal of the Americna Chemical Society 140, 4477–4480 (2018).
- Bird et al. (2020) T A Bird, J Woodland-Scott, L Hu, M T Wharmby, J Chen, A L Goodwin, and M S Senn, “Anharmonicity and scissoring modes in the negative thermal expansion materials and ,” Physical Review B 101, 064306 (2020).
- Note (2) The authors of reference \rev@citealpLi:2011dn give a slightly misleading qualitative opinion on the fexibility of the ScF6 octahedra on the basis of ab initio molecular dynamics simulations, because they constructed their atomic configuration with an odd number of unit cells along each direction. This choice automatically excludes all Rigid Unit Modes, and thus their simulation is unrealistic and their conclusions, albeit qualitative, are affected by this choice.
- Fang et al. (2014) Hong Fang, Martin T Dove, and Anthony E Phillips, “Common origin of negative thermal expansion and other exotic properties in ceramic and hybrid materials.” Physical Review B 89, 214103 (2014).
- Oba et al. (2019) Yusuke Oba, Terumasa Tadano, Ryosuke Akashi, and Shinji Tsuneyuki, “First-principles study of phonon anharmonicity and negative thermal expansion in ,” Physical Review Materials 3, 033601 (2019).
- Handunkanda et al. (2015) Sahan U Handunkanda, Erin B Curry, Vladimir Voronov, Ayman H Said, Gian G Guzmán-Verri, Richard T Brierley, Peter B Littlewood, and Jason N Hancock, “Large isotropic negative thermal expansion above a structural quantum phase transition.” Physical Review B 92, 134101–6 (2015).
- Handunkanda et al. (2016) Sahan U Handunkanda, Connor A Occhialini, Ayman H Said, and Jason N Hancock, “Two-dimensional nanoscale correlations in the strong negative thermal expansion material ScF3,” Physical Review B 94, 214102–6 (2016).
- Giddy et al. (1993) A P Giddy, M T Dove, G S Pawley, and V Heine, “The determination of rigid-unit modes as potential soft modes for displacive phase transitions in framework crystal structures.” Acta Crystallographica Section A: Foundations of Crystallography 49, 697–703 (1993).
- Hammonds et al. (1996) Kenton D Hammonds, Martin T Dove, Andrew P Giddy, Volker Heine, and Bjoern Winkler, “Rigid-unit phonon modes and structural phase transitions in framework silicates,” American Mineralogist 81, 1057–1079 (1996).
- Heine et al. (1999) Volker Heine, Patrick R L Welche, and Martin T Dove, “Geometrical Origin and Theory of Negative Thermal Expansion in Framework Structures,” Journal of the American Ceramic Society 82, 1793–1802 (1999).
- Dove (2019) Martin T Dove, “Flexibility of network materials and the Rigid Unit Mode model: a personal perspective,” Philosophical Transactions of the Royal Society A: Mathematical, Physical and Engineering Sciences 377, 20180222–18 (2019).
- Stirling (1972) W G Stirling, “Neutron inelastic scattering study of the lattice dynamics of strontium titanate: harmonic models.” Journal of Physics C: Solid State Physics , 2711–2730 (1972).
- Note (3) It is worth remarking about the origin of the stiffness in the structural polyhedra in general and more specifically in the case of the ScF6 octahedra in ScF3. Much of the original literature on RUMs concerned silica and silicates, which are conventionally considered to have strong covalent bonds defining the shape and stiffness of the structural SiO4 tetrahedra. However, it is important to understand that the rigidity of structural polyhedra do not rely on covalent bonding, because tension within the polyhedra in a system where the bonding is more ionic in nature can arise from mutual repulsions between the vertex ions because of size effects and Coulomb interactions. This is pertinent for ScF3. The Sc–F bond is relatively strong, as evidenced by the large value of the Sc–F stretching frequency in the phonon dispersion curves Li et al. (2011); Handunkanda et al. (2015); Oba et al. (2019), indicating some degree of covalent bonding, but it is more likely that the ionic size and electrostatic interactions will be most important in the F–Sc–F bond-bending forces.
- POL (2019) “Polaris technical information, STFC ISIS Neutron and Muon Source, https://www.isis.stfc.ac.uk/pages/polaris-technical-information.aspx,” (2019).
- Larson and Von Dreele (2004) A C Larson and R B Von Dreele, General Structure Analysis System (GSAS), Tech. Rep. LAUR 86-748 (Los Alamos National Laboratory, 2004).
- Toby (2001) Brian H Toby, “EXPGUI, a graphical user interface for GSAS,” Journal of Applied Crystallography 34, 210–213 (2001).
- Arnold et al. (2014) O Arnold, J C Bilheux, J M Borreguero, A Buts, S I Campbell, L Chapon, M Doucet, N Draper, R Ferraz Leal, M A Gigg, V E Lynch, A Markvardsen, D J Mikkelson, R L Mikkelson, R Miller, K Palmen, P Parker, G Passos, T G Perring, P F Peterson, S Ren, M A Reuter, A T Savici, J W Taylor, R J Taylor, R Tolchenov, W Zhou, and J Zikovsky, “Mantid—Data analysis and visualization package for neutron scattering and SR experiments,” Nuclear Inst. and Methods in Physics Research, A 764, 156–166 (2014).
- Tucker et al. (2007b) Matthew G Tucker, David A Keen, Martin T Dove, Andrew L Goodwin, and Qun Hui, “RMCProfile: reverse Monte Carlo for polycrystalline materials.” Journal of Physics: Condensed Matter 19, 335218–16 (2007b).
- Soper (2012) Alan K Soper, GudrunN and GudrunX, Tech. Rep. RAL-TR 13 (Rutherford Appleton Laboratory, 2012).
- Todorov et al. (2006) Ilian T Todorov, William Smith, Kostya Trachenko, and Martin T Dove, “DL_POLY_3: new dimensions in molecular dynamics simulations via massive parallelism,” Journal of Materials Chemistry 16, 1911–8 (2006).
- Gale (1997) Julian D Gale, “GULP: A computer program for the symmetry-adapted simulation of solids,” Journal of the Chemical Society, Faraday Transactions 93, 629–637 (1997).
- Gale and Rohl (2003) Julian D Gale and Andrew L Rohl, “The General Utility Lattice Program (GULP).” Molecular Simulation 29, 291–341 (2003).
- Tucker et al. (2001) Matthew G Tucker, Martin T Dove, and David A Keen, “Application of the reverse Monte Carlo method to crystalline materials,” Journal of Applied Crystallography 34, 630–638 (2001).
- Dove et al. (2002) Martin T Dove, Matthew G Tucker, and David A Keen, “Neutron total scattering method: simultaneous determination of long-range and short-range order in disordered materials.” European Journal of Mineralogy 14, 331–348 (2002).
- Keen et al. (2005) D A Keen, M G Tucker, and M T Dove, “Reverse Monte Carlo modelling of crystalline disorder,” Journal of Physics: Condensed Matter 17, S15–S22 (2005).
- Note (4) The recent study of Wendt et al Wendt et al. (2019) reports two anomalous findings, first that the mean F–F distance shrinks with increasing temperature, and second that the integrated area of the second F–F peak in the PDF decreases with temperature. In both cases these are contrary to what we have found. These two anomalous results may reflect the limitations of analysis of the PDF alone, without the support of a model. As the F–F peak broadens with temperature, the data become increasingly noisy, and the pair density within any fixed range will necessarily decrease. Furthermore, the analysis may also be affected by artefacts associated with untreated truncation effects at the maximum observable value of . Such problems highlight the value of making use of modelling approaches such as RMC, where the atomic model imposes reasonable physical constraints on the data analysis. The atomistic configuration RMC provides means that there is no ambiguity in assigning pair density where peaks are very broad or overlap, such as the 4 Å peak here, which encompasses both Sc–Sc and FF pairs. Figures S7–S9 in the Supplementary Information show the RMC-derived decomposition of the PDF into contributions from individual atomic pairs.
- Fang et al. (2013b) Hong Fang, Martin T Dove, Leila H N Rimmer, and Alston J Misquitta, “Simulation study of pressure and temperature dependence of the negative thermal expansion in Zn(CN)2.” Physical Review B 88, 104306 (2013b).
- Aleksandrov et al. (2002) K S Aleksandrov, V N Voronov, A N Vtyurin, S V Goryainov, N G Zamkova, V I Zinenko, and A S Krylov, “Lattice dynamics and hydrostatic-pressure-induced phase transitions in ScF3.” Journal of Experimental and Theoretical Physics 94, 977–984 (2002).
- Wells et al. (2002a) Stephen A Wells, Martin T Dove, and Matthew G Tucker, “Finding best-fit polyhedral rotations with geometric algebra,” Journal of Physics: Condensed Matter 14, 4567–4584 (2002a).
- Wells et al. (2002b) Stephen A Wells, Martin T Dove, Matthew G Tucker, and Kostya Trachenko, “Real-space rigid-unit-mode analysis of dynamic disorder in quartz, cristobalite and amorphous silica.” Journal of Physics: Condensed Matter 14, 4645–4657 (2002b).
- Wells et al. (2004) Stephen A Wells, Martin T Dove, and Matthew G Tucker, “Reverse Monte Carlo with geometric analysis – RMC+GA,” Journal of Applied Crystallography 37, 536–544 (2004).
- Note (5) In Figure 4(a) the sizes of the fluctuations of the ScF6 orientations and F–Sc–F angles are similar, but in Figure 4(b) the GASP analysis suggest that the motions of the F atoms associated with bond bending are rather larger than from rotations of the octahedra. These results are actually consistent with each other: the contribution to from the octahedral rotation will come from three axes, but there are 12 bending angles associated with deformation of the octahedra.
- Hui et al. (2005) Qun Hui, Matthew G Tucker, Martin T Dove, Stephen A Wells, and David A Keen, “Total scattering and reverse Monte Carlo study of the 105 K displacive phase transition in strontium titanate,” Journal of Physics: Condensed Matter 17, S111–S124 (2005).
- Note (6) But it would be wrong to say that it is the limiting case, because the model, being a simplified model, is not an exact representation of the actual material. In particular, the division between the three types of motion is not exactly the same. What we are demonstrating is that even in the limit of fairly flexible octahedra the GASP method will still identify whole-body rotations.
- Note (7) There are two important points to highlight in the two diagrams in Figure 4. The first is that the angular fluctuations in (a) increase linearly with temperature, in line with expectations from classical quasi-harmonic lattice dynamics. Second is that the distribution of atomic motion over the three components in (b) is more-or-less constant with temperature, reflecting phonon eigenvectors and again being fully consistent with classical quasi-harmonic lattice dynamics. In particular, although thermal motion is large at the higher temperature, it does not lead to any breakdown of the classical picture, contrary to the opinion expressed in reference \rev@citealpWendt:2019it.
- Note (8) We consider models in which the Sc–F bond is the sole rigid entity, with complete flexibility of the ScF6 octahedra, as for example in reference \rev@citealpWendt:2019it, to be over-flexible and unable to provide useful insights, not least because such models will predict the wrong signs of the Grüneisen parameters for many phonon modes. A similar situation was discussed with regard to NTE in Cu2O in reference \rev@citealpRimmer:2014dj, where the true rigid entity is the linear O–Cu–O trimer, and models that consider only the O–Cu bonds as the rigid entities are too flexible.
- Lazar et al. (2015) Petr Lazar, Tomáš Bučko, and Jürgen Hafner, “Negative thermal expansion of ScF3: Insights from density-functional molecular dynamics in the isothermal-isobaric ensemble.” Physical Review B 92, 224302–6 (2015).
- Bocharov et al. (2019) Dmitry Bocharov, Yuri Rafalskij, Matthias Krack, Mara Putnina, and Alexei Kuzmin, “Negative thermal expansion of ScF3: first principles vs empirical molecular dynamics,” IOP Conference Series: Materials Science and Engineering 503, 012001–5 (2019).
- Bocharov et al. (2020) D Bocharov, M Krack, Yu Rafalskij, A Kuzmin, and J Purans, “Ab initio molecular dynamics simulations of negative thermal expansion in ScF3: The effect of the supercell size,” Computational Materials Science 171, 109198 (2020).
- van Roekeghem et al. (2016) Ambroise van Roekeghem, Jesús Carrete, and Natalio Mingo, “Anomalous thermal conductivity and suppression of negative thermal expansion in ScF3.” Physical Review B 94, 020303–5 (2016).
- Note (9) In common usage, the term quasiharmonic model considers the effect of changes in volume on the phonon frequencies through the consequent changes in harmonic force constants, giving new harmonic phonon frequencies as modified by the anharmonic coupling of force constants to volume. The term renormalised phonon model considers how a renormalised harmonic Hamiltonian can result from a mean-field treatment of the anharmonic interactions between phonons, typically focussing on the fourth-order interactions.
- Dove (2009) Martin T Dove, Introduction to Lattice Dynamics (Cambridge University Press, Cambridge, 2009).
- Note (10) Importantly, the reverse Monte Carlo method is indeed capable of generating such distributions in cases where they genuinely exist; one clear example is that of the cubic phase of cristobalite Tucker et al. (2000).
- Du et al. (2019) Juan Du, Anthony E Phillips, Donna C Arnold, David A Keen, Matthew G Tucker, and Martin T Dove, “Structural study of bismuth ferrite BiFeO3 by neutron total scattering and the reverse Monte Carlo method,” Physical Review B 100, 104111 (2019).
- Dove et al. (1992) Martin T Dove, A P Giddy, and V Heine, “On the application of mean-field and landau theory to displacive phase transitions,” Ferroelectrics 136, 33–49 (1992).
- Dove et al. (1995) Martin T Dove, Volker Heine, and Kenton D Hammonds, “Rigid unit modes in framework silicates,” Mineralogical Magazine 59, 629–639 (1995).
- Dove et al. (1996) Martin T Dove, Manoj Gambhir, Kenton D Hammonds, Volker Heine, and Alexandra K A Pryde, “Distortions of framework structures.” Phase Transitions 58, 121–143 (1996).
- Gambhir et al. (1997) Manoj Gambhir, Volker Heine, and Martin T Dove, “A one-parameter model of a rigid-unit structure,” Phase Transitions 61, 125–139 (1997).
- Dove et al. (1999) Martin T Dove, Manoj Gambhir, and Volker Heine, “Anatomy of a structural phase transition: theoretical analysis of the displacive phase transition in quartz and other silicates.” Physics and Chemistry of Minerals 26, 344–353 (1999).
- Tkachenko and Zaliznyak (2019) Alexey V Tkachenko and Igor A Zaliznyak, “Criticality, entropic elasticity, and negative thermal expansion of a coulomb floppy network: ScF3-inspired theory for a class of ionic solids,” (2019), arXiV:1908.11643.
- Wang et al. (2015) Lei Wang, Cong Wang, Ying Sun, Kewen Shi, Sihao Deng, Huiqing Lu, Pengwei Hu, and Xiaoyun Zhang, “Metal fluorides, a new family of negative thermal expansion materials,” Journal of Materiomics 1, 106–112 (2015).
- Note (11) The research group of Angus Wilkinson has explored several fluorides with crystal structures analogous to ScF3, including materials with various levels of doping Morelock et al. (2013, 2014); Hancock et al. (2015); Morelock et al. (2015); Hester and Wilkinson (2018). Many examples display phase transitions involving rotations of octahedra and which appear to be continuous (second-order). These phase transitions will be accompanied by the softening of the RUM phonons on cooling towards the transition temperature, through the types of anharmonic interactions discussed in this paper as described by equation VII. We have shown that such a variation of the renormalised phonon frequency with temperature will lead to a reduction, or even elimination, of NTE Fang et al. (2014), as also demonstrated in recent calculations van Roekeghem et al. (2016); Oba et al. (2019).
- Dove et al. (2015) M T Dove, M G Tucker, T Zhang, A E Phillips, and J Du, “Structural origin of negative thermal expansion in ScF3,” (2015), STFC ISIS Neutron and Muon Source, DOI: 10.5286/ISIS.E.RB1510519.
- Rimmer et al. (2014) Leila H N Rimmer, Martin T Dove, Björn Winkler, Dan J Wilson, Keith Refson, and Andrew L Goodwin, “Framework flexibility and the negative thermal expansion mechanism of copper(I) oxide Cu2O.” Physical Review B 89, 214115 (2014).
- Tucker et al. (2000) Matthew G Tucker, Matthew P Squires, Martin T Dove, and David A Keen, “Dynamic structural disorder in cristobalite: neutron total scattering measurement and reverse Monte Carlo modelling.” Journal of Physics: Condensed Matter 13, 403–423 (2000).
- Morelock et al. (2013) Cody R Morelock, Benjamin K Greve, Leighanne C Gallington, Karena W Chapman, and Angus P Wilkinson, “Negative thermal expansion and compressibility of Sc1-xYxF3 ().” Journal of Applied Physics 114, 213501 (2013).
- Morelock et al. (2014) Cody R Morelock, Justin C Hancock, and Angus P Wilkinson, “Thermal expansion and phase transitions of -AlF3,” Journal of Solid State Chemistry 219, 143–147 (2014).
- Hancock et al. (2015) Justin C Hancock, Karena W Chapman, Gregory J Halder, Cody R Morelock, Benjamin S Kaplan, Leighanne C Gallington, Angelo Bongiorno, Chu Han, Si Zhou, and Angus P Wilkinson, “Large negative thermal expansion and anomalous behavior on compression in cubic ReO3-type AIIBIVF6: CaZrF6 and CaHfF6.” Chemistry of Materials 27, 3912–3918 (2015).
- Morelock et al. (2015) Cody R Morelock, Leighanne C Gallington, and Angus P Wilkinson, “Solid solubility, phase transitions, thermal expansion, and compressibility in Sc1-xAlxF3.” Journal of Solid State Chemistry 222, 96–102 (2015).
- Hester and Wilkinson (2018) Brett R Hester and Angus P Wilkinson, “Negative Thermal Expansion, Response to Pressure and Phase Transitions in CaTiF6,” Inorganic Chemistry 57, 11275–11281 (2018).