Evidence for superconductivity in Rb metal above 55 GPa pressure
Abstract
The only alkali metal known to be superconducting at ambient pressure is Li at 0.4 mK. Under 30 GPa pressure Tc for Li rises to 14 K. In addition, nearly 50 years ago the heavy alkali metal Cs was reported to become superconducting near 1.3 K at 12 GPa. In the present experiment the superconductivity of Cs under pressure is confirmed. In addition, strong evidence is presented in electrical resistivity measurements that neighboring Rb also becomes superconducting near 2 K at 55 GPa as it enters the oC16 phase, as for Cs, where Tc decreases under the application of pressure. It would seem likely that under the right temperature/pressure conditions all alkali metals, including metallic hydrogen, will join the ranks of the superconducting elements. With the addition of Rb, 55 of the 92 naturally occurring elements are superconducting at ambient or high pressure.
At first glance the alkali metals would appear to be rather mundane compared to the other elemental solids in the periodic table: none of the alkalis are magnetic and only one, Li, is known to be superconducting at ambient pressure, but then only at the exceedingly low temperature of 0.4 mK tuoriniemi . Their simple bcc structure and free-electron character make the alkalis ideal simple metals with very nearly spherical Fermi surfaces. As for all monovalent metals, their low electronic density of states favors weak electron-phonon interactions that are insufficient, except for Li, to support superconductivity schilling .
The large atomic volume and very high compressibility of all alkalis lead to significant changes in their properties under the application of very high pressures. The atomic volume of Cs metal shrinks five-fold under 50 GPa takemura . As a result, the once free-electron alkalis with cubic bcc crystal structure become electrides under sufficient pressure where the conduction electrons no longer surround each cation but are forced into interstitial lattice sites neaton , becoming de facto anions dye . In addition, the marked pressure-induced changes in the character of the conduction electrons through s-p transfer in Li and Na and s-d transfer in K, Rb, and Cs are believed to destabilize the highly symmetric low-pressure structures (bcc, fcc) and favor complex, lower symmetry structures young . Another result of the marked change in conduction electron character is that the superconducting transition temperature of Li soars from 0.4 mK at ambient pressure to 14 K at 30 GPa shanti , an increase by over four orders of magnitude.
Superconductivity in Cs near 1.3 K was reported many years ago by Wittig wittig1 for pressures near 12 GPa, close to the pressure where Cs enters the orthorhombic oC16 phase schwarz2 . In the Supplemental Material sm very recent experiments are presented that confirm these early results. It would seem likely that all alkali metals will become superconducting under pressure, yet no superconductivity has been found for the following: Na in the pressure/temperature ranges to 58 GPa above 4 K schilling ; K to 17 GPa above 1.5 K or to 44 GPa above 4 K schilling , as well as to 94 GPa above 1.35 K debessai ; Rb to 21 GPa above 50 mK ullrich2 . Schwarz et al. schwarz have suggested that a search for Rb should be carried out for pressures of 50 GPa and above since this is the pressure where Rb takes on the same oC16 phase where Cs becomes superconducting.
In the present electrical resistivity studies on Rb the pressure range of previous work has been extended to GPa for temperatures above 1.3 K. Strong evidence is given for the appearance of superconductivity in Rb near 2 K following a sluggish phase transition at 50 GPa from the tetragonal tI4 to the orthorhombic oC16 phase. Rb thus becomes the 55th elemental superconductor in the periodic table.
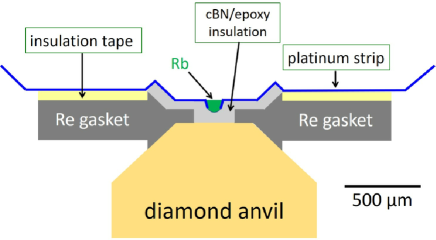
Polycrystalline Cs (99.98 % pure) and Rb (99.75 % pure) samples were obtained in sealed glass ampules from Alfa Aesar. A diamond anvil cell (DAC) made of conventional and binary CuBe schilling1 was used to generate pressures to GPa between two opposed diamond anvils (1/6-carat, type Ia) with 0.5 mm diameter culets. The force applied to the anvils was generated by a stainless-steel diaphragm filled with He gas daniels . The Re gasket (250 m thick) was preindented to 80 m and a 250 m diameter hole drilled through the center of the preindentation area. A cBN-epoxy insulation layer was compressed onto the surface of the gasket (see Fig 1). Four Pt strips (4 m thick) were then placed on the insulation layer, acting as electrical leads for the four-point resistivity measurement. Further details are published elsewhere shimizu ; lim .
Whereas a small, thin lanthanide sample was normally placed on top of the four Pt strips (see Fig 1 in Ref lim ), the extreme softness of the alkali metals led to large sample extrusion out of the cell, necessitating shaping a bowl in the cBN-epoxy cell to contain the alkalis, as illustrated in Fig 1. Because of their extreme air sensitivity, the Cs and Rb samples were loaded into the bowl-shaped chamber inside a glove box filled with ultra-high purity Ar gas.
The DAC was inserted into an Oxford flow cryostat capable of varying temperature from ambient to 1.3 K. Pressure was determined at room temperature using the diamond vibron akahama . With a ruby manometer the pressure can normally be measured in situ over the entire temperature range chijioke . Unfortunately, the ruby sphere would normally sink into the soft alkali metal, the R1 fluoresence being lost. However, in one experiment to 14 GPa on Cs the ruby fluorecence could be detected to low temperatures, revealing a pressure increase of on cooling from 295 to 4 K. This pressure increase was used in experiments on both Cs and Rb to estimate the pressure at low temperatures from the measured vibron pressure at ambient temperature.
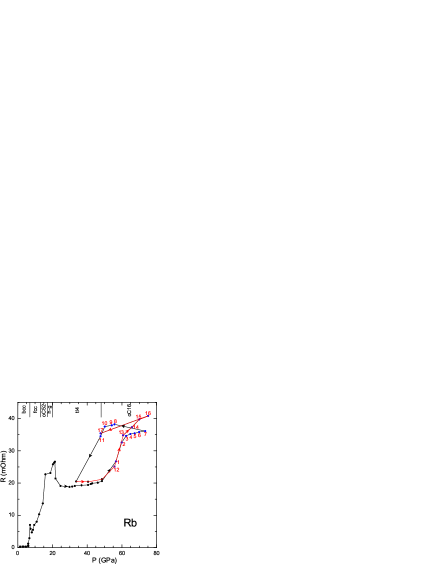
In Fig 2 the resistance of Rb at ambient temperature (295 K) is plotted versus both increasing and decreasing pressure. Initially the pressure was slowly increased along the black line to 73 GPa, then decreased to 34 GPa, followed by an increase along the red line to 75 GPa, then decreased to 48 GPa. The many structural phase transitions that occur in pure Rb over this pressure range are shown at the top of the graph nelmes . A small peak in R(P) marks the bcc fcc transition 7 GPa with a much more prominent structure in R(P) for the next transitions. In the tetragonal tI4 phase the resistance changes little with pressure, but begins to increase sharply after passing the tI4 oC16 phase boundary at 48 GPa. The sizable hysteresis in R(P) reveals the first-order nature of this transition that is reportedly very sluggish at ambient temperature schwarz . The R(P) dependence and structural phase diagram at ambient temperature for Cs bear a marked similarity to those for Rb in Fig 2 if the differences in the transition pressures are taken into account, as seen in the Supplemental Material sm .
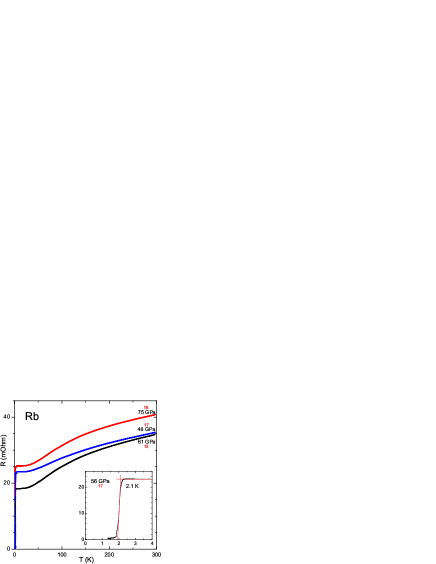
In Fig 3 the temperature-dependent resistance of Rb is displayed for 61, 75, and 48 GPa, measured in that order, as seen by comparing the order of measurement numbers to those in Fig 2. At all three pressures a sharp drop in the resistance is observed near 2 K (see inset in Fig 3 for 56 GPa), as would be expected for a superconducting transition. As discussed below, it is common in superconducting alkali metals that the resistivity fails to disappear completely in high-pressure experiments. A marked negative curvature is evident in the temperature dependence of the resistance, a hallmark of transition metals. This is clear evidence for strong d-character in the conduction electrons of Rb at these very high pressures arising from s-d electron transfer.
In Fig 4 a sharp drop in the resistance is also observed for Rb at 71 GPa. As the magnet field is increased to 480 G, the sharp drop is seen to shift to progressively lower temperatures at the rate mK/G. The sharp resistance drop plus the shift of the transition to lower temperatures in a magnetic field give strong evidence that Rb metal becomes superconducting for pressures above 56 GPa.
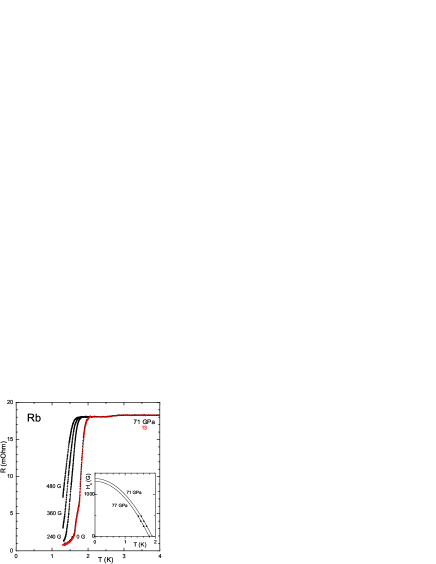
In the inset in Fig 4 the dependence of the critical temperature on magnetic field is plotted at both 71 and 77 GPa. From a fit to these data using the standard expression ashcroft3 , the critical field at 0 K, can be estimated for Rb to be 1370 and 1310 G at 71 and 77 GPa, respectively. In the Supplemental Material sm it is pointed out that for Cs 270 G at 15.1 GPa. For Li from Ref shanti 800 and 1000 G at 22 and 24 GPa, respectively.
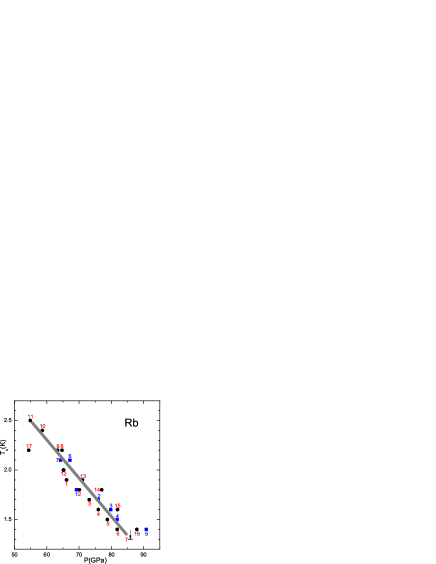
In Fig 5 the dependence of the resistance of Rb on temperature is plotted to 3 K at various pressures. Except for the data at 56 GPa, the transition temperature is seen to decrease monotonically with increasing pressure. Interestingly, the resistance at 3 K shows a non-monotonic pressure dependence that reflects that shown in Fig 2 for the resistance at room temperature. The dependences of T on pressure from Fig 5 and a second experiment are shown in Fig 6, yielding from the straight-line fit the value mK/GPa.
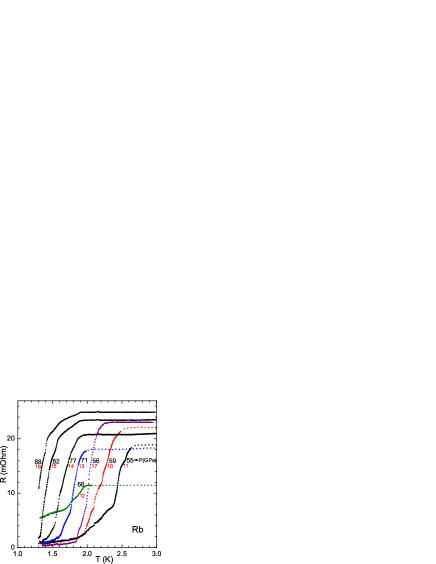
From the above results it is clear that superconductivity in Rb above 1.3 K only occurs in its oC16 phase, but not in the tI4 phase. As this sluggish phase transition begins with increasing pressure, the resistivity starts to rise, as seen in Fig 2. At 48 GPa the sample is still in the tI4 structure and no superconductivity is observed. However, upon increasing pressure to 56 GPa (points 1 or 12) the resistance has clearly increased indicating that at least some of the tI4 phase has transitioned to oC16. That only a partial superconducting transition is seen for points 1 and 12 (see Fig 5 for point 12) shows that at 56 GPa the sample is still in a mixed phase region. As the pressure is increased further to 75 GPa (points 12-16 or 1-7 in Fig 2), the resistivity begins to saturate, possibly indicating the phase transition to oC16 is nearing completion. At the same time the superconducting transition becomes more complete. At no pressure does the resistance get closer than 98% to zero. This effect of non-zero resistance observed here for Rb as well as for Cs in the Supplemental Material sm and earlier by Ullrich ullrich ; wittig , arises from the non-ideal geometry in the resistivity experiment and the inhomogeneous pressure distribution across the sample.
Since the superconducting transition temperature for Rb decreases monotonically with increasing pressure, the highest value of would occur at the lowest pressure, as long as the sample remains in the high-pressure oC16 phase. These facts were used to maximize the value of by decreasing pressure from point 16 to 17 (or from point 7 to points 10 or 11) in Fig 2 where Rb is still mainly in the oC16 phase on unloading due to the large GPa hysteresis in R(P). Indeed, the data in Fig 5 for points 10, 11, 17 place in the range 2.2 - 2.5 K, the highest values measured in the present experiment.
The importance of the oC16 phase for the appearance of superconductivity above 1.3 K is not restricted to Rb but also applies to neighboring Cs, as emphasized by Schwarz et al. schwarz . Once in the oC16 phase, the transition temperature for both Rb and Cs is observed to decrease with increasing pressure. In addition, for Cs the transition between the same two phases tI4 oC16 is accompanied by a marked increase in the resistivity, as seen in the Supplemental Material sm . In electronic structure calculations on Rb by Fabbris et al. fabbris a prominent peak structure already appears in the density of states near the Fermi level for pressure near 16 GPa, the conduction electrons taking on a significant d-character. At the fcc oC52 phase transition a sizable enhancement in the density of states occurs. Perhaps the sudden appearance of superconductivity in Rb near 55 GPa is the result of a similar enhancement at the tI4 oC16 phase transition.
In the next lighter alkali metal K the tI4 oC16 transition also occurs, but not until the much higher pressure of 96 GPa lunde . M. Debessai debessai found no superconductivity in K above 1.35 K to 94 GPa pressure. A search for superconductivity in K to pressures higher than 1 Mbar would thus seem warranted.
In all three heavy alkali metals Cs, Rb, and K the importance of the pressure-induced s-d electron transfer has been emphasized. It is likely responsible for the transition from tetragonal tI4 to the lower symmetry orthorhombic oC16 structure. McMahan mcmahan has calculated the completion pressure for the s-d transfer in Cs and Rb to be 15 and 53 GPa, respectively, near the pressures where the tI4 oC16 transition in both cases begins, but also where the resistivity rises steeply and superconductivity appears. A parallel calculation mcmahan for K finds its s-d transfer to complete at GPa, a lower pressure than that for the tI4 oC16 transition.
In summary, a superconducting transition near 2 K has been observed in four-point electrical resistivity measurements on Rb for pressures above 55 GPa. The transition only occurs after Rb enters the orthorhombic oC16 phase which is marked by a sharp increase in the resistivity. decreases under pressure at the rate mK/GPa. In all respects these results parallel those found for Cs near 12 GPa pressure. Based on these results it is predicted that K will become superconducting near 1 Mbar pressure when it enters the same oC16 phase.
Acknowledgments. The authors would like to thank G. Fabbris for hepful comments on this manuscript. This research is supported by the National Science Foundation (NSF) through Grants No. DMR-1104742 and No. DMR-1505345 as well as by the Carnegie/DOE Alliance Center (CDAC) through NNSA/DOE Grant No. DE-FC52-08NA28554.
References
- (1) J. Tuoriniemi, K. Juntunen-Nurmilaukas, J. Uusvuori, E. Pentti, A. Salmela, and A. Sebedash, Nature (London) 447, 187 (2007).
- (2) J. S. Schilling, High Press. Research 26, 145 (2006).
- (3) K. Takemura, N. E. Christensen, D. L. Novikov, K. Syassen, U. Schwarz and M. Hanfland, Phys. Rev. B 61, 14399 (2000).
- (4) J. B. Neaton and N. W. Ashcroft, Nature 400, 141 (1999); J. Feng, R. G. Hennig, N. W. Ashcroft, and R. Hoffmann, Nature 451, 445 (2008); P. Söderlind, O. Erikson, B. Johansson, J. M. Wills, and A. M. Boring, Nature (London) 374, 524 (1995).
- (5) J. L. Dye, Science 301, 607 (2003).
- (6) D. A. Young, Phase Diagrams of the Elements (University of California Press, Berkeley, 1991).
- (7) S. Deemyad and J. S. Schilling, Phys. Rev. Lett. 91, 167001 (2003).
- (8) J. Wittig, Phys. Rev. Lett. 24, 812 (1970).
- (9) U. Schwarz, K. Takemura, M. Hanfland, and K. Syassen, Phys. Rev. Lett. 81, 2711 (1998).
- (10) See Supplemental Material at http:// for results of present high-pressure resistivity studies on Cs metal, which includes Refs. mcmahon ; ma .
- (11) M. I. McMahon, R. J. Nelmes, and S. Rakhi, Phys. Rev. Lett. 87, 255502 (2001).
- (12) Y. Ma, M. Eremets, A. R. Oganov, Y. Xie, I. Trojan, S. Medvedev, A. O. Lynkhov, M. Valle, and V. Prakapenka, Nature (London) 458, 182 (2009).
- (13) M. T. Debessai, Ph.D. thesis, Washington University in St Louis (2004).
- (14) K. Ullrich, C. Probst and J. Wittig, J. de Physique, Colloque 6, 463 (1978).
- (15) U. Schwarz, K. Syassen, A. Grzechnik, and M. Hanfland, Solid State Commun. 112, 319 (1999).
- (16) J. S. Schilling, in Proceedings of the 9th AIRAPT International High Pressure Conference, Albany, New York, July 24-29, 1983, edited by C. Homan, R. K. MacCrone and E. Whalley (North-Holland, New York, 1984); J. S. Schilling, Mater. Res. Soc. Symp. Proc. 22, 79 (1984).
- (17) W. B. Daniels and W. Ryschkewitsch, Rev. Sci. Instrum. 54, 115 (1983).
- (18) K. Shimizu, K. Amaya, and N. Suzuki, J. phys. Soc. Jpn. 74, 1345 (2005).
- (19) J. Lim, G. Fabbris, D. Haskel, and J. S. Schilling, Phys. Rev. B 91, 045116 (2015).
- (20) Y. Akahama and H. Kawamura, J. Appl. Phys. 100, 043516 (2006).
- (21) A. D. Chijioke, W. J. Nellis, A. Soldatov, and I. F. Silvera, J. Appl. Phys. 98, 114905 (2005).
- (22) R. J. Nelmes, M. I. McMahon, J. S. Loveday, and S. Rekhi, Phys. Rev. Lett. 88, 155503 (2002).
- (23) N. W. Ashcroft and N. D. Mermin, in Solid State Physics (Thomson Learning, Inc. 1976) p.745.
- (24) K. Ullrich, Ph.D. thesis, University of Cologne (1980).
- (25) J. Wittig, in Superconductivity in d- and f-Band Metals, edited by W. Buckel and W. Weber (Kernforschungszentrum, Karlsruhe, 1982) p. 321.
- (26) G. Fabbris, J. Lim, L. S. I. Veiga, D. Haskel, and J. S. Schilling, Phys. Rev. B 91, 085111 (2015).
- (27) L. F. Lundegaard, M. Marques, G. Stinton, G. J. Ackland, R. J. Nelmes, M. I. McMahon, Phys. Rev. B 80, 020101 (2009).
- (28) A. K. McMahan, Phys. Rev. B 29, 5982 (1984).