Ultrafast Quantum-path Interferometry Revealing the Generation Process of Coherent Phonons
Abstract
Optical dual-pulse pumping actively creates quantum-mechanical superposition of the electronic and phononic states in a bulk solid. We here made transient reflectivity measurements in an n-GaAs using a pair of relative-phase-locked femtosecond pulses and found characteristic interference fringes. This is a result of quantum-path interference peculiar to the dual-pulse excitation as indicated by theoretical calculation. Our observation reveals that the pathway of coherent phonon generation in the n-GaAs is impulsive stimulated Raman scattering at the displaced potential due to the surface-charge field, even though the photon energy lies in the opaque region.
pacs:
78.47.J-, 78.20.BhCoherent control is a technique of manipulating quantum states in materials using optical pulses Brumer1986 ; Rice1986 ; Scherer1991 . A wave packet in quantum mechanical superposition is created by the optical pulse via several quantum transition paths. In the case of a double-pulse excitation, wave packets created by transitions in each pulse and across the two pulses interfere and the generated superposition state is manipulated by controlling a delay between the two pulses Katsuki2018 ; Mashiko2018 . A contribution of individual quantum paths can be extracted from the interference pattern, which is referred to as quantum-path interferometry Austin2011 .
Coherent phonons are a temporally coherent oscillation of the optical phonons induced by the impulsive excitation of an ultrashort optical pulse Nelson1985 ; Merlin1997 ; Dekorsy2000 ; Misochko2001 ; Randi2017 ; Glerean2018 . Using coherent phonons and making a pump–probe-type optical measurement, we can directly observe the dynamics of the electron–phonon coupled states in the time domain for a wide variety of materials Zeiger1992 ; DeCamp2001 ; Katsuki2013 ; Cho1990 ; Dekorsy1993 ; Merlin1996 ; Misochko2000 ; Hase2003 ; Wu2008 ; Kamaraju2010 ; Norimatsu2014 ; Misochko2015 ; Riffe2007 ; Sun2017 . In this respect, the clarification of the generation mechanism of the coherent phonon is a fundamental subject as an ultrafast dynamical process Pfeifer1992 ; Kuznetsov1995 ; Stevens2002 . The generation mechanisms of coherent phonons are usually categorized as two types: a mechanism of impulsive stimulated Raman scattering (ISRS) Nelson1985 and a mechanism of displaced enhanced coherent phonons Zeiger1992 . In addition, for polar semiconductors such as GaAs, the screening of the surface-space-charge field Cho1990 ; Pfeifer1992 is considered to be another generation mechanism for opaque conditions. The generation mechanism of coherent phonons may become a controversial subject in the case of opaque-region pumping because impulsive absorption (IA) and ISRS processes coexist as possible quantum mechanical transition paths Nakamura2015 . A novel experimental technique is needed to shed light on this subject.
In the present work, we apply quantum-path interferometry to study the generation process of coherent optical phonons through the coherent control of electron-phonon coupled states in bulk solids. Coherent phonons are often coherently controlled using a pair of femtosecond pulses as pump pulses, and the phonon amplitude is enhanced or suppressed via the constructive or destructive interference of induced phonons Hase1996 ; Katsuki2013 . Unlike these earlier works, we used two relative-phase-locked pump pulses (pulses 1 and 2) and a delayed probe pulse (pulse 3) Hayashi2014 , for quantum-path interferometry. If the delay of the dual-pump pulses was controlled with subfemtosecond accuracy and if the electronic coherence was maintained during the dual pulses, electronic excited states were created as a quantum mechanical superposition; i.e., the electronic polarizations induced by pulses 1 and 2 interfered with each other. Meanwhile, polarization in the phonon system was coherently created with resulting interference within the phononic and electronic degrees of freedom. The probe pulse was used to monitor the interference fringe via heterodyne detection; i.e., via a change in the reflectivity as a function of the pump–pump delay and pump–probe delay . We could evaluate the electronic and phononic coherence times of the sample using this scheme. Furthermore, a theoretical estimation predicts a decisive difference in the interference fringes between ISRS and IA, and it will be shown that the dominant pathway of the generation of coherent phonons can be determined from the pump-pulse-delay-dependent interference pattern of generation efficiency.
A femtosecond optical pulse (central wavelength of 798 nm, pulse width of 50 fs) was split with a partial beam splitter into two pulses (i.e., pump and probe pulses). The pump pulse was introduced into a homemade Michelson-type interferometer to produce relative-phase-locked pump pulses (i.e., pulses 1 and 2), in which stability was within 6 %. The probe pulse (i.e., pulse 3) was irradiated with a controlled time delay. The optical bandpass filter (the center wavelength of 800 nm with the band width of 10 nm) was used for detecting the reflected probe pulse in order to reduce cancellation effects of Stokes and anti-Stokes components Nakamura2016 . We set the two pump pulses in a collinear condition with parallel polarization in the present experiments. The -vector direction of the two interfering pump pulses may affects to the interference fringes. The sample was a single crystal of n-GaAs with (100) orientation and kept at 90 K in a cryostat. Details of the experimental setting are described in the Supplemental Material Supplement .
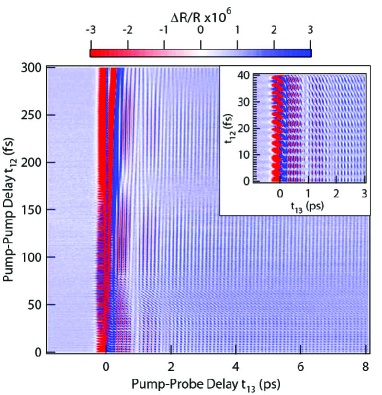
Figure 1 is a two-dimensional map of the transient reflectivity change plotted against the pump–probe delay and pump–pump delay . For a fixed value of , indicates an oscillation with periods of 115 and 128 fs, which are equal to the periods of the longitudinal-optical (LO) phonon and LO phonon-plasmon coupled mode (LOPC) at the point in GaAs Mooradian1967 ; Lee2008 ; Ishioka2011 ; Hu2012 . For a fixed value of , meanwhile, has a beat between a rapid oscillation with a period of 2.7 fs, which is nearly equal to that of the pump laser with a wavelength of 798 nm, and a slow oscillation with vibration periods of the LO phonon and LOPC.
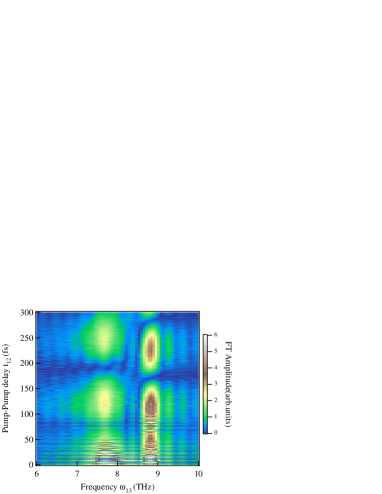
For fixed values of , a Fourier transformation of the signal was carried out with respect to . The Fourier transformation was performed over the interval of after the irradiation of pump 2 to avoid the spurious effect of excess charge in the very early stage and the effect of phonon decay at a late time. Figure 2 is a plot of the oscillation amplitude of the Fourier-transformed data against the frequency and delay . The figure shows that two modes of coherent oscillations are excited in the crystal.
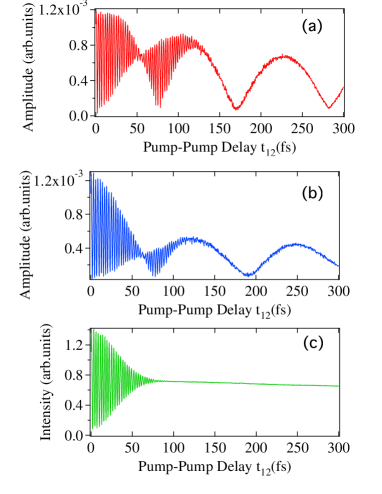
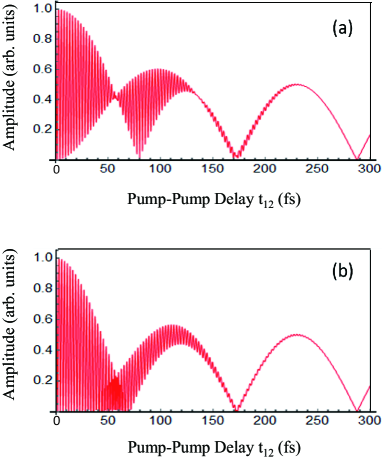
To see more clearly the dependence of the oscillation amplitude of the transient reflectivity, we plotted at peak values at frequency of 8.7 and 7.8 for the LO and LOPC modes, respectively. Figure 3 (a) presents results for the LO mode. The LOPC mode shown in Fig. 3(b) has qualitatively the same interference pattern as the LO mode. In Fig. 3 (a), the rapid oscillation with a period of fs is the interference fringe of the electronic states that memorized the phase of the pump-laser field. The slow oscillation with period fs is the interference fringe due to the coherence of phonons. The rapid interference fringes disappeared when we used the cross polarized pump pulses.
Note that the electronic coherence survives well after the overlapping of the pump pulses ends, as can be seen from comparison with the linear optical interference of the dual pulses (Fig. 3 (c)). This means that the optical phase of pulse 1 is imprinted on the electronic polarization and interferes with that of pulse 2. The most important feature of the interference pattern is the apparent collapse and revival of the electronic fringe at around fs. It will be shown below that this is due to a quantum-path interference peculiar to the ISRS process.
In the time-region where is large enough compared with and the pulse-width, it is safely assumed that the generation process and the detection process of coherent phonons are well separated. Hereafter, we concentrate on the generation process of LO phonons. See Supplemental Material Supplement for the theoretical treatment of the probe processes. For microscopic interactions that induce the coherent oscillation of LO phonons through the irradiation of ultrashort optical pulses, several models are conceivable, including the Fröhlich interaction Frohlich1954 and deformation-potential interaction Shen1965 . In the case of polar materials, it is considered that electrostatic interaction due to transient depletion field screening plays a central role Pfeifer1992 . It is known that there are two types of photoinduced current, the usual injection current following the real excitation of carriers and the shift current resulting from quantum mechanical polarization induced by optical pulses Kuznetsov1993 ; Sipe2000 , in ionic semiconductors Nastos2006 . The response of the shift current is usually faster than that of the injection current.
We assume a model Hamiltonian that describes the electron–phonon interaction as
| (1) | |||||
where is the electronic ground state of the crystal with energy and the excited state with energy . The creation and annihilation operators of the LO phonon at the point with energy are respectively denoted and . It is assumed that the dimensionless electron-phonon coupling constant is small and -independent, assuming a rigid-band shift. The parameter indicates the displacement of the potential, where all effects on deformation of the potential, such as the surface-space-charge field, are included. See the Supplemental Material Supplement for a detailed explanation.
Within the rotating-wave approximation, the interaction Hamiltonian with a dual-pump pulse is given by
| (2) |
where is the transition dipole moment from to . is the temporal profile of the electric field of the pump pulse,
| (3) |
where is the carrier frequency of the laser pulse. Here, is the pulse envelope, which is assumed to have a Gaussian form, and is the amplitude of the electric field. A fundamental quantity used to describe the optical properties of crystals is the electric response function given by
| (4) |
which is obtained via the Fourier transform of the effective optical absorption spectrum .
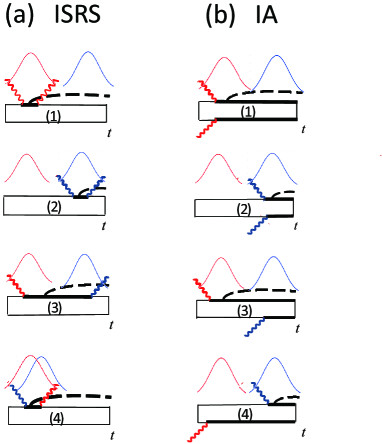
We adopt the density matrix formalism to derive the generation amplitude of the coherent phonon. The change of the amplitude of the reflectivity is proportional to the expectation value of the LO phonon coordinate except for constant factors. See Supplemental Material Supplement for the formula of spectrally resolved detection of reflectivity modulation. Figure 4 presents double-sided Feynman diagrams for the generation by ISRS (Fig. 4 (a)) and IA (Fig. 4 (b)). In Fig. 4, the propagators shown by thin lines correspond to the ground state and those shown by bold lines correspond to the excited state. The dashed lines represent the one-phonon state. Note that the Hermitian conjugate terms arise from the processes in the diagrams in which the upper and the lower propagators are interchanged, but these processes are ignored in Fig. 4 (a) for simplicity.
After a perturbation calculation, the amplitude of the oscillation of coherent phonons in the ISRS and IA processes, and are respectively given as
| (5) | |||||
in which and
| (6) | |||||
| (7) |
with , . The amplitude is proportional to the absolute values of . The first, second, third and fourth terms in Eq. (5) correspond to the processes (1) to (4) in Fig. 4, respectively. Details of the calculation are shown in Supplemental Material Supplement .
The actual calculation of the transient reflectivity can be done for real materials if the electric response function is given. In the calculation, we assumed a Lorentzian form, with eV and eV based on the absorption spectra Sturge1962 ; Casey1974 . The calculated fringe patterns are shown for ISRS (Fig.5(a)) and IA (Fig.5(b)). We found that the features in the fringe shown in Fig. 3 (a) are well reproduced if it is assumed that only the ISRS process contributes to the generation of coherent phonons. Furthermore, the overall line shape is in good agreement with experimental data .
Most important is the fact that the feature of the collapse and revival of the electronic fringe at around fs arises only from the ISRS process, while the IA signal does not yield any such feature. This is due to the quantum-path interference peculiar to ISRS. In Fig. 4 (a), the contribution arising from diagrams (1) and (2) gives rise only to the interference of the phonon, which is described by the first and second terms on the right-hand side of Eq. (5). The electronic interference arises from diagram (3) and (4), which corresponds to the third and fourth terms respectively in Eq. (5). It should be noted that the fourth term in is negligibly small for . Therefore, In ISRS, the electronic interference fringe appears only from the cross term between (1) + (2) and (3). At , this term vanishes owing to the destructive interference of the phonon. The high-frequency oscillation of the electronic fringe therefore disappears at fs. This is a manifestation of the path interference of the electronic and phononic degrees of freedom in the dual-pump process peculiar to the ISRS. Note that in the IA process, both the third and fourth terms in make a finite contribution so that the electronic fringe does not vanish at .
In Fig. 5 (a), the amplitude of the electronic fringe becomes small for fs. This is due to the dephasing caused by the inhomogeneous broadening of the continuous spectrum in the excited states. In the experimental curve in Fig. 3(a), the electronic fringe disappears almost completely for fs in contrast to the case in Fig. 5.
The finding of the ISRS dominance in coherent phonon generation in the opaque region is surprising because, in the opaque region, the phonon generation intensity in the IA process is generally estimated to be higher than that for ISRS Stevens2002 ; Nakamura2015 ; Kayanuma2017 . We conjecture that even if the coherent phonon may be generated in the excited state subspace, its coherence is quickly lost because of the ultrafast deformation of the adiabatic potentials due to the electronic relaxation in the excited state of bulk materials. This may be one of the differences in the atomic and molecular dynamics of solids compared with those of the gas phase, in which the excited electronic states are long protected from relaxation. In addition, it was revealed that the generation of the coherent phonon in GaAs is a quick process as deduced from ISRS dominance even in the opaque region. The underlying mechanism is the quantum mechanically induced shift current.
In summary, we made transient reflectivity measurements for n-GaAs using relative-phase-locked femtosecond pulses and found characteristic interference fringes, which are assigned to quantum-path interference in the generation of coherent phonons. Our observations and theory revealed that the pathway of coherent phonon generation in n-GaAs is ISRS at the displaced potential due to the surface-charge field, even though the photon energy lies in the opaque region. We demonstrated that optical dual-pulse pumping actively creates quantum-mechanical superposition of the electronic and phononic states in a bulk solid.
Acknowledgements.
The authors thank K. Norimatsu, K. Goto, H. Matsumoto, and F. Minami for their help with the experiments and calculation. K. G. N., Y. S., and Y. K. thank K. Ohmori, H. Chiba, H. Katsuki, and Y. Okano of the Institute of Molecular Science for their valuable advice on the experiments. This work was partially supported by Core Research for Evolutional Science and Technology of the Japan Science and Technology Agency, JSPS KAKENHI under grant numbers 25400330, 14J11318, 15K13377, 16K05396, 16K05410, 17K19051, and 17H02797, the Collaborative Research Project of Laboratory for Materials and Structures, the Joint Studies Program of the Institute of Molecular Science, National Institutes of Natural Sciences, and The Precise Measurement Technology Promotion Foundation.References
- (1) P. Brumer and M. Shapiro, Chem. Phys. Lett. 126, 541 (1986).
- (2) S.. A. Rice, D. J. Tannor, and R. Kosloff, J. Chem. Soc., Faraday Trans. 82, 2423 (1986).
- (3) N. F. Scherer, R. J. Carlson, A. Matro, M. Du, A. J. Ruggiero, V. Romero-Rochin, J. A. Cina, G. R. Fleming, and S. A. Rice, J. Chem. Phys. 95, 1487 (1991).
- (4) H. Katsuki, N. Takei, C. Sommer and K. Ohmori, Acc. Chem. Res. 51, 1174 (2018).
- (5) H. Mashiko, Y. Chisuga, I. Katayama, K. Oguri, H. Masuda, J. Takeda, and H. Gotoh, Nat. Commun. 9, 1468 (2018).
- (6) D. R. Austin and I. A. Walmsley, in CLEO/Europe and EQEC 2011 Conference Digest, OSA Technical Digest (CD) (Optical Society of America, 2011), paper CG_P1.
- (7) Y.-X. Yan, E. B. Gamble, and K. Nelson, J. Chem. Phys. 83, 5391 (1985).
- (8) R. Merlin, Solid State Commun. 102, 207 (1997).
- (9) T. Dekorsy, G. C. Cho, and H. Kurz, in Light Scattering in Solids III, (eds.) M. Cardona and G. Güntherodt, (Springer, Berlin, 2000) pp. 169–209.
- (10) O. V. Misochko, J. Exp. Theo. Phys. 92, 246 (2001).
- (11) F. Randi, M. Esposito, F. Giusti, O. Misochko, F. Parmigiani, D. Fausti, and M. Eckstein, Phys. Rev. Lett. 119, 187403 (2017).
- (12) F. Glerean, S. Marcantoni, G. Sparapassi, A. Blason, M. Esposito, F. Benatti, and D. Fausti, J. Phys. B doi:10.1088/1361-6455/ab0bdc (in press).
- (13) H. J. Zeiger, J. Vidal, T.K. Cheng, E. P. Ippen, G. Dresselhaus and M.S. Dresselhaus, Phys. Rev. B 45, 768 (1992).
- (14) M. F. DeCamp, D. A. Reis, P. H. Bucksbaum, and R. Merlin, Phys. Rev. B 64, 092301 (2001).
- (15) H. Katsuki, J. C. Delagnes, K. Hosaka, K. Ishioka, H. Chiba, E. S. Zijlstra, M. E. Garcia, H. Takahashi, K. Watanabe, M. Kitajima, Y. Matsumoto, K. G. Nakamura, and K. Ohmori, Nat. Commun. 4, 2801 (2013).
- (16) G. C. Cho, W. Kütt, and H. Kurz, Phys. Rev. Lett. 65, 764 (1990).
- (17) T. Dekorsy, T. Pfeifer, W. Kütt, and H. Kurz, Phys. Rev. B 47, 3842 (1993).
- (18) G. A. Garrett, T. F. Albrecht, J. F. Whitaker and R. Merlin, Phys. Rev. Lett. 77, 3661 (1996).
- (19) O. V. Misochko, K. Kisoda, K. Sakai, and S. Nakashima, Phys. Rev. B 61, 4305 (2000).
- (20) M. Hase, M. Kitajima, A. M. Constantinescu, and H. Petek, Nature 426, 51 (2003).
- (21) A. Q. Wu, X. Xu, and R. Venkatasubramanian, Appl. Phys. Lett. 92, 011108 (2008).
- (22) N. Kamaraju, S. Kumar, and A. K. Sood, Europhys. Lett. 92, 47007 (2010).
- (23) K. Norimatsu, J. Hu, A. Goto, K. Igarashi, T. Sasagawa, and K. G. Nakamura, Solid State Commun. 157, 58 (2013).
- (24) O. V. Misochko, J. Flock, and T. Dekorsy, Phys. Rev. B 91, 174303 (2015).
- (25) D. M. Riffe and A. J. Sabbah, Phys. Rev. B 76, 085207 (2007).
- (26) F. Sun. Q. Wu, Y. L. Wu, H. Zhao, C. J. Yi, Y. C. Tian, H. W. Liu, Y. G. Shi, H. Ding, X. Dai, P. Richard, and J. Zhao, Phys. Rev. B 95, 235108 (2017).
- (27) T. Pfeifer, T. Dekorsy, W. Kütt, and H. Kurz, Appl. Phys. A 55, 482 (1992).
- (28) A. V. Kuznetsov and C. J. Stanton, Phys. Rev. B 51, 7555 (1995).
- (29) T. E. Stevens, J. Kuhl, and R. Merlin, Phys. Rev. B 65, 144304 (2002).
- (30) K. G. Nakamura, Y. Shikano, and Y. Kayanuma, Phys. Rev. B 92, 144304 (2015).
- (31) M. Hase, M, Mizoguchi, H. Harima, S. Nakashima, M. Tani, K. Sakai, and M. Hangyo, Appl. Phys. Lett. 69, 2474 (1996).
- (32) S. Hayashi, K. Kato, K. Norimatsu, M. Hada, Y. Kayanuma, and K. G. Nakamura, Sci. Rep. 4, 4456 (2014).
- (33) K. G. Nakamura, K. Ohya, H. Takahashi, T. Tsuruta, H. Sasaki, S.-I. Uozumi, K. Norimatsu, M. Kitajima, Y. Shikano, and Y. Kayanuma, Phys. Rev. B 94, 024303 (2016).
- (34) See Supplementary Material for the details of experimental setup and sample, deformed harmonic potential and details of calculation of coherent phonon generation and spectrally resolved detection.
- (35) A. Mooradian and A. L. McWhorter, Phys. Rev. Lett. 19, 849 (1967).
- (36) J. D. Lee and M. Hase, Phys. Rev. Lett. 101, 235501 (2008).
- (37) K. Ishioka, A. K. Basak, and H. Petek, Phys. Rev. B 84, 235202 (2011).
- (38) J. Hu, O. V. Misochko, A. Goto, and K. G. Nakamura, Phys. Rev. B 86, 235145 (2012).
- (39) H. Fröhlich, Adv. Phys. 3, 325 (1954).
- (40) Y. R. Shen and N. Bloembergen, Phys. Rev. 137, A1787 (1965).
- (41) F. Nastos and J. E. Sipe, Phys. Rev. B 74, 035201 (2006).
- (42) J. E. Sipe and A. I. Shkrebtii, Phys. Rev. B 61, 5337 (2000).
- (43) A. V. Kuznetsov and C. J. Stanton, Phys. Rev. B 48, 10828 (1993).
- (44) M. D. Sturge, Phys. Rev. 127, 768 (1962).
- (45) H. C. Casey Jr., D. D. Sell, and K. W. Wecht, J. Appl. Phys. 46, 250 (1974).
- (46) Y. Kayanuma and K. G. Nakamura, Phys. Rev. B 95, 104302 (2017).