Also at ]Laboratoire PIMM, CNRS, Arts et Métiers, CNAM, HÉSAM Université, Paris, France
Flow and air-entrainment around partially submerged vertical cylinders
Abstract
In this study, a partially submerged vertical cylinder is moved at constant velocity through water, which is initially at rest. During the motion, the wake behind the cylinder induces free-surface deformation. Eleven cylinders, with diameters from to 16 cm, were tested at two different conditions: (i) constant immersed height and (ii) constant . The range of translation velocities and diameters are in the regime of turbulent wake with experiments carried out for and , where and are the Reynolds and Froude numbers based on . The focus here is on drag force measurements and relatively strong free-surface deformation up to air-entrainment. Specifically, two modes of air-entraiment have been uncovered: (i) in the cavity along the cylinder wall and (ii) in the wake of the cylinder. A scaling for the critical velocity for air-entrainment in the cavity has been observed in agreement with a simple model. Furthermore, for , the drag force varies linearly with .
I Introduction
The flow past ships rabaud2013 ; moisy2014 , or an emerged body such as bridge pillar, is a fundamental, familiar and fascinating sight. Measurements and modeling of this simple flow can have relevance for the floating offshore structures and renewable energy systems drew2009 ; lopez2013 . The disordered motion of the free-surface in the wake of the cylinder is related to the drag and lift effect experienced by the cylinder. The wake pattern is responsible for the surface waves and probably the air-entrainment. Many experiments and numerical works have considered a single vertical cylinder geometry in fully submerged situation schewe1983 ; braza2006 ; achenbach1981 ; breuer2000 ; tritton1959 . These works reported the drag force measurements on the circular cylinders as a function of the Reynolds number defined as with the velocity, the cylinder diameter and the kinematic viscosity of the fluid. In addition, Schewe schewe1983 showed the occurrence of a drag crisis at , which separates two distinct regions of nearly constant dimensionless drag coefficient, , defined later. In the subcritical regime, for , the drag coefficient and the vortex-shedding frequency characterized by Strouhal number , are almost constant at and . In this regime, the flow is characterized by a turbulent wake with a laminar boundary layer separation sumer2006 .
In contrast to fully submerged situations, few studies have been done taking into account the effect of a free-surface, which modifies the pressure distribution around the cylinder. From a numerical point of view, Refs kawamura2002 ; yu2008 ; koo2014 have computed the flow around a wall mounted cylinder, the evolution of and the free-surface elevation for varying from 27 000 up to 458 000. They showed that the vorticity and vary with depth along the cylinder and diminish close to the free-surface. Additionally, is strongly influenced by free-end effects for finite height cylinders sumner2004 . Specifically, Gonçalves et al. goncalves2015 reported experimental results in a recirculating water flume for cylinders piercing the free-surface with aspect ratio , where is the immersed cylinder height. They focused on forces and Particle Image Velocimetry (PIV) measurements for and ; the Froude number is defined as with m/s2 the gravitational acceleration. For constant , values increase with . Moreover, the velocity fields at revealed two recirculation regions: (i) below the cylinder and (ii) behind the cylinder. The measurements in Chaplin and Teigen chaplin2003 also showed that values reach a maximum with respect to . The evolution of values is in agreement with the experiments of Ducrocq et al. ducrocq2017 , who investigated the behavior of subcritical and supercritical flows for different slopes of a flume with and = 50 000.
In the recent years, numerical studies have reproduced the flow and drag around free-end cylinders for different yu2008 ; koo2014 ; benitz2016 ; ducrocq2017 , but there is a lack of data for around the drag crisis () and almost no data for strong free-surface deformations and rupture. An important numerical output is the mean interface elevation yu2008 ; koo2014 . Specifically, Keough et al. keough2016 analyzed the evolution of the fountain height ahead of the cylinder for varying between 45 000 and 380 000. They concluded a dependency of the fountain height with , and revealed that this evolution follows Bernoulli equation for small velocity. In addition, at the downstream side of the cylinder, the maximum cavity depth is also believed to scale with chaplin2003 . The cavity depth , is schematized in Fig. 1(c). Depending on cylinder diameter, the free-surface downstream is locally subjected to strong deformations and air-entrainment in the liquid phase. Benusiglio benusiglio2013 recently demonstrated a velocity threshold for air-entrainment in the cavity of a translating vertical cylinder. This phenomenon can induce drag reduction effects and it is independent of the drag crisis introduced before. At larger , Hay hay1947 reported an extensive study of the ventilated regime, where air reaches the bottom of the cylinder and creates a ventilated cavity with large waves and sprays above the nominal free-surface. Modern studies of the artificially or atmospherically ventilated structures (plates or hydrofoils) close to a free-surface are concerned with the stability of ventilated cavities (e.g. Ref. harwood2016 ) or properties such as the void fraction measurements makiharju2013 .
The goal of the present investigation is to quantify the onset of air-entrainment effects. In addition, the present study adds new experimental results and discusses new drag measurements carried out for and with specific focus on the onset of air-entrainment kiger2012 ; chirichella2002 ; peixinho2012 ; harwood2016 . This paper is composed of two parts. In the first part, the experimental setup is described together with an optical method for free-surface height reconstruction. In the second part, results are presented with the drag force measurements and the determination of the velocity threshold for air-entrainment in the cavity. Finally, the air-entrainment results are compared with a simple model based on the balance between acceleration and gravity.
II Experimental setup
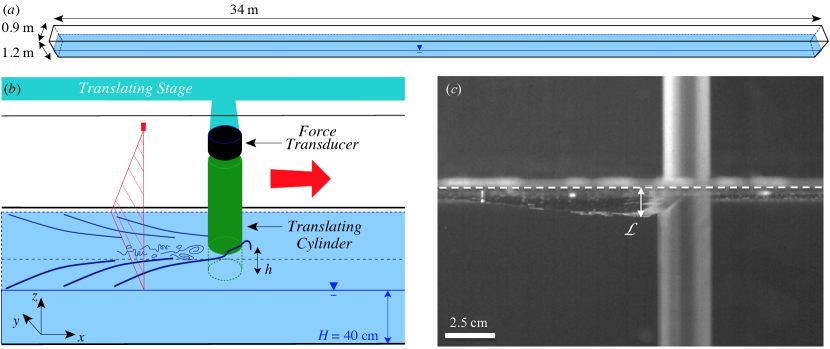
The cylinders are hollow and made of PMMA with external diameters of 30, 40, 50, 60, 70, 80, 90, 110 and 160 mm. Their total height is 65 cm and their wall thickness is 5 mm. The Young modulus of PMMA is 3.1 GPa. There are additional hollow cylinders of 14 and 25 mm made respectively of copper and aluminum. All the cylinders are clogged at their ends. These cylinders are attached vertically, perpendicular to the water free-surface, and translated on a carriage riding horizontally along the flume of 34 m length, 90 cm width and 120 cm height. The flume is shown schematically in Fig. 1(a). The carriage (162 kg) is driven by a 600 V AC motor (34 kg), producing a maximum torque of 102 N.m. A protocol is applied where first the velocity increases linearly along a distance of 3.5 meters. Then, the speed is maintained constant over a distance of 9.5 meters, where force measurements are acquired in steady state. Finally, the speed decreases linearly over a distance of 2 meters.
Two windows are located on the sidewalls of the flume, allowing local flow visualization around the cylinder. The determination of the critical velocity for air-entrainment behind the cylinder is based on images from a 2000 2000 pixels CCD camera (Basler aca2040) with focal length of 50 mm placed at 6 m from the start of the cylinder run. At this position along the flume, the force measurement (described later) has reached a steady state value. The spatial resolution of the CCD camera is 300 m per pixel and its acquisition frequency is 100 frames per second. Hence, bubbles smaller than 300 m can not be detected. A typical image of the cylinder passing through the field of view of the camera is shown in Fig. 1(c).
The working fluid is tap water and its height in the flume is constant: cm. The temperature is monitored hence the viscosity, the density, , and the surface tension, , of water are corrected to take into account these variations. Indeed between all experimentations, the temperature of water changes from 16.1 to 21.3∘C. In this range of temperature, density variation represents 0.1% tanaka2001 , while viscosity variations represent 13.3% huber2009 . The correction allows us to keep the error for between 0.8 to 9.8%. The Bond number aristoff2009 , , varies between 26 and 3450, which implies that the capillary effects are weak.
Two series of experiments were performed: (i) at constant immersion depth cm leading to ratio varying between 1.44 to 16.5 and (ii) at constant ratio . In total, 372 runs were performed, as summarized in Table 1, covering a wide range of and . The maximum blockage width of the experiment, , where the flume width, is 0.177, a value below the critical blockage width of 0.2 for confinement effect on three dimensional dynamics proposed by Griffith et al. griffith2011 . In addition, the ITTC 2002 muller-graf1987 requires a vertical confinement, . For the current experiments, at constant , the vertical confinement is 0.74 and for constant , this criteria is satisfied for cm.
| cm | |||||||||||
|---|---|---|---|---|---|---|---|---|---|---|---|
| (cm) | (cm) | ||||||||||
| 1.4 | 16.50 | 7 470 | 12 460 | 1.45 | 2.41 | 3.6 | 4 340 | 12 160 | 0.87 | 2.41 | |
| 2.5 | 9.20 | 12 460 | 24 910 | 1.00 | 2.10 | 6.4 | 9 730 | 21 880 | 0.81 | 1.82 | |
| 3 | 7.77 | 17 440 | 29 900 | 1.08 | 1.84 | 7.6 | 15 950 | 27 900 | 0.98 | 1.72 | |
| 4 | 5.75 | 24 900 | 39 860 | 1.00 | 1.60 | 10.2 | 19 930 | 39 860 | 0.80 | 1.60 | |
| 5 | 4.60 | 30 630 | 59 800 | 0.86 | 1.71 | 12.8 | 28 460 | 54 550 | 0.86 | 1.64 | |
| 6 | 3.83 | 40 840 | 71 460 | 0.87 | 1.52 | 15.3 | 29 180 | 68 080 | 0.65 | 1.52 | |
| 7 | 3.28 | 29 900 | 97 260 | 0.52 | 1.74 | 17.9 | 32 820 | 97 260 | 0.58 | 1.72 | |
| 8 | 2.87 | 34 040 | 122 510 | 0.50 | 1.70 | 20.4 | 34 040 | 116 710 | 0.49 | 1.69 | |
| 9 | 2.55 | 34 880 | 119 600 | 0.41 | 1.42 | 23.0 | 34 880 | 119 600 | 0.41 | 1.42 | |
| 11 | 2.09 | 39 860 | 188 870 | 0.35 | 1.62 | 28.1 | 39 860 | 184 370 | 0.35 | 1.62 | |
| 16 | 1.44 | 40 860 | 239 190 | 0.20 | 1.20 | 39.9 | 39 860 | 239 190 | 0.20 | 1.20 | |
II.1 Force measurements
A piezoelectric sensor (Kistler 9327C), placed above the cylinder (see drawing in Fig. 1(b)) measures the axial force acting on the whole cylinder with a sensitivity of -7.8 pC/N. The sensor is connected to a charge amplifier equipped with a low pass filter of 30 Hz. The contribution of air drag is neglected. Indeed, when is minimum, the maximum error on is about 0.8%. Force signals are filtered using a moving average on 20 points. In order to measure the effect of air-entrainment on drag forces, a time average is performed on during 5 s at constant translating velocity. It is denoted . The drag coefficient can thus be defined as:
| (1) |
The Strouhal number, defined earlier, is found to be close to for cm, using the peak of from the spectrum of lift force signal. However, for larger diameters, the signal of lift force is noisy, presumably due to the turbulent flow or vibrations of the carriage. Moreover, the range of studied here and the materials used here suggest natural frequencies which are well separated from those associated with vortex-induced vibration, which is the motion induced on the elastic cylinder interacting with the turbulent fluid flow. Such vortex-induced vibration phenomena of the elastic cylinder deformation would act like an oscillator inducing several modes corresponding to different vortex sheddings, observed by several authors fujarra2001 ; sarpkaya2004 ; williamson2004 ; franzini2012 .
II.2 Optical method
The parameter that needs to be measured is the elevation of the free-surface. The height at rest is well controlled. However, when the cylinder passes through the observation area, the light from a vertical laser sheet located above the flume and pointing to the free-surface, represented in red in Fig. 1(b), is shifted vertically from its initial position. The shift is the difference between the interface at rest and the deformed free-surface. It is proportional to the elevation of the free-surface. The images are captured by a camera placed on the top of the flume with a low incident angle to the free-surface. The proportionality is calibrated by recording images of the laser sheet at five known positions over 25 mm. This technique is able to detect free-surface heights with a precision estimated to mm.
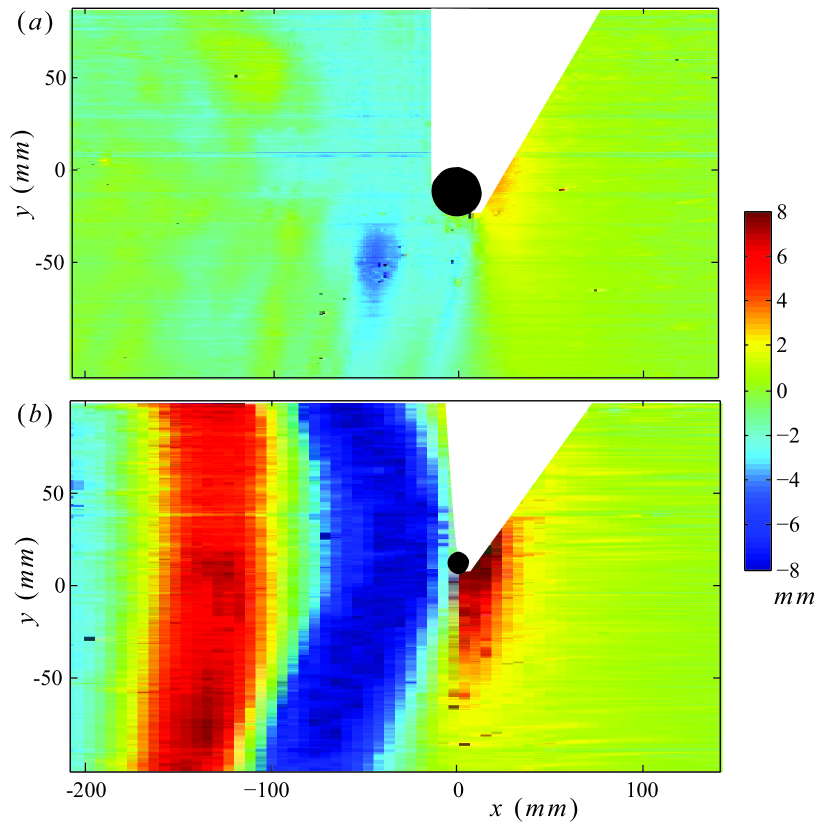
Figure 2 presents examples of free-surface reconstructions using the optical method for . Two are shown: (a) and (b) . When the increases, the free-surface experiences elevations of larger amplitude. The diagrams allow to distinguish the fountain height upstream of the cylinders. It is also possible to see the angle of the V-shaped wakes. For the V-shaped wake induces a planar wave downstream of the cylinder. Note that this method and other optical methods (e.g. Ref. phdgomit ) are restricted by the dispersion of the laser due to the cylinder turbulent wake. Hence, the present technique is limited for small and .
III Results and discussion
The results consist on drag measurements, surface elevation measurements and image analysis. These have been obtained for different cylinder diameters translated at various speeds with constant immersion and constant ratio . The different modes of air-entrainment are depicted and used to detect the critical velocity for air-entrainment in the cavity. The scaling of the velocity can be explained using a simple model described below.
III.1 Drag measurements
In this section, force measurements are reported in a range of and , such that the transition to air-entrainment is observed. Figure 3 presents drag coefficients measurements for different cylinder diameters as a function of , at constant cm and at constant ratio . Filled (resp. empty) symbols correspond to cases without (resp. with) air-entrainment in the cavity behind the cylinder. The error bars correspond to the standard deviation of the . The results obtained are compared with results of Schewe schewe1983 for single phase flow. Additional results of Refs. yu2008 ; goncalves2015 on surface piercing cylinders are represented for the same range of and . In accordance with previous studies, the drag coefficient is found to be about 30% smaller for surface piercing cylinders than for single phase flows. The numerical results of Yu et al. yu2008 at three different and a constant ratio are in good agreement with the present measurements. The results of Gonçalves et al. goncalves2015 for a ratio of show a nearly constant drag coefficient at higher values than the present study. In their experiments the cylinder is attached to the walls of the flume and the aspect ratio is varied by varying the water depth. Moreover, their maximum based on the cylinder diameter is , lower than the present values and below the threshold of air-entrainment. This may explain their highest values.
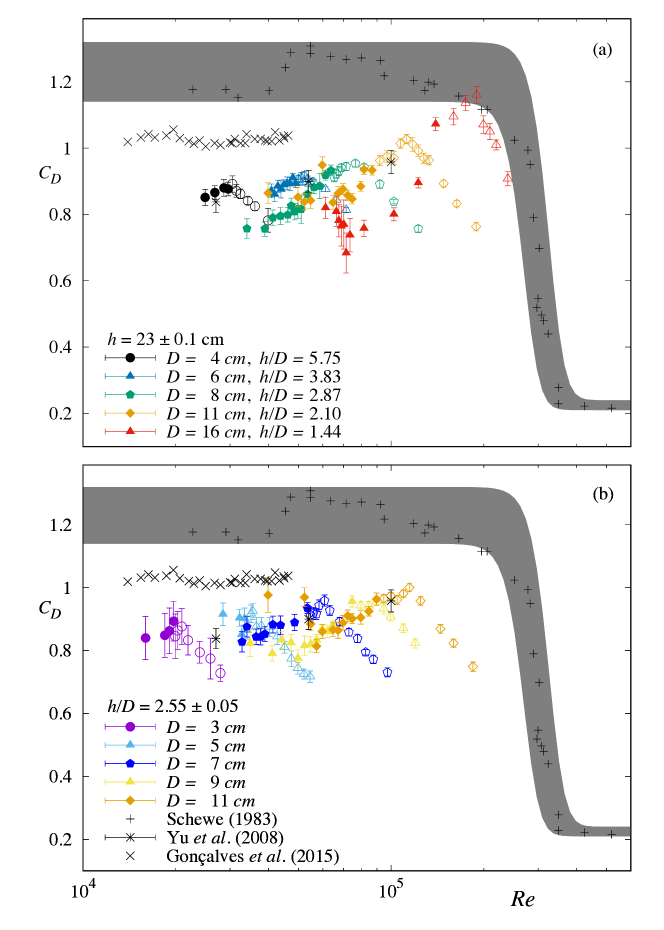
In the present study, the drag coefficient first increases with the then decreases after air-entrainment occurred in the cavity downstream the cylinder. Air-entrainment is defined when the first bubble is observed or monitored from the camera images (i.e. bubble larger than 300 m). In figure 3, for small or large diameters , values first increase with after the appearance of first air bubbles. Then, values decrease from 10% for the 4 cm diameter cylinder to 26% at maximum for the 11 cm diameter cylinder. The existence of drag reduction effect could be explained by the modification of pressure distribution along the cylinder.
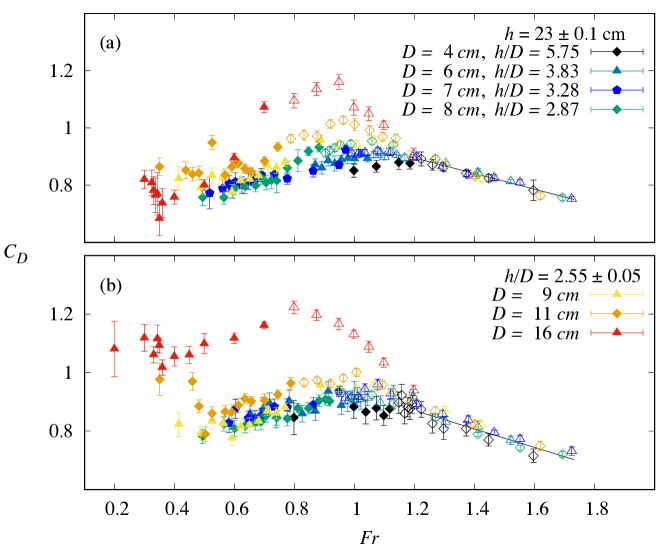
In order to study the influence of gravity effect, the drag coefficient is also plotted as a function of for a constant immersion depth, cm, in Fig. 4(a) and for constant ratio, , in Fig. 4(b). As in Fig. 3, filled (resp. empty) symbols correspond to measurements without (resp. with) air-entrainment in the cavity. In both cases, the evolution of the drag coefficient clearly shows a transition occurring at . For , is roughly larger for large or . For , after air-entrainment, values are monotonous and seem to vary linearly with . A similar linear behavior has also been observed in granular flows around an immersed cylinder chehata2003 .
III.2 Air-entrainment
Two mechanisms of air-entrainment are revealed: (i) in the wake thanks to vortices and (ii) in a cavity behind the cylinder. For cm (), air-entrainment occurs in the cavity along the cylinder exclusively. This cavity yu2008 ; koo2014 forms viscous cusps where air-entrainment is systematically injected. Once air bubbles form below the cavity, they are carried downstream into the wake. The bubbles created by air-entrainment in the cavity have an equivalent diameter ranging from 6 mm for cm to 8.5 mm for cm.
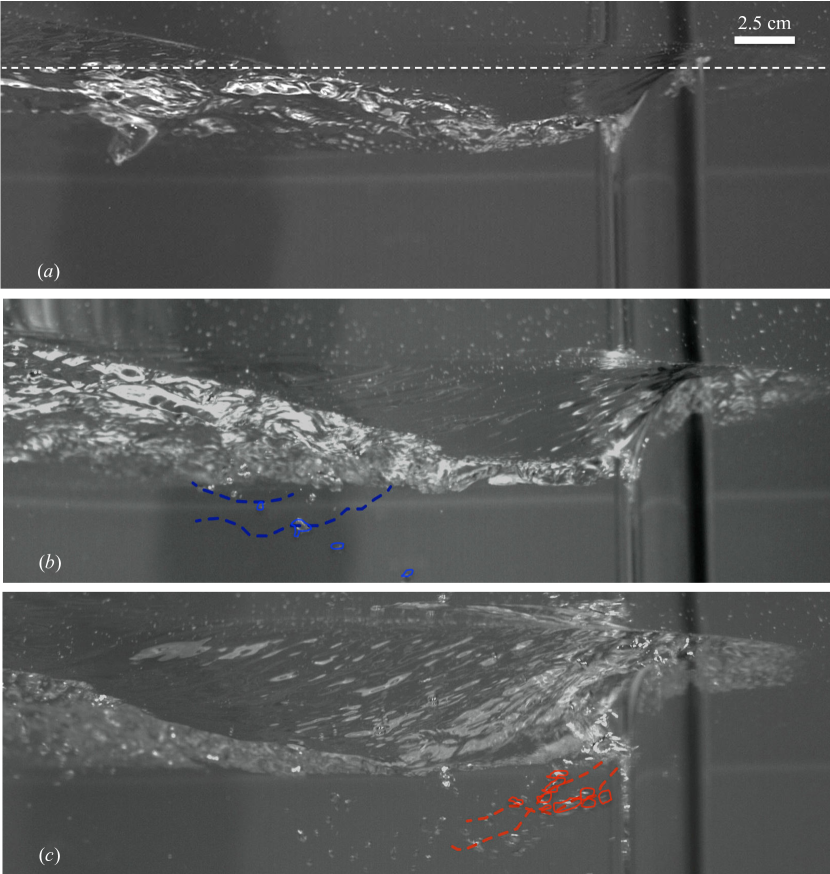
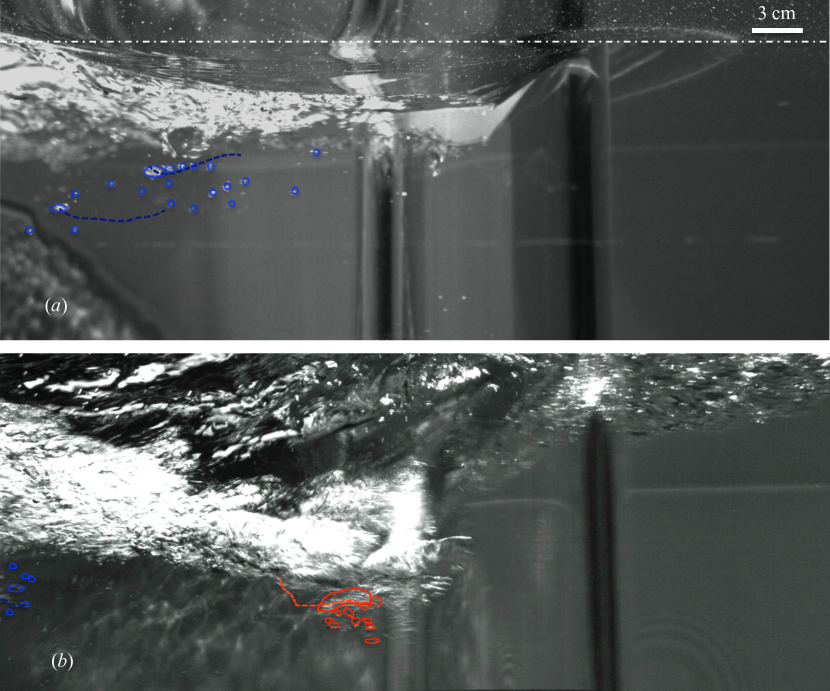
For cm, air-entrainment first appears in the wake when is increased. Then, as the velocity increases, air-entrainment also appears in the cavity. For a cylinder of 5 cm diameter, Fig. 5(a), at , shows free-surface deformation without air-entrainment. In Fig. 5(b) at , air-entrainment occurs in the cylinder wake. Finally, in Fig. 5(c), at , the cavity induces air-entrainment more intensely. For cm and higher , the mechanisms of air-entrainment presented in Fig. 6 are similar. Air-entrainment appears in the wake, see Fig. 6(a), then in the cavity, see Fig. 6(b). The corresponding movies are available as supplementary materials.
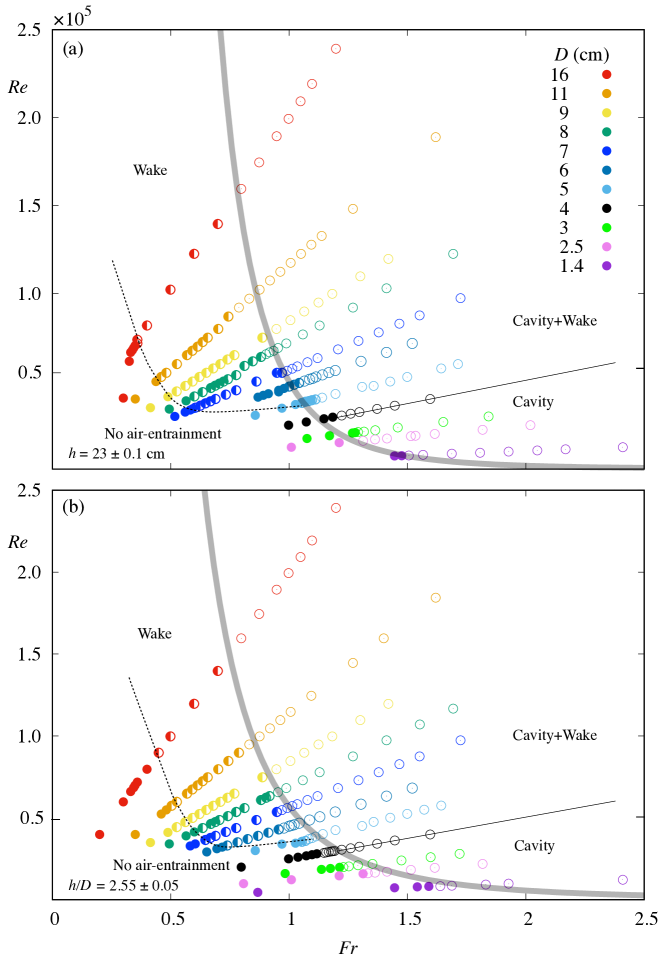
A summary of all our observations is presented in Fig. 7, for both constant and . In both cases, several regimes are observed where the different modes of air-entrainment are: (i) in the wake, (ii) in the cavity and (iii) in the wake and the cavity. Boundaries can be drawn between the different regimes and it is the purpose of the model below to explain the nature of some of these boundaries. The main difference between the two diagrams is the area of the wake region, which is wider for large diameters and constant . For small , the onset of air-entrainment occurs at smaller presumably because of the size of the recirculation below the free-surface benitz2016 ; goncalves2015 . Additionally, the fact that the two diagrams are almost indistinguishable suggests that the immersed height, , has little effect on the air-entrainment when cm and . Hence, air entrainment is mainly due to the free-surface dynamics and deformation.
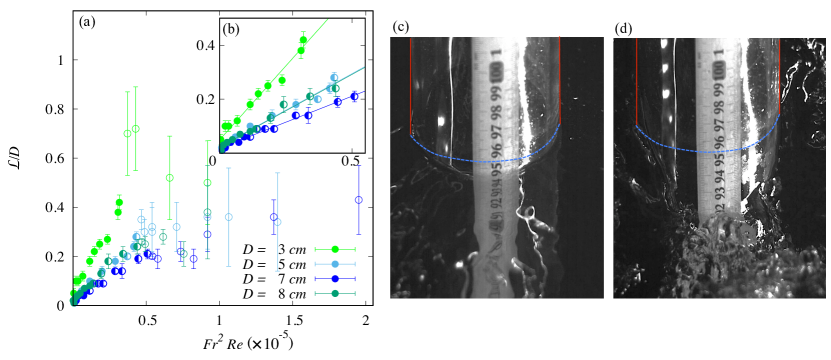
Indeed, the main feature associated to air-entrainment is the deformation of the cavity behind the cylinder. The optical method described earlier and the direct observations of graduations along the cylinder allowed to measure the cavity depth for various conditions. Specifically, the observations of graduated cylinders are reported in Fig. 8: as a function of . represents the mean value from 10 snapshots (see Fig. 8(c) and (d)). The error bars are the maximum observed deviation from the mean value. Clearly, the behavior is nonlinear, typically after air-entrainment takes place. However, in the range of before air-entrainment, varies linearly with . The proportionality coefficients seem to decrease with the diameter. These measurements are insufficient to provide a definite scaling of the cavity height. In fact, the cavity is unsteady and the liquid motion is more disordered as the velocity increases.
Air-entrainment phenomenon in the cavity could be explained using the model developed by Benusiglio benusiglio2013 where the acceleration of the cavity is balanced by the gravitational acceleration . is controlled by the vortex shedding frequency , calculated from the Strouhal number. In the range of of the present study, is assumed constant () schewe1983 although some studies have shown its variability upon the cylinder aspect ratio farivar1981 ; fox1993 ; benitz2016 . The acceleration of the cavity of depth is defined as follows:
| (2) |
In equation (2), is determined using Bernoulli’s equation between two positions upstream and downstream of the cylinder. At upstream position the mean flow velocity is whereas at the downstream position the flow velocity is taken as the maximum velocity of a Rankine vortex li2008 where is the circulation around half of the cylinder , and represents the core radius of the vortex. The parameter scales with the boundary layer thickness schlichting1955 . With these assumptions, Benusiglio benusiglio2013 proposed a scaling for :
| (3) |
which has not been validated experimentally or numerically. However, our current measurements, see Fig. 8, using the direct cavity depth observations, seem to be consistent with , which is equivalent to equation (3). Finally, air-entrainment occurs when , therefore equation (2) leads to the critical velocity for air-entrainment in the cavity :
| (4) |
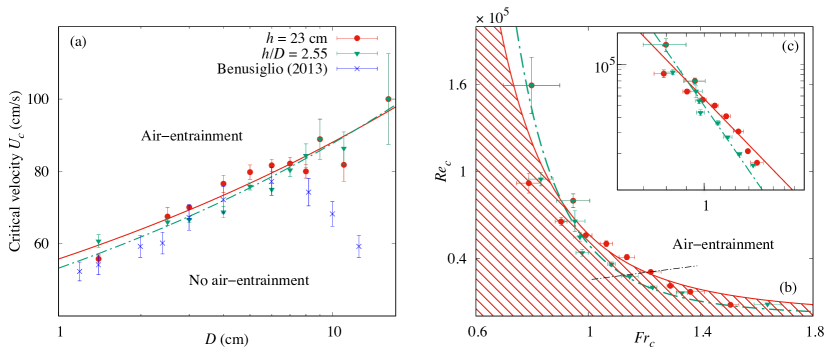
Figure 9(a) shows the critical velocity for air-entrainment in the cavity as a function of at constant immersion cm and constant . The error bars of correspond to the velocity step between the maximum velocity when air-entrainment is not obseved and the velocity where the first bubble appears. The evolution of is fitted with power laws of for and for cm. Experimental results show good agreements with the theoretical model introduced with equation (4). The simple model based on energy conservation with Bernoulli’s equation predicts the appearance of air-entrainment in the cavity. Additional data from Benusiglio benusiglio2013 are also plotted and fit well the present data for cm. For larger diameters, the critical velocity given by Benusiglio benusiglio2013 refers to air-entrainment in the cylinder wake like in Fig. 5(), while our present data refers only to air-entrainment in the cavity. Figure 9() presents the evolution of as a function of , based on the critical velocity . The dimensionless form of the equation (4) is . The evolution of is fitted with a power law of for 0.1 cm and for 2.55 0.05, in good agreement with the prediction of the model. The red shaded area refers to the range of dimensionless parameters where no air-entrainment in the cavity occurs. The black dashed-doted line represents the threshold above which air-entrainment occurs in the wake and in the cavity. Hence, air-entrainment requires large inertial effects or strong gravity effects. It is interesting to note that the stability diagram in Fig. 9() is consistent with the results of Kumagai et al. kumagai2011 for horizontal cylinder translating beneath an air-water interface.
IV Conclusions
Experimental results on the dynamics of the flow around a vertical translated cylinder have been presented. These deal with the turbulent regime before the so-called fully ventilated regime when air reaches the bottom of the cylinder. There is a critical velocity for the onset of air-entrainement. Then, three modes of air-entrainment are observed depending on the diameter and the translating velocity. For cm, air-entrainment only occurs in the cavity downstream of the cylinder. For cm, air-entrainment first appears in the wake and then also in the cavity when or is increased. This study focuses on air-entrainment in the cavity, where forces, flow visualization and critical velocities for air-entrainment are reported at constant or . Drag force measurements show an increase of the drag coefficient with followed by a decrease after air-entrainment occurred in the cavity. A similar evolution is observed for versus . Moreover, for , the drag for all diameters overlap and vary linearly with . The threshold velocity for air-entrainment in the cavity scales as: , i.e , which is in good agreement with the scaling of the model of Benusiglio benusiglio2013 . In the future, the shape of the cavity will be studied in more details in order to quantify the contribution of wetting properties aristoff2009 ; truscott2014 and the capillary-gravity waves.
Acknowledgements.
The authors acknowledge the financial support of the Normandy council and European Union ERDF funding’s through the NEPTUNE project. We thank Antoine Bonnesoeur and Claude Houssin for his engineering support and Paul François for his help with the experiments. Our work has also benefited from exchanges with Yuji Tasaka (U. Hokkaido) and Jimmy Philip (U. Melbourne).References
- [1] M. Rabaud and F. Moisy. Ship wakes: Kelvin or mach angle? Phys. Rev. Lett., 110(21):214503, 2013.
- [2] F. Moisy and M. Rabaud. Mach-like capillary-gravity wakes. Phys. Rev. E, 90(2):023009, 2014.
- [3] B. Drew, A. R. Plummer, and M. N. Sahinkaya. A review of wave energy converter technology. Proc. Inst. Mech. Eng. A, 223(8):887–902, 2009.
- [4] I. López, J. Andreu, S. Ceballos, I. M. de Alegría, and I. Kortabarria. Review of wave energy technologies and the necessary power-equipment. Rene. Sust. Energy Rev., 27:413–434, 2013.
- [5] G. Schewe. On the force fluctuations acting on a circular cylinder in crossflow from subcritical up to transcritical Reynolds numbers. J. Fluid Mech., 133:265–285, 1983.
- [6] M. Braza, R. Perrin, and Y. Hoarau. Turbulence properties in the cylinder wake at high Reynolds numbers. J. Fluids Struct., 22(6):757–771, 2006.
- [7] E. Achenbach and E. Heinecke. On vortex shedding from smooth and rough cylinders in the range of Reynolds numbers 6 to 5. J. Fluid Mech., 109:239–251, 1981.
- [8] M. Breuer. A challenging test case for large eddy simulation: high Reynolds number circular cylinder flow. Inter. J. Heat Fluid Flow, 21(5):648–654, 2000.
- [9] D. J. Tritton. Experiments on the flow past a circular cylinder at low Reynolds numbers. J. Fluid Mech., 6(04):547–567, 1959.
- [10] B. M. Sumer and J. Fredsøe. Hydrodynamics around cylindrical strucures, volume 26 of Advanced Series on Ocean Engineering. World scientific, 2006.
- [11] T. Kawamura, S. Mayer, A. Garapon, and L. Sørensen. Large eddy simulation of a flow past a free surface piercing circular cylinder. J. Fluids Eng., 124(1):91–101, 2002.
- [12] G. Yu, E. J. Avital, and J. J. Williams. Large eddy simulation of flow past free surface piercing circular cylinders. J. Fluids Eng., 130(10):101304, 2008.
- [13] B. Koo, J. Yang, S. M. Yeon, and F. Stern. Reynolds and Froude number effect on the flow past an interface-piercing circular cylinder. Int. J. Nav. Archit. Ocean Eng., 6(3):529–561, 2014.
- [14] D. Sumner, J. L. Heseltine, and O. J. P. Dansereau. Wake structure of a finite circular cylinder of small aspect ratio. Exp. Fluids, 37(5):720–730, 2004.
- [15] R. T. Gonçalves, G. R. Franzini, G. F. Rosetti, J. R. Meneghini, and A. L. C. Fujarra. Flow around circular cylinders with very low aspect ratio. J. Fluids Struct., 54:122–141, 2015.
- [16] J. R. Chaplin and P. Teigen. Steady flow past a vertical surface-piercing circular cylinder. J. Fluids Struct., 18(3):271 – 285, 2003.
- [17] T. Ducrocq, L. Cassan, J. Chorda, and H. Roux. Flow and drag force around a free surface piercing cylinder for environmental applications. Environ. Fluid Mech., 17:629–645, 2017.
- [18] M. A. Benitz, D. W. Carlson, B. Seyed-Aghazadeh, Y. Modarres-Sadeghi, M. A. Lackner, and D. P. Schmidt. CFD simulations and experimental measurements of flow past free-surface piercing, finite length cylinders with varying aspect ratios. Comp. Fluids, 136:247–259, 2016.
- [19] S. J. Keough, I. L. Kermonde, A. Amiet, J. Philip, A. Ooi, J. P. Monty, and B. Anderson. Time resolved measurements of wake characteristics from vertical surface-piercing circular cylinders. In 20th Australian Fluid Mechanics Conference, Perth, December 2016.
- [20] A. Benusiglio. Indiscrétions aux interfaces. PhD thesis, Ecole Polytechnique, 2013.
- [21] A. Hay. Flow about semi-submerged cylinders of finite length. Technical report, Princeton University, 1947.
- [22] C. Harwood, Y. Young, and S. L. Ceccio. Ventilated cavities on a surface-piercing hydrofoil at moderate froude numbers: cavity formation, elimination and stability. J. Fluid Mech., 800:5–56, 2016.
- [23] S. A. Mäkiharju, C. Gabillet, B.-G. Paik, N. A. Chang, M. Perlin, and S. L. Ceccio. Time-resolved two-dimensional X-ray densitometry of a two-phase flow downstream of a ventilated cavity. Exp. Fluids, 54(7):1561, 2013.
- [24] K. T. Kiger and J. H. Duncan. Air-entrainment mechanisms in plunging jets and breaking waves. Annu. Rev. Fluid Mech., 44:563–596, 2012.
- [25] D. Chirichella, R. Gomez Ledesma, K. T. Kiger, and J. H. Duncan. Incipient air entrainment in a translating axisymmetric plunging laminar jet. Phys. Fluids, 14(2):781–790, 2002.
- [26] J. Peixinho, P. Mirbod, and J. F. Morris. Free surface flow between two horizontal concentric cylinders. Eur. Phys. J. E, 35(3):19, 2012.
- [27] M. Tanaka, G. Girard, R. Davis, A. Peuto, and N. Bignell. Recommended table for the density of water between 0∘C and 40∘C based on recent experimental reports. Metrologia, 38(4):301, 2001.
- [28] M. L. Huber, R. A. Perkins, A. Laesecke, D. G. Friend, J. V. Sengers, M. J. Assael, I. N. Metaxa, E. Vogel, R. Mareš, and K. Miyagawa. New international formulation for the viscosity of H2O. J. Phys. Chem. Ref. Data, 38(2):101–125, 2009.
- [29] J. M. Aristoff and J. W. M. Bush. Water entry of small hydrophobic spheres. J. Fluid Mech., 619:45–78, 2009.
- [30] M. D. Griffith, J. Leontini, M. C. Thompson, and K. Hourigan. Vortex shedding and three-dimensional behaviour of flow past a cylinder confined in a channel. J. Fluids Struct., 27(5-6):855–860, 2011.
- [31] B. Müller-Graf. Six contributions to the hydrodynamics of high speed marine vehicles. Technical Report IO85/87, Versuchsanstalt für Wasserbau und Schiffbau, Berlin, Germany, 1987.
- [32] A. L. C. Fujarra, C. P. Pesce, F. Flemming, and C. H. K. Williamson. Vortex-induced vibration of a flexible cantilever. J. Fluids Struct., 15(3-4):651–658, 2001.
- [33] T. Sarpkaya. A critical review of the intrinsic nature of vortex-induced vibrations. J. Fluids Struct., 19(4):389–447, 2004.
- [34] C. H. K. Williamson and R. Govardhan. Vortex-induced vibrations. Annu. Rev. Fluid Mech., 36:413–455, 2004.
- [35] G. R. Franzini, R. T. Goncalves, J. R. Meneghini, and A. L. C. Fujarra. Comparison between force measurements of one and two degrees-of-freedom VIV on cylinder with small and large mass ratio. In 10th International Conference on Flow-Induced Vibration and Flow-Induced Noise, Dublin, July 2012.
- [36] G. Gomit. Développement de techniques de mesure de surfaces libres par moyens optiques: Application à l’analyse de l’écoulement généré par un modèle de bateau en bassin des carènes. PhD thesis, Université de Poitiers, 2013.
- [37] D. Chehata, R. Zenit, and C. R. Wassgren. Dense granular flow around an immersed cylinder. Phys. Fluids, 15(6):1622–1631, 2003.
- [38] D. J. Farivar. Turbulent uniform flow around cylinders of finite length. AIAA J., 19(3):275–281, 1981.
- [39] T. A. Fox and G. S. West. Fluid-induced loading of cantilevered circular cylinders in a low-turbulence uniform flow. Part 1: Mean loading with aspect ratios in the range 4 to 30. J. Fluids Struct., 7(1):1–14, 1993.
- [40] H.-F. Li, H.-X. Chen, M. A. Zheng, and Z. Yi. Experimental and numerical investigation of free surface vortex. J. Hydrodynamics, Ser. B, 20(4):485–491, 2008.
- [41] H. Schlichting, K. Gersten, E. Krause, H. Oertel, and K. Mayes. Boundary-layer theory. Springer, 1955.
- [42] I. Kumagai, Y. Murai, Y. Tasaka, and N. Nakamura. Bubble generation by a cylinder moving beneath a free surface. J. Fluid Sci. Techno., 6(6):851–859, 2011.
- [43] T. T. Truscott, B. P. Epps, and J. Belden. Water entry of projectiles. Ann. Rev. fluid Mech., 46:355–378, 2014.