pnasresearcharticle \leadauthorChure \authordeclarationThe authors declare no conflict of interest. \correspondingauthor1To whom correspondence should be addressed. E-mail: phillips@pboc.caltech.edu
The Energetics of Molecular Adaptation in Transcriptional Regulation
Abstract
Mutation is a critical mechanism by which evolution explores the functional landscape of proteins. Despite our ability to experimentally inflict mutations at will, it remains difficult to link sequence-level perturbations to systems-level responses. Here, we present a framework centered on measuring changes in the free energy of the system to link individual mutations in an allosteric transcriptional repressor to the parameters which govern its response. We find the energetic effects of the mutations can be categorized into several classes which have characteristic curves as a function of the inducer concentration. We experimentally test these diagnostic predictions using the well-characterized LacI repressor of Escherichia coli, probing several mutations in the DNA binding and inducer binding domains. We find that the change in gene expression due to a point mutation can be captured by modifying only a subset of the model parameters that describe the respective domain of the wild-type protein. These parameters appear to be insulated, with mutations in the DNA binding domain altering only the DNA affinity and those in the inducer binding domain altering only the allosteric parameters. Changing these subsets of parameters tunes the free energy of the system in a way that is concordant with theoretical expectations. Finally, we show that the induction profiles and resulting free energies associated with pairwise double mutants can be predicted with quantitative accuracy given knowledge of the single mutants, providing an avenue for identifying and quantifying epistatic interactions.
keywords:
Transcriptional Regulation Allostery MWC Model Statistical Mechanics Epistasis Biophysics Evolution MutationWe present a biophysical model of allosteric transcriptional regulation that directly links the location of a mutation within a repressor to the biophysical parameters that describe its behavior. We explore the phenotypic space of a repressor with mutations in either the inducer binding or DNA binding domains. Using the LacI repressor in E. coli, we make sharp, falsifiable predictions and use this framework to generate a null hypothesis for how double mutants behave given knowledge of the single mutants. Linking mutations to the parameters which govern the system allows for quantitative predictions of how the free energy of the system changes as a result, permitting coarse graining of high-dimensional data into a single-parameter description of the mutational consequences.
Thermodynamic treatments of transcriptional regulation have been fruitful in their ability to generate quantitative predictions of gene expression as a function of a minimal set of physically meaningful variables (1, 2, 3, 4, 5, 6, 7, 8, 9, 10, 11, 12, 13). These models quantitatively describe numerous properties of input-output functions, such as the leakiness, saturation, dynamic range, steepness of response, and the [] – the concentration of inducer at which the response is half maximal. The mathematical forms of these phenotypic properties are couched in terms of a minimal set of experimentally accessible variables, such as the inducer concentration, transcription factor copy number, and the DNA sequence of the binding site (10). While the amino acid sequence of the transcription factor is another controllable variable, it is seldom implemented in quantitative terms considering mutations with subtle changes in chemistry frequently result in unpredictable physiological consequences. In this work, we examine how a series of mutations in either the DNA binding or inducer binding domains of a transcriptional repressor influence the values of the biophysical parameters which govern its regulatory behavior.
We first present a theoretical framework for understanding how mutations in the repressor affect different parameters and alter the free energy of the system. The multi-dimensional parameter space of the aforementioned thermodynamic models is highly degenerate with multiple combinations of parameter values yielding the same phenotypic response. This degeneracy can be subsumed into the free energy of the system, transforming the input-output function into a one-dimensional description with the form of a Fermi function (14, 15). We find that the parameters capturing the allosteric nature of the repressor, the repressor copy number, and the DNA binding specificity contribute independently to the free energy of the system with different degrees of sensitivity. Furthermore, changes restricted to one of these three groups of parameters result in characteristic changes in the free energy relative to the wild-type repressor, providing falsifiable predictions of how different classes of mutations should behave.
Next, we test these descriptions experimentally using the well-characterized transcriptional repressor of the lac operon LacI in E. coli regulating expression of a fluorescent reporter. We introduce a series of point mutations in either the inducer binding or DNA binding domain. We then measure the full induction profile of each mutant, determine the minimal set of parameters that are affected by the mutation, and predict how each mutation tunes the free energy at different inducer concentrations, repressor copy numbers, and DNA binding strengths. We find in general that mutations in the DNA binding domain only influence DNA binding strength, and that mutations within the inducer binding domain affect only the parameters which dictate the allosteric response. The degree to which these parameters are insulated is notable, as the very nature of allostery suggests that all parameters are intimately connected, thus enabling binding events at one domain to be "sensed" by another.
With knowledge of how a collection of DNA binding and inducer binding single mutants behave, we predict the induction profiles and the free energy changes of pairwise double mutants with quantitative accuracy. We find that the energetic effects of each individual mutation are additive, indicating that epistatic interactions are absent between the mutations examined here. Our model provides a means for identifying and quantifying the extent of epistatic interactions in a more complex set of mutations, and can shed light on how the protein sequence and general regulatory architecture coevolve.
Results
This work considers the inducible simple repression regulatory motif [depicted in Fig. 1(A)] from a thermodynamic perspective which has been thoroughly dissected and tested experimentally (4, 6, 10). While we direct the reader to the SI text for a complete derivation, the result of this extensive theory-experiment dialogue is a succinct input-output function [schematized in Fig. 1(B)] that computes the fold-change in gene expression relative to an unregulated promoter. This function is of the form
| (1) |
where is the number of active repressors per cell, is the number of non-specific binding sites for the repressor, is the binding energy of the repressor to its specific binding site relative to the non-specific background, and is defined as where is the Boltzmann constant and is the temperature. While this theory requires knowledge of the number of active repressors, we often only know the total number which is the sum total of active and inactive repressors. We can define a prefactor which captures the allosteric nature of the repressor and encodes the probability a repressor is in the active (repressive) state rather than the inactive state for a given inducer concentration , namely,
| (2) |
Here, and are the dissociation constants of the inducer to the active and inactive repressor, is the energetic difference between the repressor active and inactive states, and is the number of allosteric binding sites per repressor molecule ( for LacI). With this in hand, we can define in (1) as .
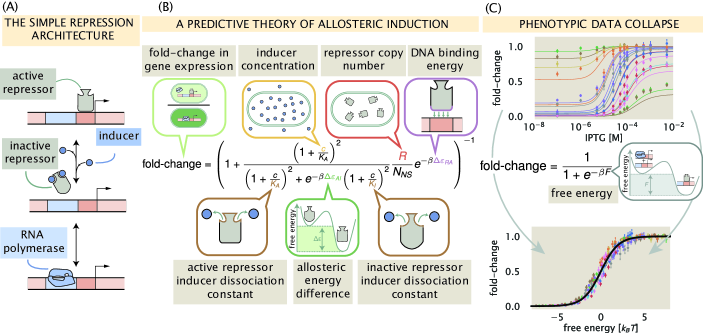
A key feature of (1) and (2) is that the diverse phenomenology of the gene expression induction profile can be collapsed onto a single master curve by rewriting the input-output function in terms of the free energy [also called the Bohr parameter (16)],
| (3) |
where
| (4) |
Hence, if different combinations of parameters yield the same free energy, they will give rise to the same fold-change in gene expression, enabling us to collapse multiple regulatory scenarios onto a single curve. This can be seen in Fig. 1(C) where eighteen unique inducer titration profiles of a LacI simple repression architecture collected and analyzed in Razo-Mejia et al. 2018 (10) collapse onto a single master curve. The tight distribution about this curve reveals that fold-change across a variety of genetically distinct individuals can be adequately described by a small number of parameters. Beyond predicting the induction profiles of different strains, the method of data collapse inspired by (3) and (4) can be used as a tool to identify mechanistic changes in the regulatory architecture (14). Similar data collapse approaches have been used previously in such a manner and have proved vital for distinguishing between changes in parameter values and changes in the fundamental behavior of the system (14, 15).
Assuming that a given mutation does not result in a non-functional protein, it is reasonable to say that any or all of the parameters in (1) can be affected by the mutation, changing the observed induction profile and therefore the free energy. To examine how the free energy of a mutant differs from that of the wild-type , we define , which has the form
| (5) | ||||
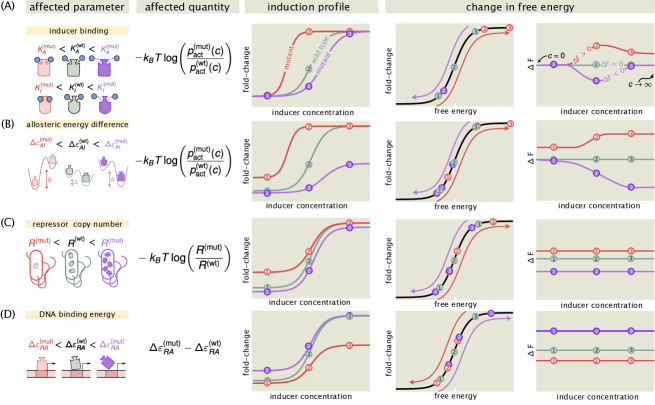
describes how a mutation translates a point across the master curve shown in Fig. 1(C). As we will show in the coming paragraphs [illustrated in Fig. 2], this formulation coarse grains the myriad parameters shown in (1) and (2) into three distinct quantities, each with different sensitivities to parametric changes. By examining how a mutation changes the free energy changes as a function of the inducer concentration, one can draw conclusions as to which parameters have been modified based solely on the shape of the curve. To help the reader understand how various perturbations to the parameters tune the free energy, we have hosted an interactive figure on the paper website which makes exploration of parameter space a simpler task.
The first term in (5) is the log ratio of the probability of a mutant repressor being active relative to the wild type at a given inducer concentration . This quantity defines how changes to any of the allosteric parameters – such as inducer binding constants and , or active/inactive state energetic difference – alter the free energy , which can be interpreted as the free energy difference between the repressor bound and unbound states of the promoter. Fig. 2 (A) illustrates how changes to the inducer binding constants and alone alter the induction profiles and resulting free energy as a function of the inducer concentration. In the limit where , the values of and do not factor into the calculation of given by (2), meaning that is the lone parameter setting the residual activity of the repressor. Thus, if only and are altered by a mutation, then should be when , illustrated by the overlapping red, purple, and grey curves in the right-hand plot of Fig. 2(A). However, if is influenced by the mutation (either alone or in conjunction with and ), the leakiness will change, resulting in a non-zero when . This is illustrated in Fig. 2 (B) where is the only parameter affected by the mutation.
It is important to note that for a mutation which perturbs only the inducer binding constants, the dependence of on the inducer concentration can be non-monotonic. While the precise values of and control the sensitivity of the repressor to inducer concentration, it is the ratio that defines whether this non-monotonic behavior is observed. This can be seen more clearly when we consider the limit of saturating inducer concentration,
| (6) |
which illustrates that returns to zero at saturating inducer concentration when is the same for both the mutant and wild-type repressors, so long as is unperturbed. Non-monotonicity can only be achieved by changing and and therefore serves as a diagnostic for classifying mutational effects reliant solely on measuring the change in free energy.
The second term in (5) captures how changes in the repressor copy number contributes to changes in free energy. It is important to note that this contribution to the free energy change depends on the total number of repressors in the cell, not just those in the active state. This emphasizes that changes in the expression of the repressor are energetically divorced from changes to the allosteric nature of the repressor. As a consequence, the change in free energy is constant for all inducer concentrations, as is schematized in Fig. 2(C). Because magnitude of the change in free energy scales logarithmically with changing repressor copy number, a mutation which increases expression from 1 to 10 repressors per cell is more impactful from an energetic standpoint () than an increase from 90 to 100 (). Appreciable changes in the free energy only arise when variations in the repressor copy number are larger than or comparable to an order of magnitude. Changes of this magnitude are certainly possible from a single point mutation, as it has been shown that even synonymous substitutions can drastically change translation efficiency (17).
The third and final term in (5) is the difference in the DNA binding energy between the mutant and wild-type repressors. All else being equal, if the mutated state binds more tightly to the DNA than the wild type (), the net change in the free energy is negative, indicating that the repressor bound states become more energetically favorable due to the mutation. Much like in the case of changing repressor copy number, this quantity is independent of inducer concentration and is therefore also constant [Fig. 2(D)]. However, the magnitude of the change in free energy is linear with DNA binding affinity while it is logarithmic with respect to changes in the repressor copy number. Thus, to change the free energy by , the repressor copy number must change by a factor of whereas the DNA binding energy must change by .
The unique behavior of each quantity in (5) and its sensitivity with respect to the parameters makes useful as a diagnostic tool to classify mutations. Given a set of fold-change measurements, a simple rearrangement of (3) permits the direct calculation of the free energy, assuming that the underlying physics of the regulatory architecture has not changed. Thus, it becomes possible to experimentally test the general assertions made in Fig. 2.
DNA Binding Domain Mutations
With this arsenal of analytic diagnostics, we can begin to explore the mutational space of the repressor and map these mutations to the biophysical parameters they control. As one of the most thoroughly studied transcription factors, LacI has been subjected to numerous crystallographic and mutational studies (18, 19, 20, 21). One such work generated a set of point mutations in the LacI repressor and examined the diversity of the phenotypic response to different allosteric effectors (5). However, experimental variables such as the repressor copy number or the number of specific binding sites were not known, making precise calculation of as presented here not tractable. Using this dataset as a guide, we chose a subset of the mutations and inserted them into our experimental strains of E. coli where these parameters are known and tightly controlled (4, 10).
We made three amino acid substitutions (Y20I, Q21A, and Q21M) that are critical for the DNA-repressor interaction. These mutations were introduced into the lacI sequence used in Garcia and Phillips 2011 (4) with four different ribosomal binding site sequences that were shown (via quantitative Western blotting) to tune the wild-type repressor copy number across three orders of magnitude. These mutant constructs were integrated into the E. coli chromosome harboring a Yellow Fluorescent Protein (YFP) reporter. The YFP promoter included the native O2 LacI operator sequence which the wild-type LacI repressor binds with high specificity (). The fold-change in gene expression for each mutant across twelve concentrations of IPTG was measured via flow cytometry. As we mutated only a single amino acid with the minimum number of base pair changes to the codons from the wild-type sequence, we find it unlikely that the repressor copy number was drastically altered from those reported in (4) for the wild-type sequence paired with the same ribosomal binding site sequences. In characterizing the effects of these DNA binding mutations, we take the repressor copy number to be unchanged. Any error introduced by this mutation should be manifest as a larger than predicted systematic shift in the free energy change when the repressor copy number is varied.

A naïve hypothesis for the effect of a mutation in the DNA binding domain is that only the DNA binding energy is altered. This hypothesis appears to contradict the core principle of allostery in that ligand binding in one domain influences binding in another, suggesting that changing any parameter modifies them all. The characteristic curves summarized in Fig. 2 give a means to discriminate between these two hypotheses by examining the change in the free energy. Using a single induction profile (white-faced points in Fig. 3), we estimated the DNA binding energy using a Bayesian approach, the details of which are discussed in the Materials and Methods as well as the SI text. The shaded red region for each mutant in Fig. 3 represents the 95% credible region of this fit whereas all other shaded regions are 95% credible regions of the predictions for other repressor copy numbers. We find that redetermining only the DNA binding energy accurately captures the majority of the induction profiles, indicating that other parameters are unaffected. One exception is for the lowest repressor copy numbers ( and per cell) of mutant Q21A at low concentrations of IPTG. However, we note that this disagreement is comparable to that observed for the wild-type repressor binding to the weakest operator in Razo-Mejia et al. 2018 (10), illustrating that our model is imperfect in characterizing weakly repressing architectures. Including other parameters in the fit (such as ) does not significantly improve the accuracy of the predictions. Furthermore, the magnitude of this disagreement also depends on the choice of the fitting strain (see SI text).
Mutations Y20I and Q21A both weaken the affinity of the repressor to the DNA relative to the wild type strain ( and , respectively). Here we report the median of the inferred posterior probability distribution with the superscripts and subscripts corresponding to the upper and lower bounds of the 95% credible region. These binding energies are comparable to that of the wild-type repressor affinity to the native LacI operator sequence O3, with a DNA binding energy of . The mutation Q21M increases the strength of the DNA-repressor interaction relative to the wild-type repressor with a binding energy of , comparable to the affinity of the wild-type repressor to the native O1 operator sequence (). It is notable that a single amino acid substitution of the repressor is capable of changing the strength of the DNA binding interaction well beyond that of many single base-pair mutations in the operator sequence (22, 4).
Using the new DNA binding energies, we can collapse all measurements of fold-change as a function of the free energy as shown in Fig. 3(B). This allows us to test the diagnostic power of the decomposition of the free energy described in Fig. 2. To compute the for each mutation, we inferred the observed mean free energy of the mutant strain for each inducer concentration and repressor copy number (see Materials and Methods as well as the SI text for a detailed explanation of the inference). We note that in the limit of extremely low or high fold-change, the inference of the free energy is either over- or under-estimated, respectively, introducing a systematic error. Thus, points which are close to these limits are omitted in the calculation of . We direct the reader to the SI text for a detailed discussion of this systematic error. With a measure of for each mutant at each repressor copy number, we compute the difference in free energy relative to the wild-type strain with the same repressor copy number and operator sequence, restricting all variability in solely to changes in .
The change in free energy for each mutant is shown in Fig. 3(C). It can be seen that the for each mutant is constant as a function of the inducer concentration and is concordant with the prediction generated from fitting to a single repressor copy number [red lines Fig. 3(C)]. This is in line with the predictions outlined in Fig. 2(C) and (D), indicating that the allosteric parameters are "insulated", meaning they are not affected by the DNA binding domain mutations. As the for all repressor copy numbers collapses onto the prediction, we can say that the expression of the repressor itself is the same or comparable with that of the wild type. If the repressor copy number were perturbed in addition to , one would expect a shift away from the prediction that scales logarithmically with the change in repressor copy number. However, as the is approximately the same for each repressor copy number, it can be surmised that the mutation does not significantly change the expression or folding efficiency of the repressor itself. These results allow us to state that the DNA binding energy is the only parameter modified by the DNA mutants examined.
Inducer Binding Domain Mutations
Much as in the case of the DNA binding mutants, we cannot safely assume a priori that a given mutation in the inducer binding domain affects only the inducer binding constants and . While it is easy to associate the inducer binding constants with the inducer binding domain, the critical parameter in our allosteric model is harder to restrict to a single spatial region of the protein. As , , and are all parameters dictating the allosteric response, we consider two hypotheses in which inducer binding mutations alter either all three parameters or only and .
We made four point mutations within the inducer binding domain of LacI (F164T, Q294V, Q294R, and Q294K) that have been shown previously to alter binding to multiple allosteric effectors (5). In contrast to the DNA binding domain mutants, we paired the inducer binding domain mutations with the three native LacI operator sequences (which have various affinities for the repressor) and a single ribosomal binding site sequence. This ribosomal binding site sequence, as reported in (4), expresses the wild-type LacI repressor to an average copy number of approximately per cell. As the free energy differences resulting from point mutations in the DNA binding domain can be described solely by changes to , we continue under the assumption that the inducer binding domain mutations do not significantly alter the repressor copy number.
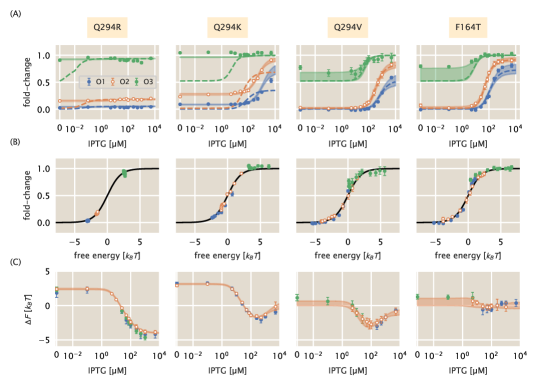
The induction profiles for these four mutants are shown in Fig. 4(A). Of the mutations chosen, Q294R and Q294K appear to have the most significant impact, with Q294R abolishing the characteristic sigmoidal titration curve entirely. It is notable that both Q294R and Q294K have elevated expression in the absence of inducer compared to the other two mutants paired with the same operator sequence. Panel (A) in Fig. 2 illustrates that if only and were being affected by the mutations, the fold-change should be identical for all mutants in the absence of inducer. This discrepancy in the observed leakiness immediately suggests that more than and are affected for Q294K and Q294R.
Using a single induction profile for each mutant (shown in Fig. 4 as white-faced circles), we inferred the parameter combinations for both hypotheses and drew predictions for the induction profiles with other operator sequences. We find that the simplest hypothesis (in which only and are altered) does not permit accurate prediction of most induction profiles. These curves, shown as dotted lines in Fig. 4(A), fail spectacularly in the case of Q294R and Q294K, and undershoot the observed profiles for F164T and Q294V, especially when paired with the weak operator sequence O3. The change in the leakiness for Q294R and Q294K is particularly evident as the expression at should be identical to the wild-type repressor under this hypothesis. Altering only and is not sufficient to accurately predict the induction profiles for F164T and Q294V, but not to the same degree as Q294K and Q294R. The disagreement is most evident for the weakest operator O3 [green lines in Fig. 4(A)], though we have discussed previously that the induction profiles for weak operators are difficult to accurately describe and can result in comparable disagreement for the wild-type repressor (10, 22).
Including as a perturbed parameter in addition to and improves the predicted profiles for all four mutants. By fitting these three parameters to a single strain, we are able to accurately predict the induction profiles of other operators as seen by the shaded lines in Fig. 4(A). With these modified parameters, all experimental measurements collapse as a function of their free energy as prescribed by (3) [Fig. 4(B)]. All four mutations significantly diminish the binding affinity of both states of the repressor to the inducer, as seen by the estimated parameter values reported in Tab. LABEL:tab:ind_params. As evident in the data alone, Q294R abrogates inducibility outright (). For Q294K, the active state of the repressor can no longer bind inducer whereas the inactive state binds with weak affinity. The remaining two mutants, Q294V and F164T, both show diminished binding affinity of the inducer to both the active and inactive states of the repressor relative to the wild-type.
| Mutant | [] | Reference | ||
|---|---|---|---|---|
| WT | M | M | 4.5 | (10) |
| F164T | M | M | This study | |
| Q294V | M | M | This study | |
| Q294K | mM | M | This study | |
| Q294R | M | M | This study |
Given the collection of fold-change measurements, we computed the relative to the wild-type strain with the same operator and repressor copy number. This leaves differences in as the sole contributor to the free energy difference, assuming our hypothesis that , , and are the only perturbed parameters is correct. The change in free energy can be seen in Fig. 4(C). For all mutants, the free energy difference inferred from the observed fold-change measurements falls within error of the predictions generated under the hypothesis that , , and are all affected by the mutation [shaded curves in Fig. 4(C)]. The profile of the free energy change exhibits some of the rich phenomenology illustrated in Fig. 2(A) and (B). Q294K, F164T, and Q294V exhibit a non-monotonic dependence on the inducer concentration, a feature that can only appear when and are altered. The non-zero at for Q294R and Q294K coupled with an inducer concentration dependence is a telling sign that must be significantly modified. This shift in is positive in all cases, indicating that must have decreased, and that the inactive state has become more energetically favorable for these mutants than for the wild-type protein. Indeed the estimates for (Tab. LABEL:tab:ind_params) reveal both mutations Q294R and Q294K make the inactive state more favorable than the active state. Thus, for these two mutations, only of the repressors are active in the absence of inducer, whereas the basal active fraction is for the wild-type repressor (10).
Taken together, these parametric changes diminish the response of the regulatory architecture as a whole to changing inducer concentrations. They furthermore reveal that the parameters which govern the allosteric response are interdependent and no single parameter is insulated from the others. However, as only the allosteric parameters are changed, one can say that the allosteric parameters as a whole are insulated from the other components which define the regulatory response, such as repressor copy number and DNA binding affinity.
Predicting Effects of Pairwise Double Mutations
Given full knowledge of each individual mutation, we can draw predictions of the behavior of the pairwise double mutants with no free parameters based on the simplest null hypothesis of no epistasis. The formalism of defined by (5) explicitly states that the contribution to the free energy of the system from the difference in DNA binding energy and the allosteric parameters are strictly additive. Thus, deviations from the predicted change in free energy would suggest epistatic interactions between the two mutations.
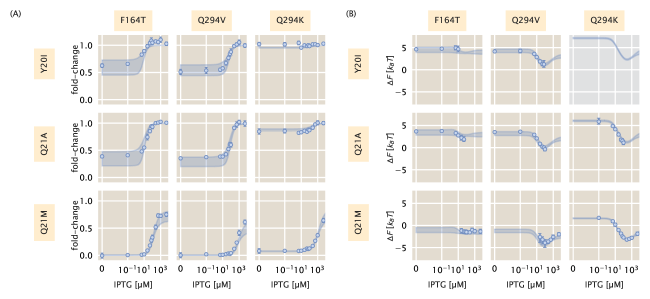
To test this additive model, we constructed nine double mutant strains, each having a unique inducer binding (F164T, Q294V, Q294K) and DNA binding mutation (Y20I, Q21A, Q21M). To make predictions with an appropriate representation of the uncertainty, we computed a large array of induction profiles given random draws from the posterior distribution for the DNA binding energy (determined from the single DNA binding mutants) as well as from the joint posterior for the allosteric parameters (determined from the single inducer binding mutants). These predictions, shown in Fig. 5(A) and (B) as shaded blue curves, capture all experimental measurements of the fold-change [Fig. 5(A)] and the inferred difference in free energy [Fig. 5(B)]. The latter indicates that there are no epistatic interactions between the mutations queried in this work, though if there were, systematic deviations from these predictions would shed light on how the epistasis is manifest.
The precise agreement between the predictions and measurements for Q294K paired with either Q21A or Q21M is striking as Q294K drastically changed in addition to and . Our ability to predict the induction profile and free energy change underscores the extent to which the DNA binding energy and the allosteric parameters are insulated from one another. Despite this insulation, the repressor still functions as an allosteric molecule, emphasizing that the mutations we have inserted do not alter the pathway of communication between the two domains of the protein. As the double mutant Y20I-Q294K exhibits fold-change of approximately across all IPTG concentrations [Fig. 5(A)], these mutations in tandem make repression so weak it is beyond the limits which are detectable by our experiments. As a consequence, we are unable to estimate nor experimentally verify the corresponding prediction [grey box in Fig. 5(B)]. However, as the predicted fold-change in gene expression is also approximately for all , we believe that the prediction shown for is likely accurate. One would be able to infer the to confirm these predictions using a more sensitive method for measuring the fold-change, such as single-cell microscopy or colorimetric assays.
Discussion
Allosteric regulation is often couched as “biological action at a distance". Despite extensive knowledge of protein structure and function, it remains difficult to translate the coordinates of the atomic constituents of a protein to the precise parameter values which define the functional response, making each mutant its own intellectual adventure. Bioinformatic approaches to understanding the sequence-structure relationship have permitted us to examine how the residues of allosteric proteins evolve, revealing conserved regions which hint to their function. Co-evolving residues reveal sectors of conserved interactions which traverse the protein that act as the allosteric communication channel between domains (23, 24, 25). Elucidating these sectors has advanced our understanding of how distinct domains "talk" to one another and has permitted direct engineering of allosteric responses into non-allosteric enzymes (26, 27, 28). Even so, we are left without a quantitative understanding of how these admittedly complex networks set the energetic difference between active and inactive states or how a given mutation influences binding affinity. In this context, a biophysical model in which the various parameters are intimately connected to the molecular details can be of use and can lead to quantitative predictions of the interplay between amino-acid identity and system-level response.
By considering how each parameter contributes to the observed change in free energy, we are able to tease out different classes of parameter perturbations which result in stereotyped responses to changing inducer concentration. These characteristic changes to the free energy can be used as a diagnostic tool to classify mutational effects. For example, we show in Fig. 2 that modulating the inducer binding constants and results in non-monotonic free energy changes that are dependent on the inducer concentration, a feature observed in the inducer binding mutants examined in this work. Simply looking at the inferred as a function of inducer concentration, which requires no fitting of the biophysical parameters, indicates that and must be modified considering those are the only parameters which can generate such a response.
Another key observation is that a perturbation to only and requires that the at . Deviations from this condition imply that more than the inducer binding constants must have changed. If this shift in off of at is not constant across all inducer concentrations, we can surmise that the energy difference between the allosteric states must also be modified. We again see this effect for all of our inducer mutants. By examining the inferred , we can immediately say that in addition to and , must decrease relative to the wild-type value as at . When the allosteric parameters are fit to the induction profiles, we indeed see that this is the case, with all four mutations decreasing the energy gap between the active and inactive states. Two of these mutations, Q294R and Q294K, make the inactive state of the repressor more stable than the active state, which is not the case for the wild-type repressor (10).
Our formulation of indicates that shifts away from that are independent of the inducer concentration can only arise from changes to the repressor copy number and/or DNA binding specificity, indicating that the allosteric parameters are untouched. We see that for three mutations in the DNA binding domain, is the same irrespective of the inducer concentration. Measurements of for these mutants with repressor copy numbers across three orders of magnitude yield approximately the same value, revealing that is the sole parameter altered via the mutations.
We note that the conclusions stated above can be qualitatively drawn without resorting to fitting various parameters and measuring the goodness-of-fit. Rather, the distinct behavior of is sufficient to determine which parameters are changing. Here, these conclusions are quantitatively confirmed by fitting these parameters to the induction profile, which results in accurate predictions of the fold-change and for nearly every strain across different mutations, repressor copy numbers, and operator sequence, all at different inducer concentrations. With a collection of evidence as to what parameters are changing for single mutations, we put our model to the test and drew predictions of how double mutants would behave both in terms of the titration curve and free energy profile.
A hypothesis that arises from our formulation of is that a simple summation of the energetic contribution of each mutation should be sufficient to predict the double mutants (so long as they are in separate domains). We find that such a calculation permits precise and accurate predictions of the double mutant phenotypes, indicating that there are no epistatic interactions between the mutations examined in this work. With an expectation of what the free energy differences should be, epistatic interactions could be understood by looking at how the measurements deviate from the prediction. For example, if epistatic interactions exist which appear as a systematic shift from the predicted independent of inducer concentration, one could conclude that DNA binding energy is not equal to that of the single mutation in the DNA binding domain alone. Similarly, systematic shifts that are dependent on the inducer concentration (i.e. not constant) indicate that the allosteric parameters must be influenced. If the expected difference in free energy is equal to when , one could surmise that the modified parameter must not be nor as these would both result in a shift in leakiness, indicating that and are further modified.
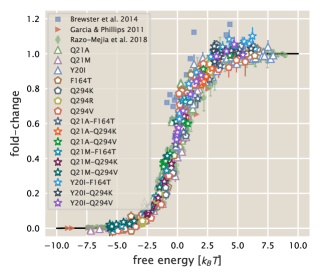
Ultimately, we present this work as a proof-of-principle for using biophysical models to investigate how mutations influence the response of allosteric systems. We emphasize that such a treatment allows one to boil down the complex phenotypic responses of these systems to a single-parameter description which is easily interpretable as a free energy. The general utility of this approach is illustrated in Fig. 6 where gene expression data from previous work (4, 6, 10) along with all of the measurements presented in this work collapse onto the master curve defined by (3). While our model coarse grains many of the intricate details of transcriptional regulation into two states (one in which the repressor is bound to the promoter and one where it is not), it is sufficient to describe a wide range of regulatory scenarios. Given enough parametric knowledge of the system, it becomes possible to examine how modifications to the parameters move the physiological response along this reduced one-dimensional parameter space. This approach offers a glimpse at how mutational effects can be described in terms of energy rather than Hill coefficients and arbitrary prefactors. While we have explored a very small region of sequence space in this work, coupling of this approach with high-throughput sequencing-based methods to query a library of mutations within the protein will shed light on the phenotypic landscape centered at the wild-type sequence. Furthermore, pairing libraries of protein and operator sequence mutants will provide insight as to how the protein and regulatory sequence coevolve, a topic rich with opportunity for a dialogue between theory and experiment.
Bacterial Strains and DNA Constructs
All wild-type strains from which the mutants were derived were generated in previous work from the Phillips group (4, 10). Briefly, mutations were first introduced into the lacI gene of our pZS3*1-lacI plasmid (4) using a combination of overhang PCR Gibson assembly as well as QuickChange mutagenesis (Agligent Technologies). The oligonucleotide sequences used to generate each mutant as well as the method are provided in the SI text.
For mutants generated through overhang PCR and Gibson assembly, oligonucleotide primers were purchased containing an overhang with the desired mutation and used to amplify the entire plasmid. Using the homology of the primer overhang, Gibson assembly was performed to circularize the DNA prior to electroporation into MG1655 E. coli cells. Integration of LacI mutants was performed with Red recombineering (29) as described in Reference (4).
The mutants studied in this work were chosen from data reported in (5). In selecting mutations, we looked for mutants which suggested moderate to strong deviations from the behavior of the wild-type repressor. We note that the variant of LacI used in this work has an additional three amino acids (Met-Val-Asn) added to the N-terminus than the canonical LacI sequence reported in (30). For this reason, all mutants given here are with respect to our sequence and their positions are shifted by three to those studied in (5).
Flow Cytometry
All fold-change measurements were performed on a MACSQuant flow cytometer as described in Razo-Mejia et al. (10). Briefly, saturated overnight cultures 500 L in volume were grown in deep-well 96 well plates covered with a breathable nylon cover (Lab Pak - Nitex Nylon, Sefar America, Cat. No. 241205). After approximately 12 to 15 hr, the cultures reached saturation and were diluted 1000-fold into a second 2 mL 96-deep-well plate where each well contained 500 L of M9 minimal media supplemented with 0.5% w/v glucose (anhydrous D-Glucose, Macron Chemicals) and the appropriate concentration of IPTG (Isopropyl -D-1-thiogalactopyranoside, Dioxane Free, Research Products International). These were sealed with a breathable cover and were allowed to grow for approximately 8 hours until the OD. Cells were then diluted ten-fold into a round-bottom 96-well plate (Corning Cat. No. 3365) containing 90 L of M9 minimal media supplemented with 0.5% w/v glucose along with the corresponding IPTG concentrations.
The flow cytometer was calibrated prior to use with MACSQuant Calibration Beads (Cat. No. 130-093-607). During measurement, the cultures were held at approximately 4∘ C by placing the 96-well plate on a MACSQuant ice block. All fluorescence measurements were made using a 488 nm excitation wavelength with a 525/50 nm emission filter. The photomultiplier tube voltage settings for the instrument are the same as those used in Reference (10).
The data was processed using an automatic unsupervised gating procedure based on the front and side- scattering values, where we fit a two-dimensional Gaussian function to the forward-scattering (FSC) and the side-scattering (SSC) data. Here we assume that the region with highest density of points in these two channels corresponds to single-cell measurements and consider data points that fall within 40% of the highest density region of the two-dimensional Gaussian function. We direct the reader to Reference (10) for further detail and comparison of flow cytometry with single-cell microscopy.
Bayesian Parameter Estimation
We used a Bayesian definition of probability in the statistical analysis of all mutants in this work. In the SI text, we derive in detail the statistical models used for the various parameters as well as multiple diagnostic tests. Here, we give a generic description of our approach. To be succinct in notation, we consider a generic parameter which represents , , , and/or depending on the specific LacI mutant.
As prescribed by Bayes’ theorem, we are interested in the posterior probability distribution
| (7) |
where we use and to represent probability densities over parameters and data, respectively, and to represent a set of fold-change measurements. The likelihood of observing our dataset given a value of is captured by . All prior information we have about the possible values of are described by .
In all inferential models used in this work, we assumed that all experimental measurements at a given inducer concentration were normally distributed about a mean value dictated by (1) with a variance ,
| (8) |
where is the number of measurements in the data set .
This choice of likelihood is justified as each individual measurement at a given inducer concentration is a biological replicate and independent of all other experiments. By using a Gaussian likelihood, we introduce another parameter . As must be positive and greater than zero, we define as a prior distribution a half-normal distribution with a standard deviation ,
| (9) |
where is a given range of values for . A standard deviation of was chosen given our knowledge of the scale of our measurement error from other experiments. As the absolute measurement of fold-change is restricted between and , and given our knowledge of the sensitivity of the experiment, it is reasonable to assume that the error will be closer to than to . Further justification of this choice of prior through simulation based methods are given in the SI text. The prior distribution for is dependent on the parameter and its associated physical and physiological restrictions. Detailed discussion of our chosen prior distributions for each model can also be found in the SI text.
All statistical modeling and parameter inference was performed using Markov chain Monte Carlo (MCMC). Specifically, Hamiltonian Monte Carlo sampling was used as sis implemented in the Stan probabilistic programming language (31). All statistical models saved as .stan models and can be accessed at the GitHub repository associated with this work (DOI: 10.5281/zenodo.2721798) or can be downloaded directly from the paper website.
Inference of Free Energy From Fold-Change Data
While the fold-change in gene expression is restricted to be between 0 and 1, experimental noise can generate fold-change measurements beyond these bounds. To determine the free energy for a given set of fold-change measurements (for one unique strain at a single inducer concentration), we modeled the observed fold-change measurements as being drawn from a normal distribution with a mean and standard deviation . Using Bayes’ theorem, we can write the posterior distribution as
| (10) |
where is a collection of fold-change measurements. The prior distribution for was chosen to be uniform between 0 and 1 while the prior on was chosen to be half normal, as written in (9). The posterior distribution was sampled independently for each set of fold-change measurements using MCMC. The .stan model for this inference is available on the paper website.
For each MCMC sample of , the free energy was calculated as
| (11) |
which is simply the rearrangement of (3). Using simulated data, we determined that when or , the mean fold-change in gene expression was over or underestimated for the lower and upper limit, respectively. This means that there are maximum and minimum levels of fold-change that can be detected using flow cytometry which are set by the distribution of fold-change measurements resulting from various sources of day-to-day variation. This results in a systematic error in the calculation of the free energy, making proper inference beyond these limits difficult. This bounds the range in which we can confidently infer this quantity with flow cytometry. We hypothesize that more sensitive methods, such as single cell microscopy, colorimetric assays, or direct counting of mRNA transcripts via Fluorescence In Situ Hybridization (FISH) would improve the measurement of . We further discuss details of this limitation in the SI text.
Data and Code Availability
All data was collected, stored, and preserved using the Git version control software. Code for data processing, analysis, and figure generation is available on the GitHub repository (https://www.github.com/rpgroup-pboc/mwc_mutants) or can be accessed via the paper website. Raw flow cytometry data is stored on the CaltechDATA data repository and can be accessed via DOI 10.22002/D1.1241.
We thank Pamela Björkman, Rachel Galimidi, and Priyanthi Gnanapragasam for access and training for the use of the Miltenyi Biotec MACSQuant flow cytometer. The experimental efforts first took place at the Physiology summer course at the Marine Biological Laboratory in Woods Hole, MA, operated by the University of Chicago. We thank Ambika Nadkarni and Damian Dudka for their work on the project during the course. We also thank Suzannah Beeler, Justin Bois, Robert Brewster, Soichi Hirokawa, Heun Jin Lee, and Muir Morrison for thoughtful advice and discussion. This work was supported by La Fondation Pierre-Gilles de Gennes, the Rosen Center at Caltech, the NIH DP1 OD0002179 (Director’s Pioneer Award), R01 GM085286, and 1R35 GM118043 (MIRA). Nathan M. Belliveau was supported by a Howard Hughes Medical Institute International Student Research fellowship. \showacknow
References
- (1) Ackers GK, Johnson AD, Shea MA (1982) Quantitative model for gene regulation by lambda phage repressor. Proceedings of the National Academy of Sciences of the United States of America 79(4):1129–33.
- (2) Buchler NE, Gerland U, Hwa T (2003) On schemes of combinatorial transcription logic. Proceedings of the National Academy of Sciences of the United States of America 100(9):5136–41.
- (3) Vilar JM, Leibler S (2003) DNA Looping and Physical Constraints on Transcription Regulation. Journal of Molecular Biology 331(5):981–989.
- (4) Garcia HG, Phillips R (2011) Quantitative dissection of the simple repression input-output function. Proceedings of the National Academy of Sciences of the United States of America 108(29):12173–8.
- (5) Daber R, Sochor MA, Lewis M (2011) Thermodynamic analysis of mutant lac repressors. Journal of Molecular Biology 409(1):76–87.
- (6) Brewster RC, et al. (2014) The transcription factor titration effect dictates level of gene expression. Cell 156(6):1312–1323.
- (7) Weinert FM, Brewster RC, Rydenfelt M, Phillips R, Kegel WK (2014) Scaling of Gene Expression with Transcription-Factor Fugacity. Physical Review Letters 113(25):1–5.
- (8) Rydenfelt M, Garcia HG, Cox RS, Phillips R (2014) The influence of promoter architectures and regulatory motifs on gene expression in Escherichia coli. PLoS ONE 9(12):1–31.
- (9) Razo-Mejia M, et al. (2014) Comparison of the theoretical and real-world evolutionary potential of a genetic circuit. Physical biology 11(2):026005.
- (10) Razo-Mejia M, et al. (2018) Tuning Transcriptional Regulation through Signaling: A Predictive Theory of Allosteric Induction. Cell Systems 6(4):456–469.
- (11) Bintu L, et al. (2005) Transcriptional regulation by the numbers: models. Current Opinion in Genetics & Development 15(2):116–124.
- (12) Bintu L, et al. (2005) Transcriptional regulation by the numbers: Applications. Current Opinion in Genetics and Development 15(2):125–135.
- (13) Kuhlman T, Zhang Z, Saier MH, Hwa T (2007) Combinatorial transcriptional control of the lactose operon of Escherichia coli. Proceedings of the National Academy of Sciences of the United States of America 104(14):6043–6048.
- (14) Swem LR, Swem DL, Wingreen NS, Bassler BL (2008) Deducing Receptor Signaling Parameters from In Vivo Analysis: LuxN/AI-1 Quorum Sensing in Vibrio harveyi. Cell 134(3):461–473.
- (15) Keymer JE, Endres RG, Skoge M, Meir Y, Wingreen NS (2006) Chemosensing in Escherichia coli: Two regimes of two-state receptors. Proceedings of the National Academy of Sciences of the United States of America 103(6):1786–1791.
- (16) Phillips R, Milo R (2015) Rates and duration in Cell Biology by the Numbers.
- (17) Frumkin I, et al. (2018) Codon usage of highly expressed genes affects proteome-wide translation efficiency. Proceedings of the National Academy of Sciences 115(21):E4940–E4949.
- (18) Daber R, Stayrook S, Rosenberg A, Lewis M (2007) Structural Analysis of Lac Repressor Bound to Allosteric Effectors. Journal of Molecular Biology 370(4):609–619.
- (19) Daber R, Lewis M (2009) Towards evolving a better repressor. Protein Engineering, Design and Selection 22(11):673–683.
- (20) Lewis M, et al. (1996) Crystal Structure of the Lactose Operon Repressor and Its Complexes with DNA and Inducer. Science 271(5253).
- (21) Swerdlow SJ, Schaaper RM (2014) Mutagenesis in the lacI gene target of E. coli: improved analysis for lacI(d) and lacO mutants. Mutation research 770:79–84.
- (22) Barnes SL, Belliveau NM, Ireland WT, Kinney JB, Phillips R (2019) Mapping DNA sequence to transcription factor binding energy in vivo. PLoS Comput Biol 15(2).
- (23) Süel GM, Lockless SW, Wall MA, Ranganathan R (2002) Evolutionarily conserved networks of residues mediate allosteric communication in proteins. Nature Structural Biology 10(1):59–69.
- (24) McLaughlin Jr RN, Poelwijk FJ, Raman A, Gosal WS, Ranganathan R (2012) The spatial architecture of protein function and adaptation. Nature 491(7422):138–142.
- (25) Reynolds KA, McLaughlin RN, Ranganathan R (2011) Hot Spots for Allosteric Regulation on Protein Surfaces. Cell 147(7):1564–1575.
- (26) Raman S, Taylor N, Genuth N, Fields S, Church GM (2014) Engineering allostery. Trends in Genetics 30(12):521–8.
- (27) Raman AS, White KI, Ranganathan R (2016) Origins of Allostery and Evolvability in Proteins: A Case Study. Cell 166(2):468–80.
- (28) Poelwijk FJ, Krishna V, Ranganathan R (2016) The Context-Dependence of Mutations: A Linkage of Formalisms. PLOS Computational Biology 12(6):e1004771.
- (29) Sharan SK, Thomason LC, Kuznetsov SG, Court DL (2009) Recombineering: a homologous recombination-based method of genetic engineering. Nature Protocols 4(2):206–223.
- (30) Farabaugh PJ (1978) Sequence of the laci gene. Nature 274(24):5.
- (31) Carpenter B, et al. (2017) Stan: A probabilistic programming language. Journal of Statistical Software, Articles 76(1):1–32.